
All the Small Things…Watching, Waiting
“All the Small Things” was a massive hit for Blink-182 when it debuted on June 1, 1999. Interestingly, that release landed near the height of the dot-com bubble – a period when investors were obsessed with mega-cap tech titans like the Big Seven (Cisco, Microsoft, Intel, GE, Lucent, Oracle, and Dell). By March 24, 2000, the S&P 500 reached its peak, subsequently sliding 49.1% before finally bottoming on October 9, 2002.
That era also marked a critical crossroads with large-caps falling out of favor for nearly a decade, while a golden era was ushered in for small-caps (see Figure 1).
Figure 1. U.S. Large-Cap (S&P 500) Performance Relative to Small-Caps (S&P 600)
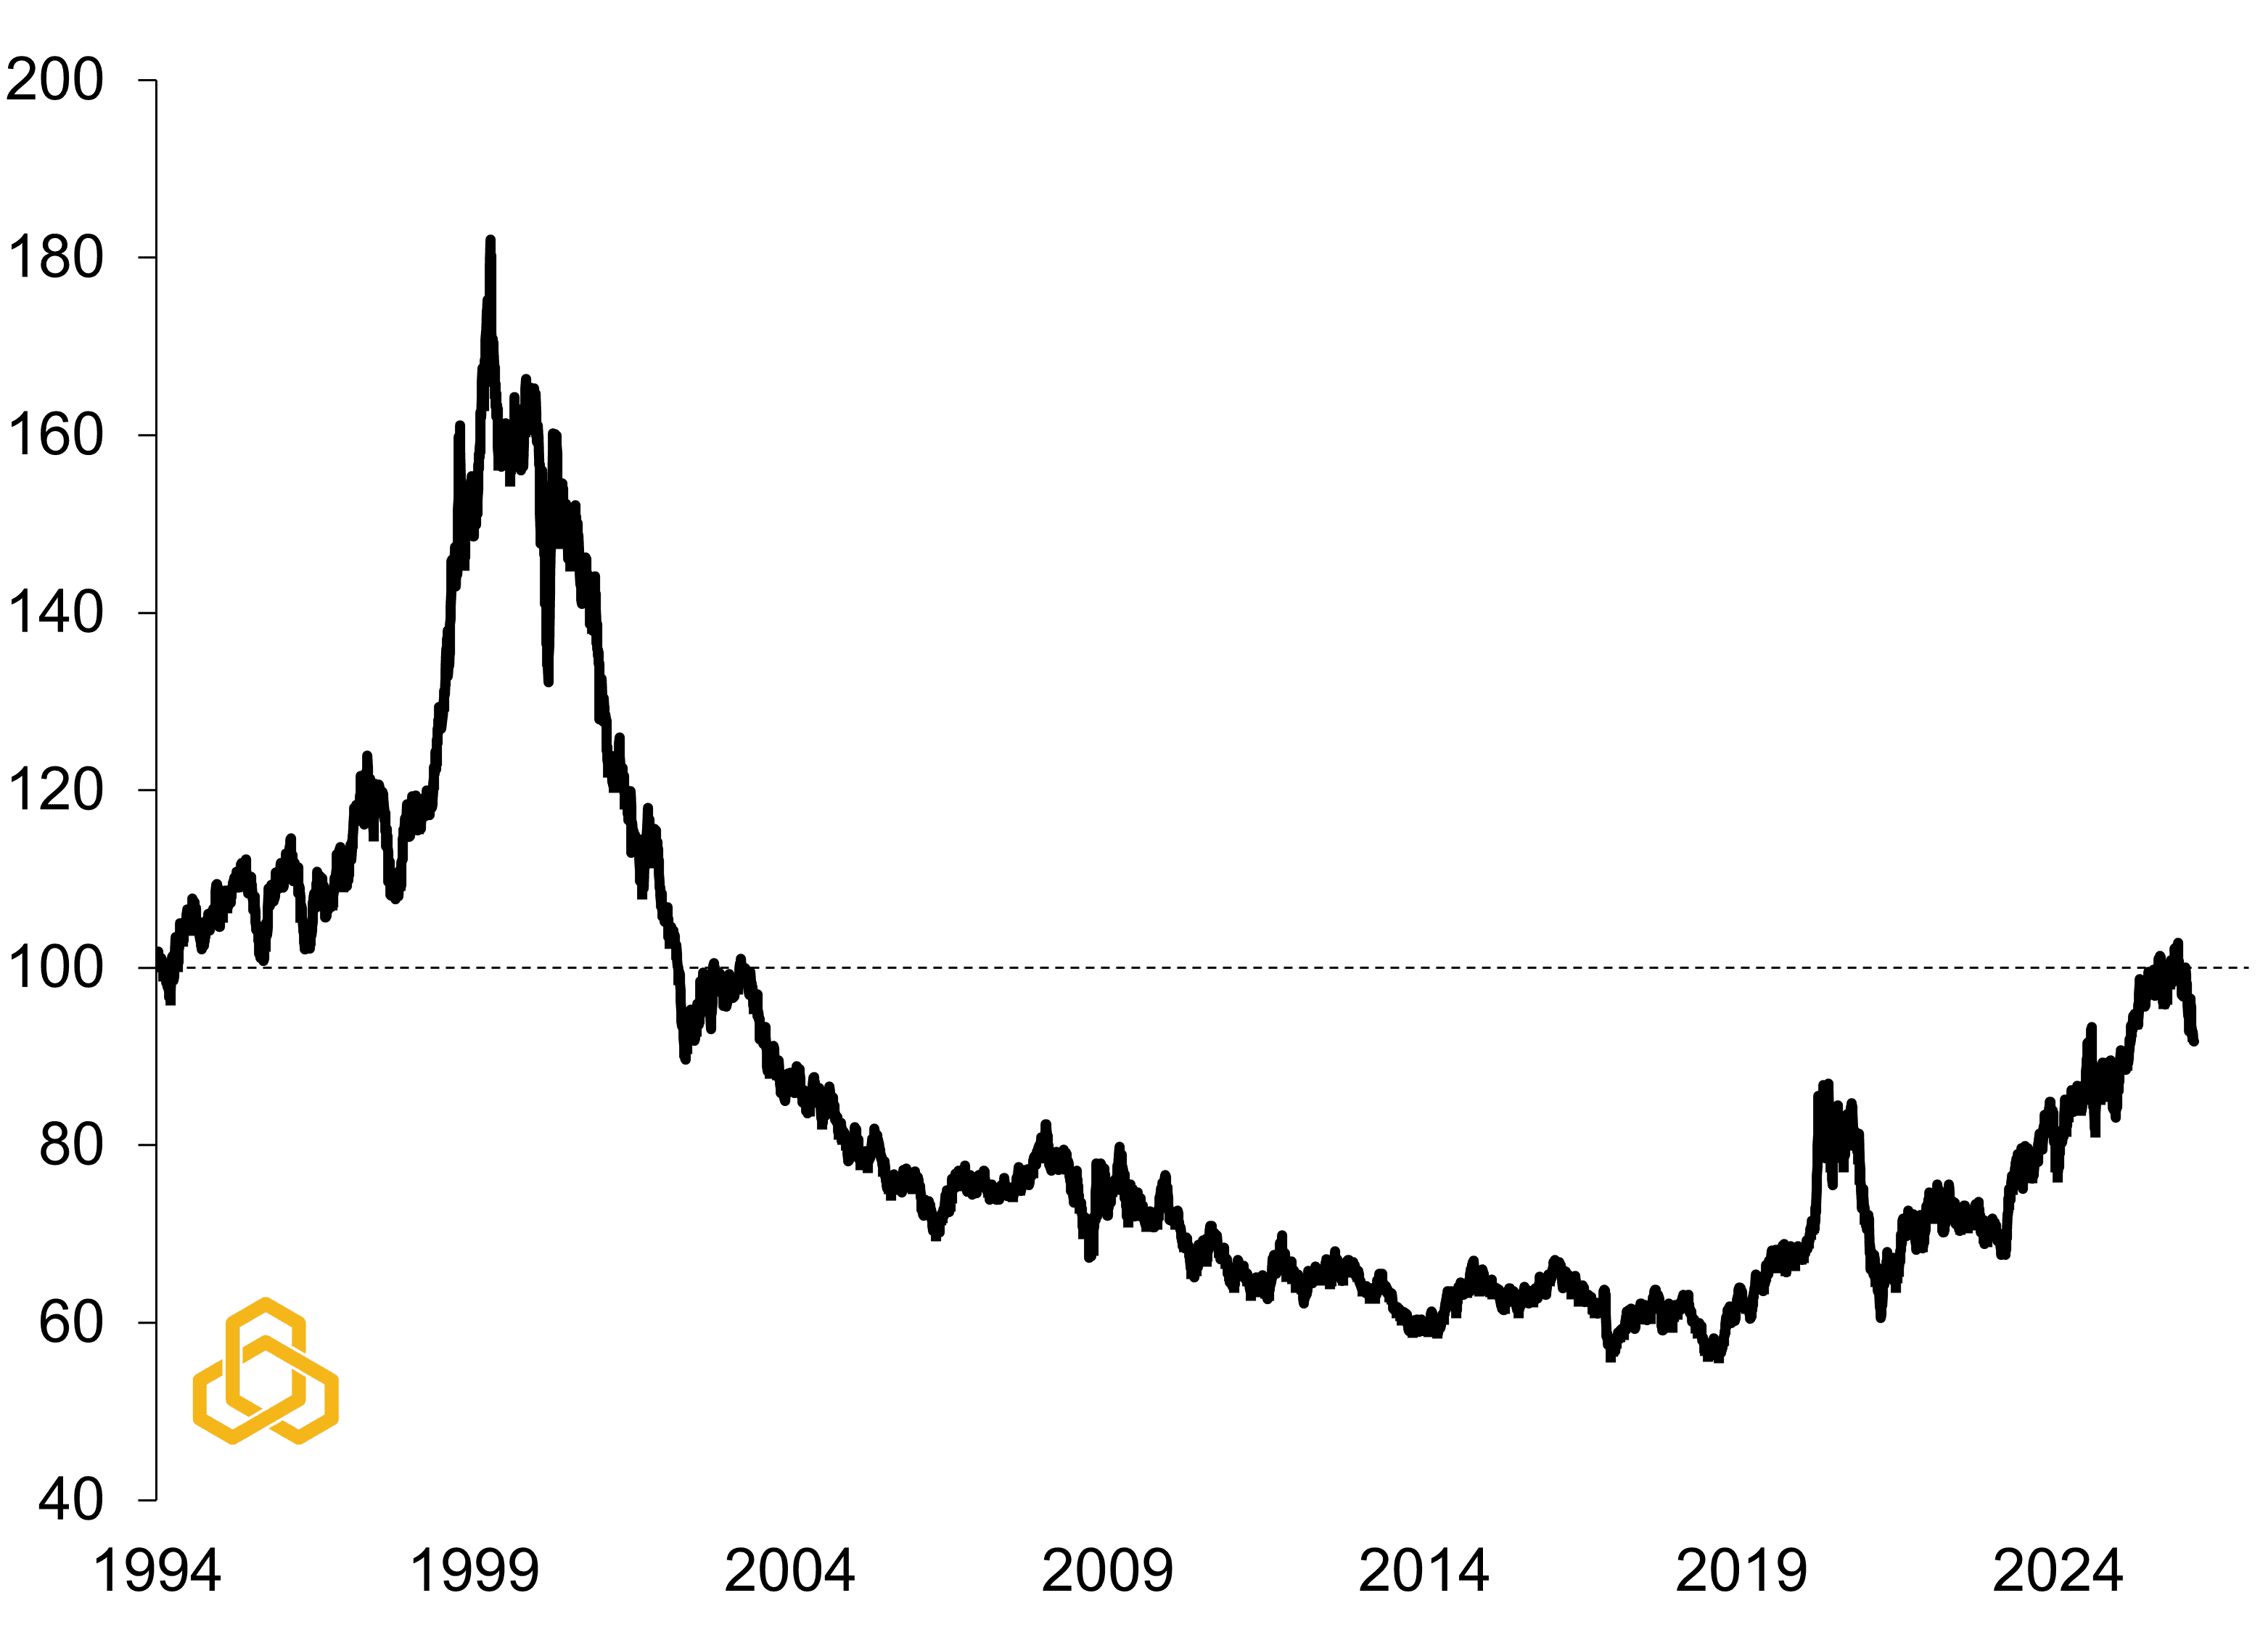
Sources: Standard & Poor’s, Bloomberg L.P., and Potomac. Data as of February 17, 2026. Data are indexed (12/31/1993-100). Past performance is no guarantee of future results. It is not possible to invest directly in an index.
A Sign of Things to Come?
To be clear, this is not a doomsday prediction. As the right side of figure 1 shows, the recent multi-year outperformance of large-caps remains much less parabolic than during the dot-com bubble.
Furthermore, the artificial intelligence (or AI) cycle appears to be in its early innings with the Information Technology sector’s earnings-per-share (EPS) year-on-year growth forecast to accelerate from 26.0% in 2025 to 32.3% in 2026 according to Bloomberg’s consensus estimates. At the sub-sector level, Semiconductor earnings are still expected to rise from an impressive 45.7% to a staggering 61.8%, and even Software and Services earnings are still expected to grow by double-digits (from 20.3% to 14.1%).
With numbers like these, calling for the “death of tech” seems premature. However, the recent volatility in software stocks does suggest that investors are becoming more selective (see Figure 2). It also indicates that AI is being increasingly viewed as a fundamental disruptor rather than a complementary tool. Much like the dot-com era led to technology that changed our lives forever.
Figure 2. S&P 500 Semiconductors & Equipment vs. Software & Services
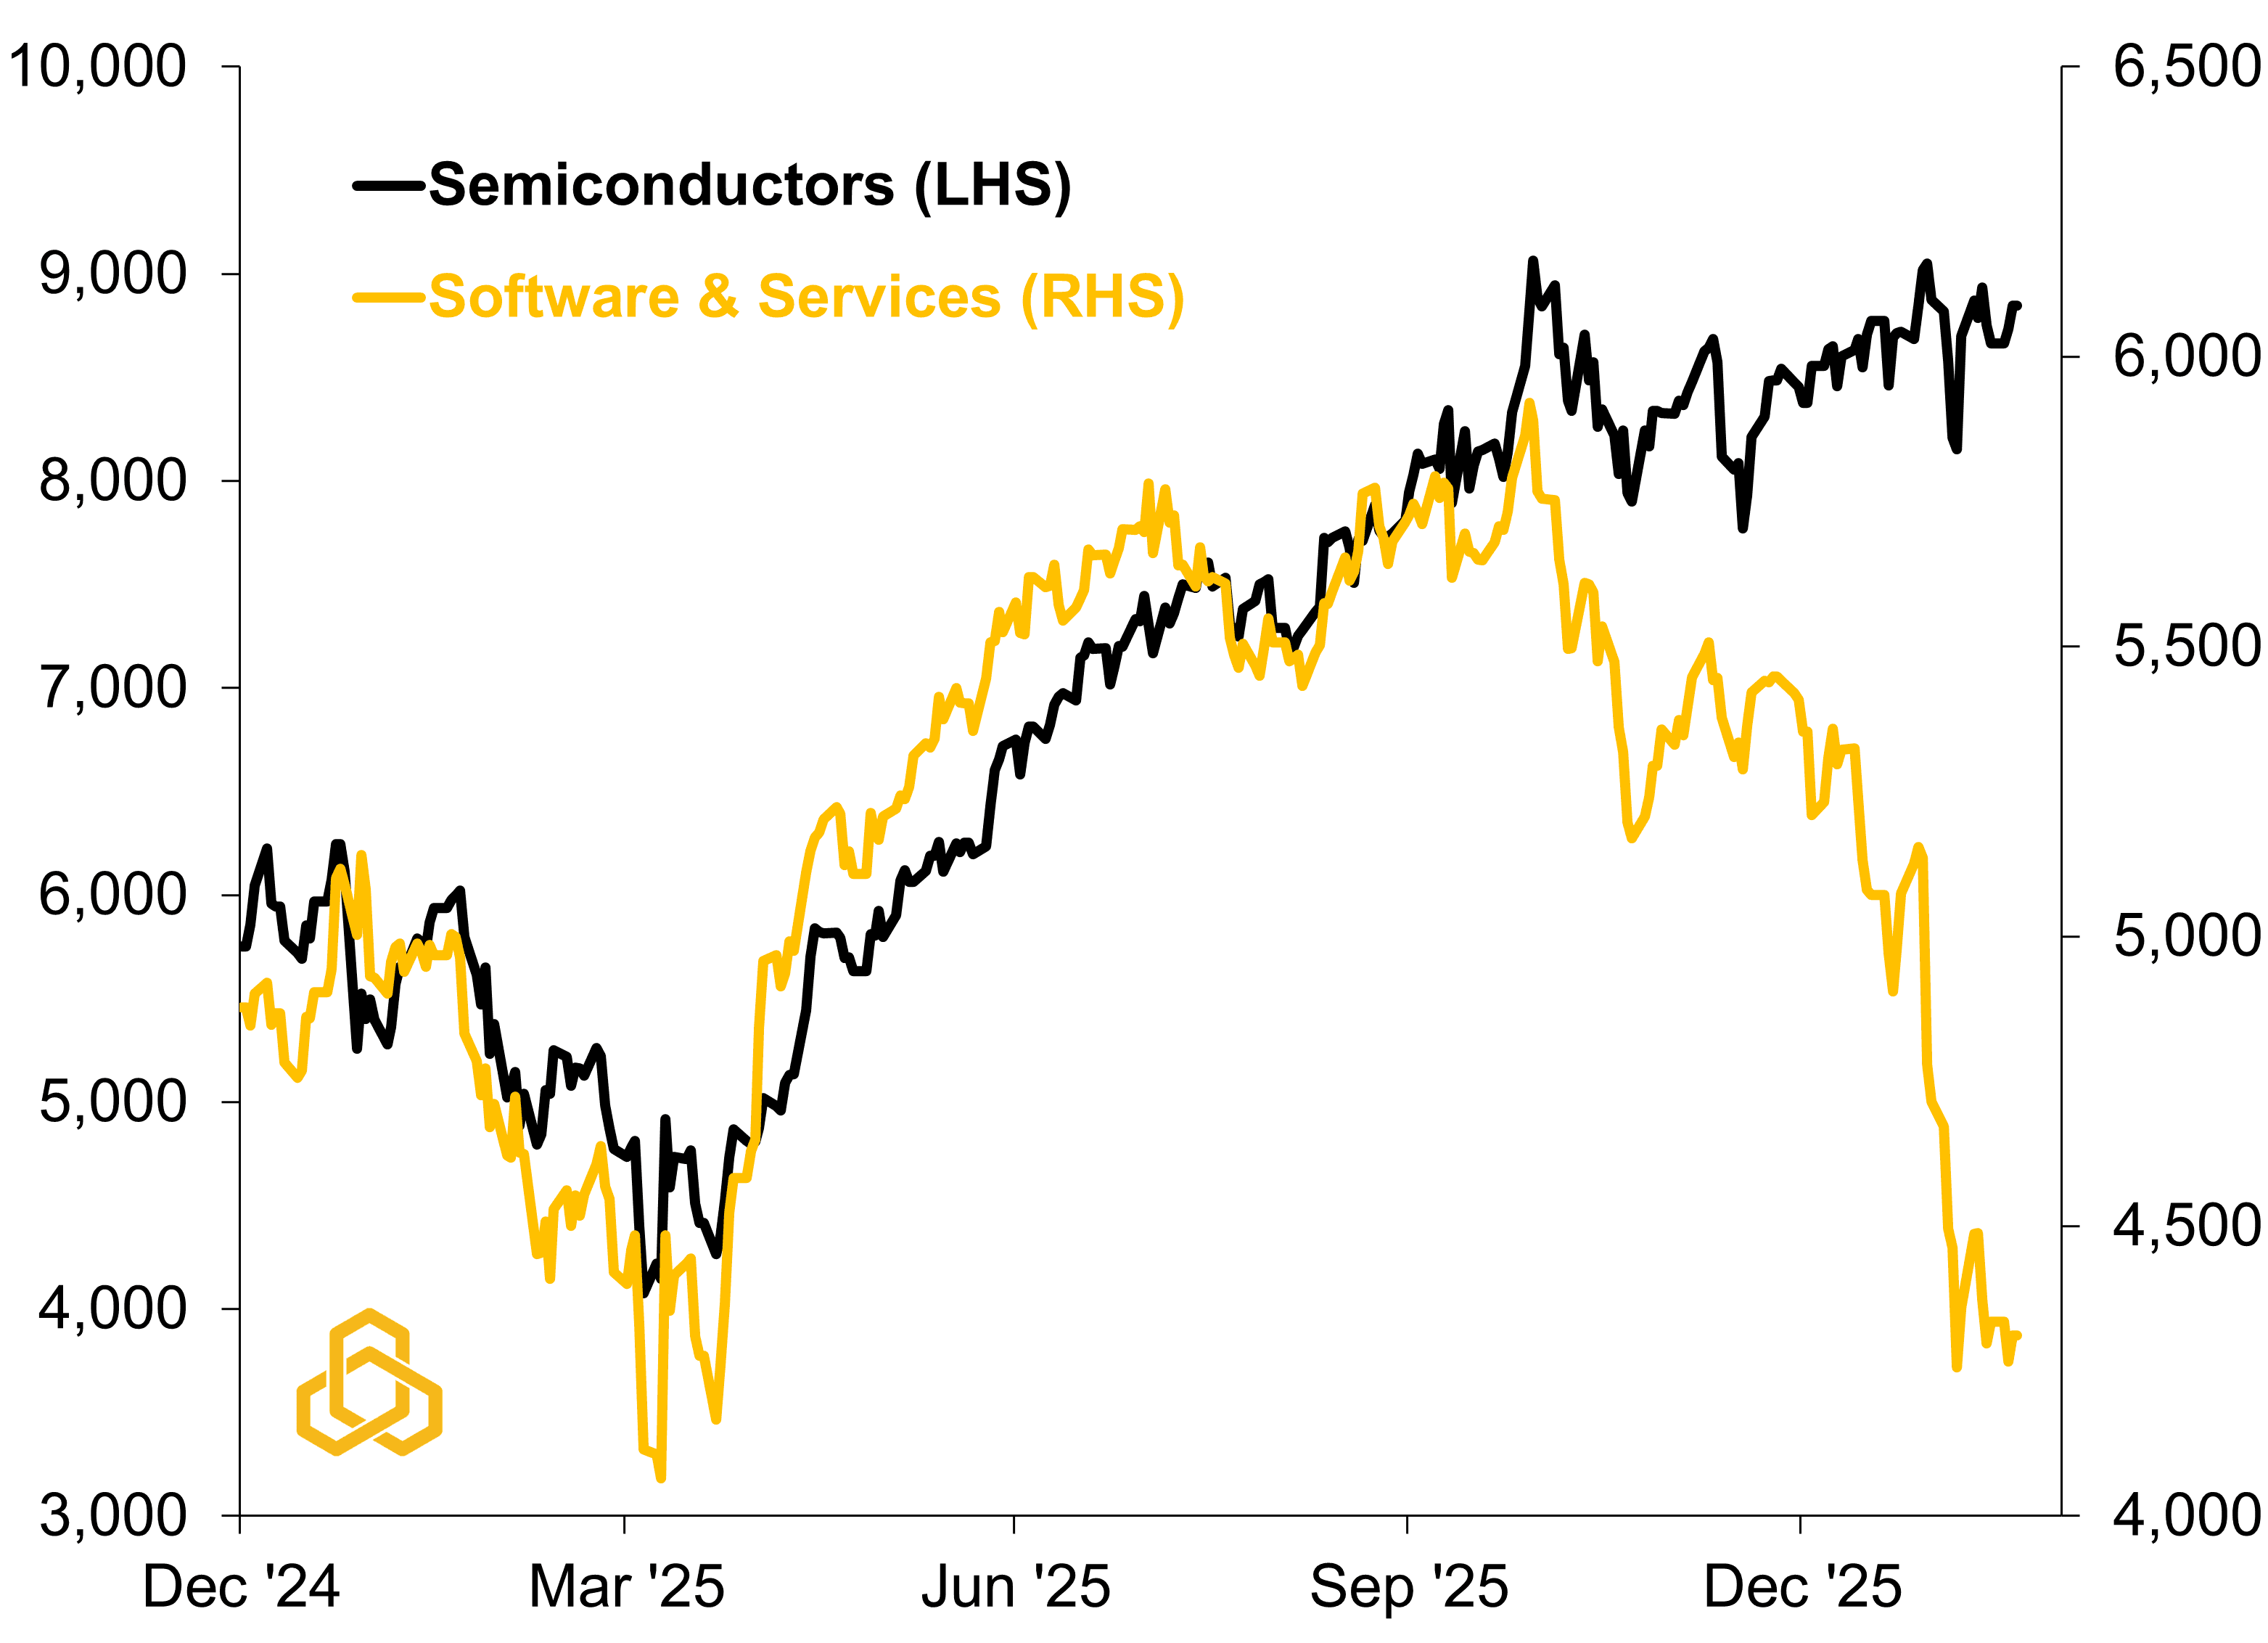
Sources: Standard & Poor’s, Bloomberg L.P., and Potomac. Data as of February 17, 2026. Past performance is no guarantee of future results. It is not possible to invest directly in an index.
History Never Repeats Itself…
However, there are some differences. One glaring distinction between the “dot-com” cycle and this “AI” cycle is the impact on the labor market. While the U.S. unemployment rate back in 1999 was quite similar to today’s (4.2% versus 4.1%), the booming tech sector then added to the labor market as companies built the new digital infrastructure. Today, it is subtracting.
After hiring droves of talent during the pandemic, tech giants are now in a period of “efficiency normalization.” Beyond simply trimming excess, the rise of agentic AI is fundamentally altering workforce dynamics with companies increasingly choosing not to backfill roles when talent departs.
Our measure of technology employment quantifies this shift: between the Netscape IPO in August 1995 and the labor market peak in early 2001, the industry added roughly 1.5 million technology-related roles. Conversely, the sector has shed approximately 160,000 jobs since the release of ChatGPT in late 2022 (see Figure 3).
Figure 3. Total U.S. Technology-Related Employment (Thousands)
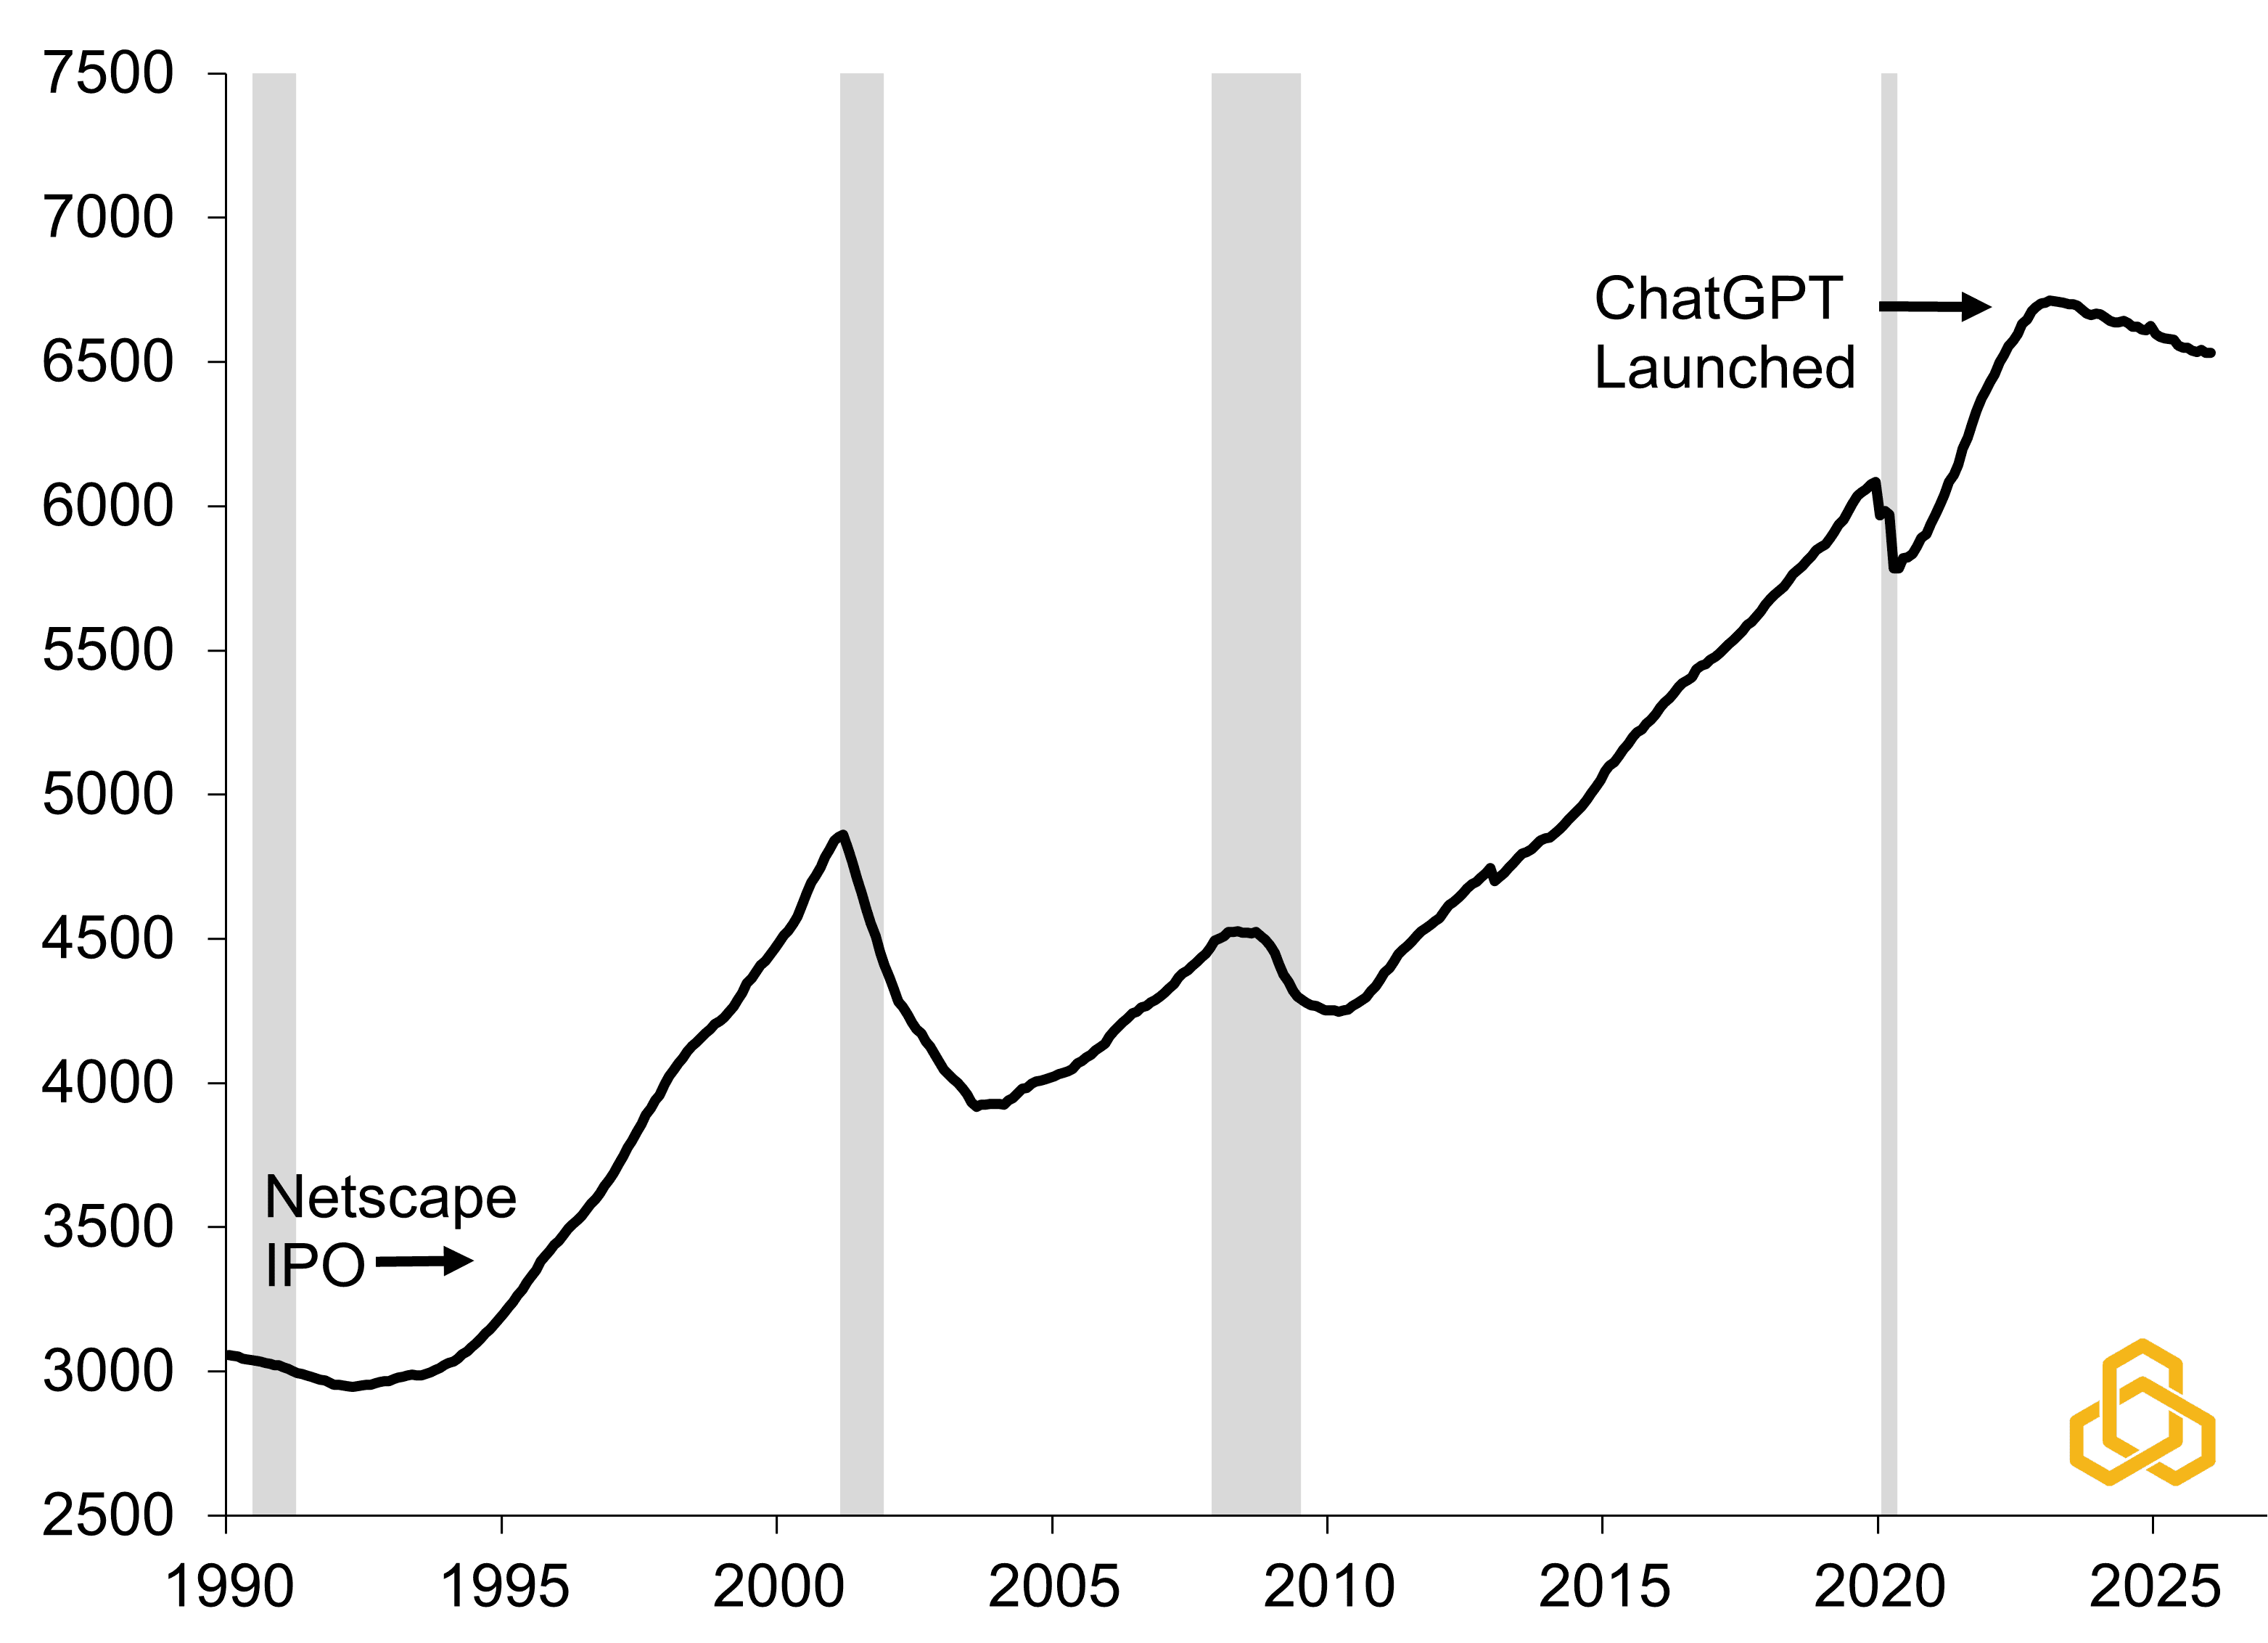
Sources: Bureau of Economic Analysis, National Bureau of Economic Research, Bloomberg L.P., and Potomac. Data as of January 2026. Note: Shaded regions denote periods of U.S. recession. Note: This series is a summation of employment levels in Computer and Electronic Product Manufacturing, Web Search Portals, Libraries, Archives, and Other Information Services, Computing Infrastructure Providers, Data Processing, Web Hosting, and Related Services, Management, Scientific, and Technical Consulting Services and Computer Systems Design, and Related Services.
On a monthly basis, the dot-com boom contributed an average of 22,000 new tech jobs to the economy. In stark contrast, the AI era is currently subtracting roughly 4,000 jobs per month. While it is difficult to isolate the precise percentage directly caused by AI, the impact would likely be even deeper when factoring in the rapid automation of customer support, legal discovery, and back-office services.
…But It Does Often Rhyme
History may not be repeated, but it does teach us important lessons. In the case of the dot-com era, it taught us that high valuations in certain risk assets can lead to prolonged drawdowns and sustained rotations as investors shift towards less richly priced assets. We believe there are tentative signs of this occurring now with small-caps starting to outperform large-caps as economic data have strengthened of late, additional rate cuts seem likely, and valuations in the space are more reasonable (see figure 4).
Figure 4. Small-Cap Outperformance vs. Citi’s Economic Surprise Index
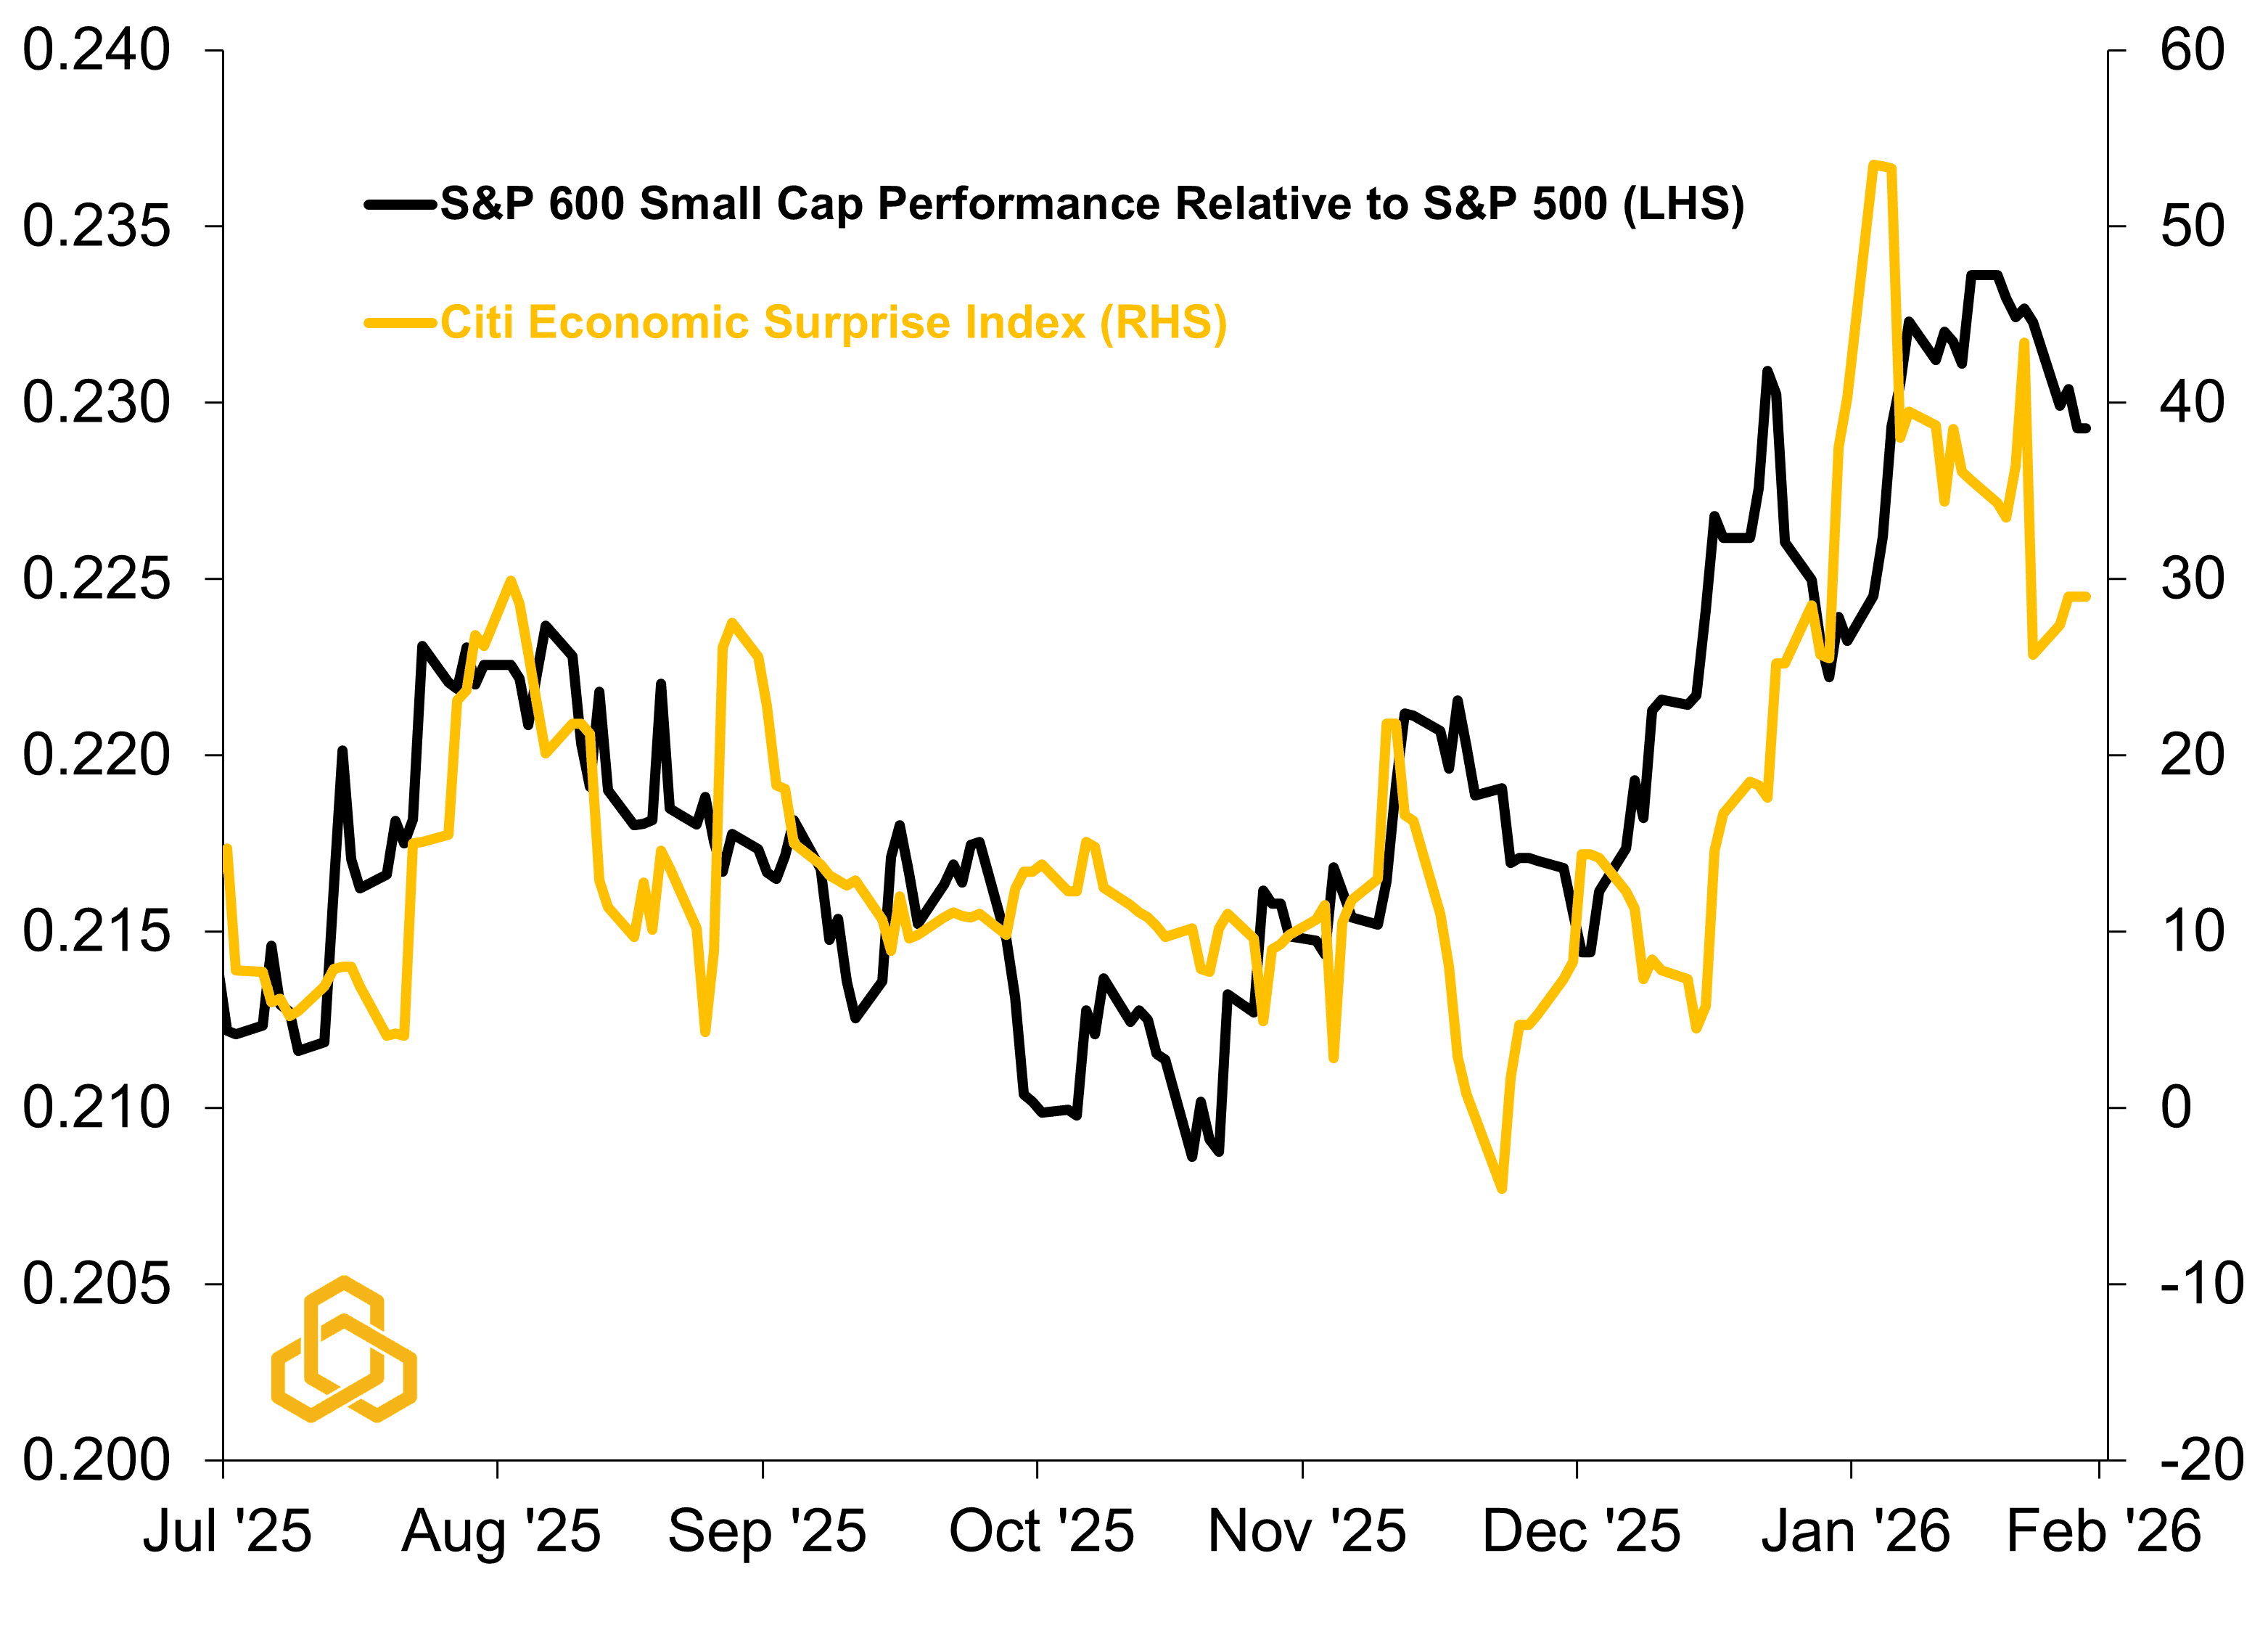
Sources: Standard & Poor’s, Citigroup Global Markets, Bloomberg L.P., and Potomac. Data as of February 17, 2026. Past performance is no guarantee of future results. It is not possible to invest directly in an index. Note: A Citi Economic Surprise Index reading of above zero means that economic data releases are beating consensus estimates while below zero implies the data are coming in below consensus.
This Time May Be Different
Many investors are quick to point out how this time is different due to strong earnings growth, solid balance sheets, and healthy free cash flow, and we agree with that assessment. This time does appear to be different, and the earnings outlook suggests that the “death of tech” over the short-term is unlikely. However, a historical comparison of valuations during the “dot-com” cycle and the “AI” cycle indicates that we may be edging ever closer to a more sustained turning point. If that happens, investors may once again begin to appreciate the small things and the comfort of the “old economy” (see figure 5).
Figure 5. The Dot-Com Cycle and AI Cycle Returns and Valuations
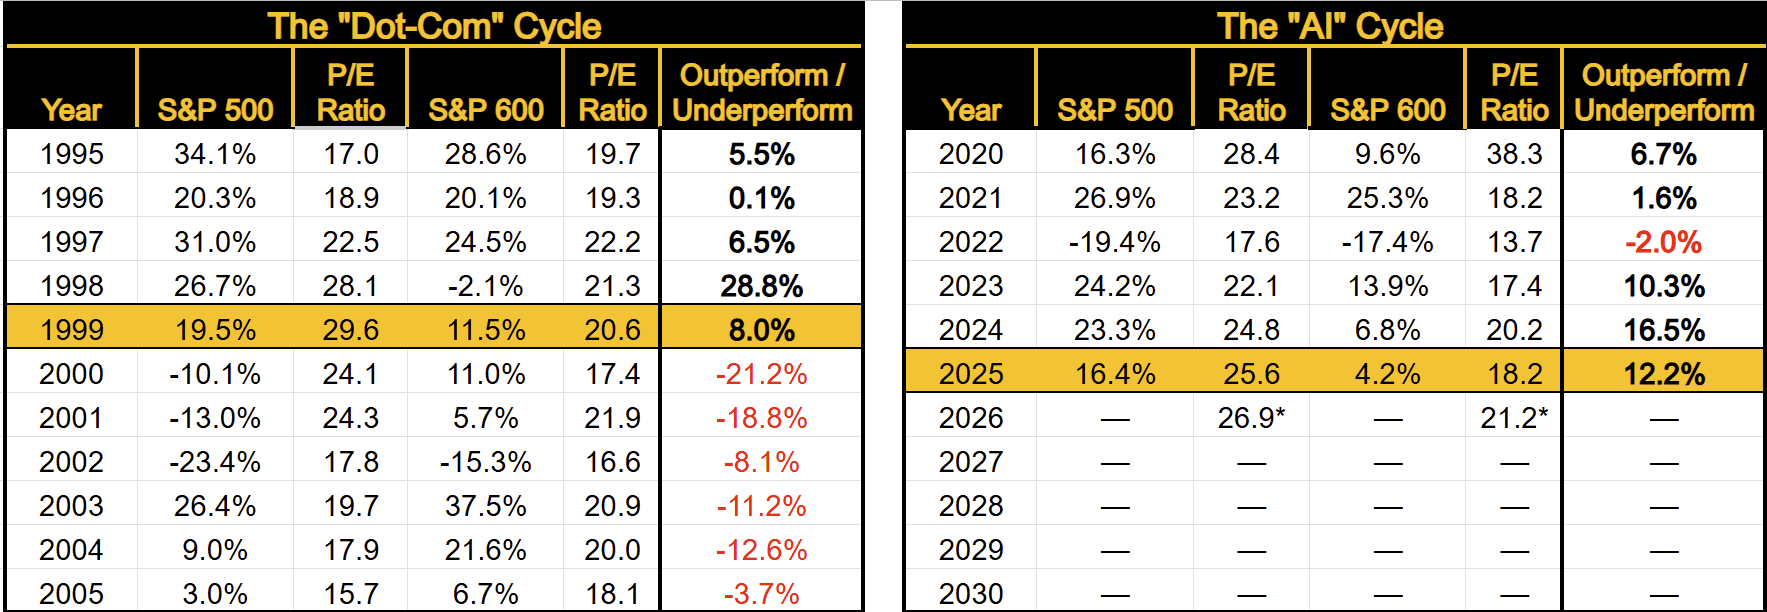
Sources: Standard & Poor’s, Bloomberg L.P., and Potomac. Data as of February 17, 2026. Past performance is no guarantee of future results. It is not possible to invest directly in an index. Note 1: P/E Ratio is the Forward P/E using Bloomberg earnings estimate for the next 12 months. Note 2: Outperform / Underperform marks when the S&P 500 outperforms the S&P 600 (in bold and black) versus underperforms (red). Note 3: 2026 P/E ratios are as of February 18, 2026.
PFM-312-20260225