
Everyone loves averages. In school, a professor might announce that the average test score was 80. At a restaurant, the average wait time might be a reasonable 15 minutes. Or maybe a city boasts an average temperature of 65 degrees.
In all the above cases, the average can be deeply misleading.
In the classroom, some students failed while others aced the test. That 15-minute wait at the restaurant might hide the reality that most days have no wait—while on weekends, it’s an hour or more. And that “perfect” 65-degree average temperate? It could result from 30-degree winters and 100-degree summers.
The point is this: averages mean nothing without context. And in the financial world, context is everything.
The Market’s “Average” Rarely Happens
Many cite the stock market’s long-term average returns of 8%, 9%, or even 10%, as if investors should expect those returns every year.
At best, investors are pleasantly surprised when returns exceed the average. At worst? They’re disappointed when returns fall significantly below expectations, and they sell.
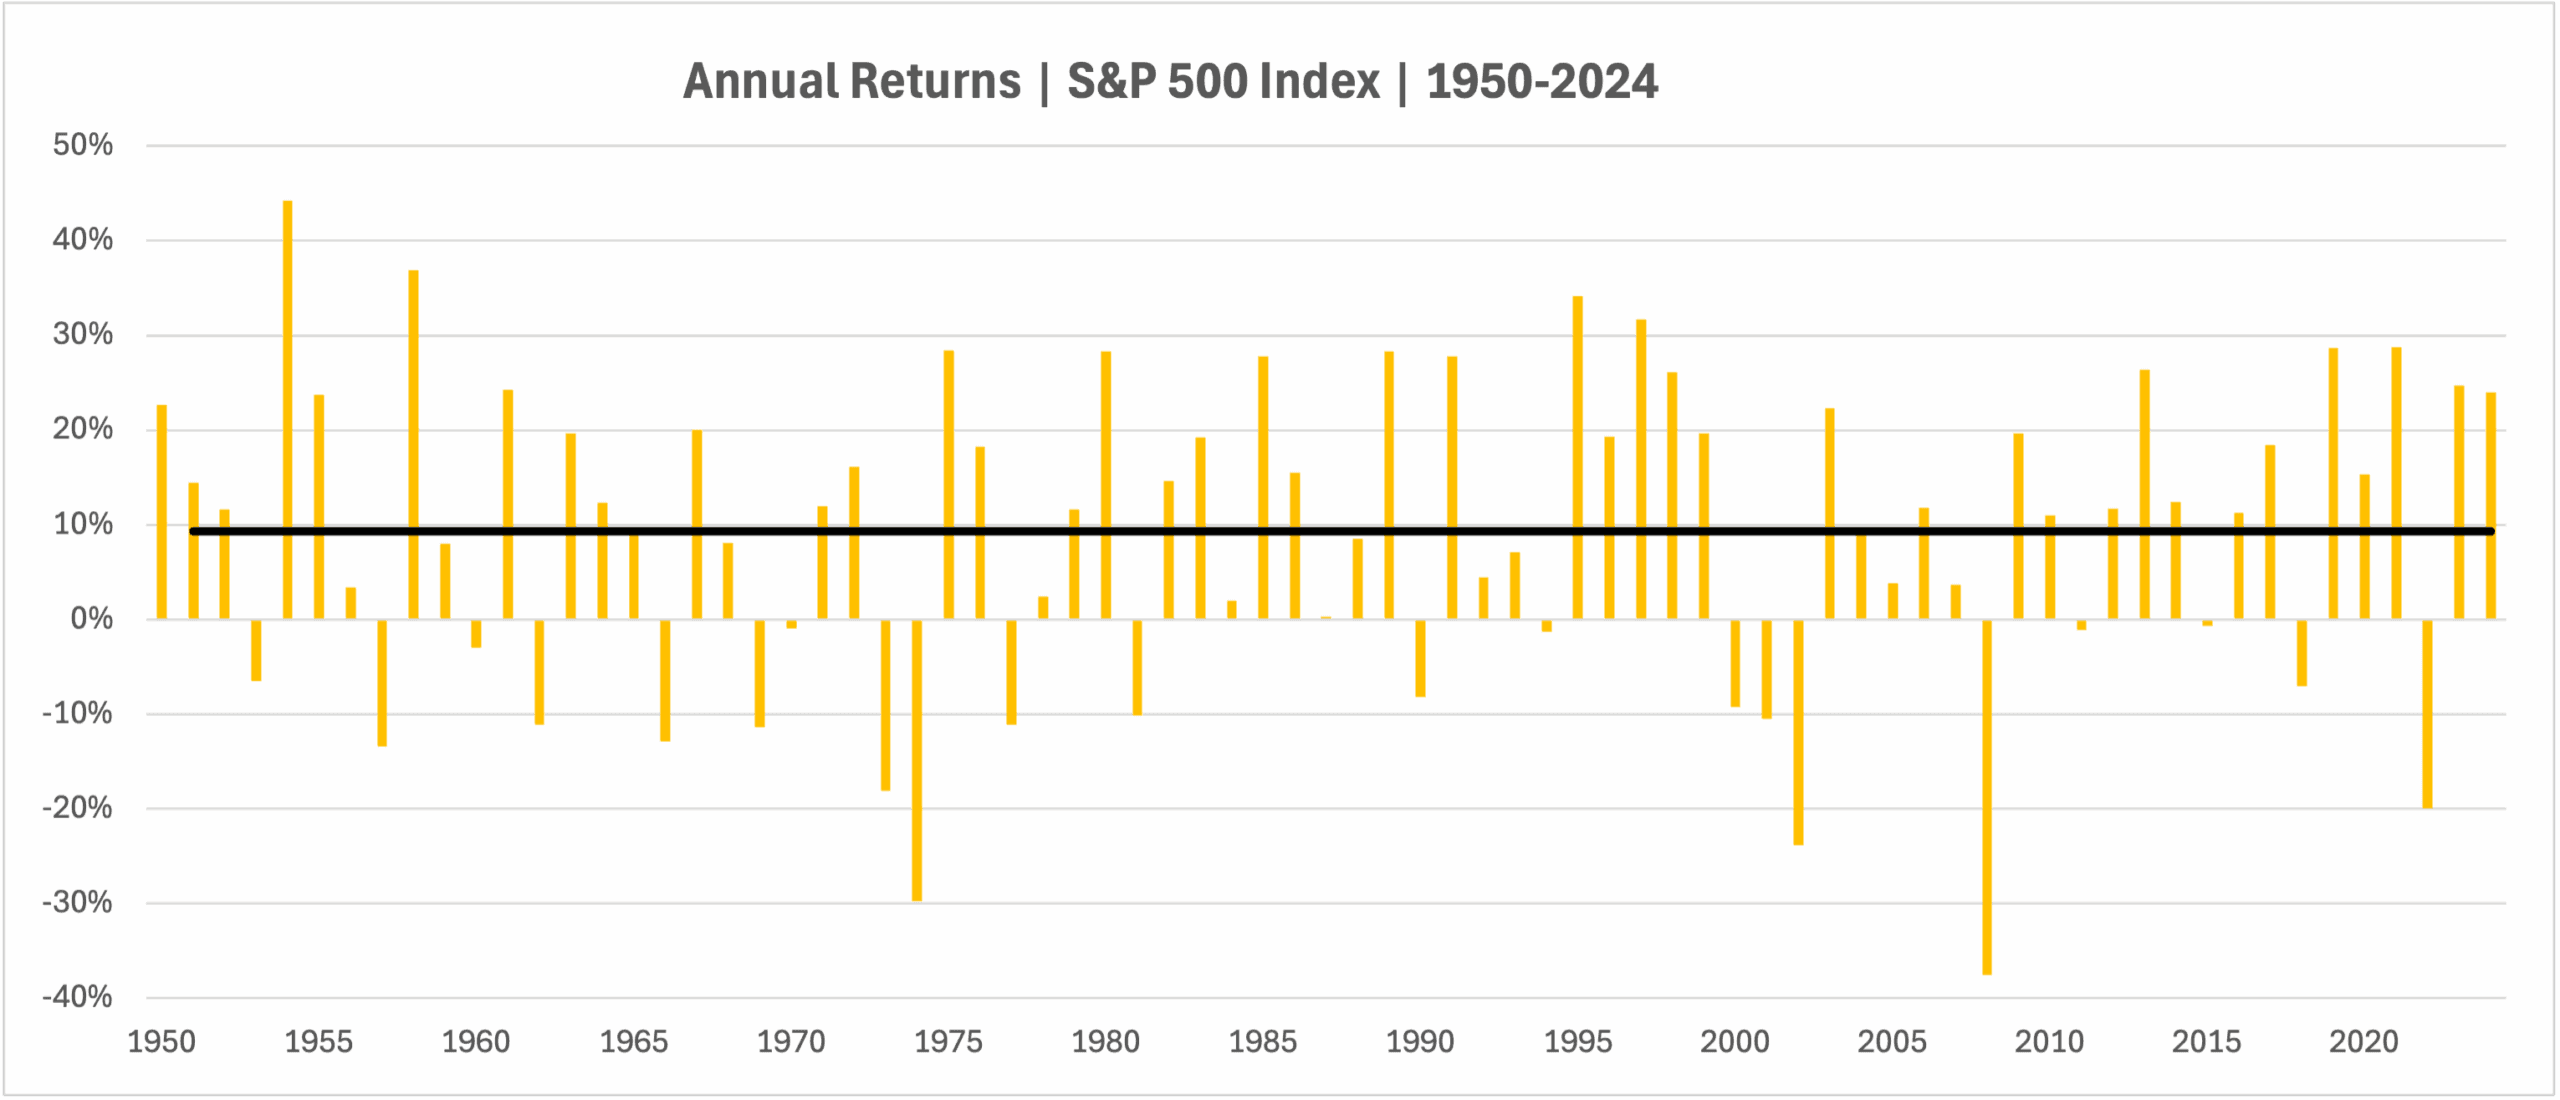
For example, from 1950 through 2024, the average annual return for the S&P 500 Price Index (S&P) was 9.31%. (S&P price return was used rather than total return in attempt to use the largest dataset).
That’s a great headline number – but is a misleading one if proper context is lacking.
The chart below shows yearly returns of the S&P with the black horizontal line being the average annual return of 9.31%.
Source: Norgate.com | Calculations done in excel
Notice how in most years, the annual returns vary drastically from the average, both above and below.
In fact, 42.67% of the years experienced returns that were more than 10% away from the average. This means that more than four in ten years had returns that were either negative or greater than 19%.
So, while 9.31% was the average, years with returns close to that figure are the exception, not the rule.
The market’s “average” rarely happens.
Simple Averages are Misleading
Going further, the most critical missing piece of average returns is centered around the term volatility drag.
Ed Easterling of Crestmont Research coined the term “volatility gremlins” to describe this phenomenon. These gremlins are volatility itself, which reduces the actual return that investors realize.
To illustrate, consider two hypothetical investments, A and B, both with an average annual return of 10%. However, Investment B is about twice as volatile as investment A.
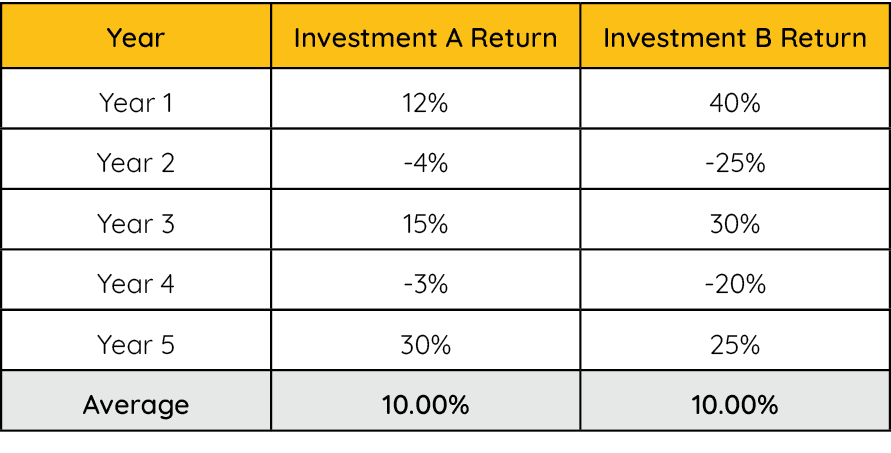
Would investors in both end with the same returns?
Although each has an average 10% return, their compound returns differ because of the volatility drag affecting investment B. The compound return is what really matters, not the average annual return.
This is because the investment account doesn’t reset each year. Typically, gains or losses remain in the account. For example, year two starts with the balance left after year one. This is compounding.
As shown below, by year five, investors in investment A are significantly better off than those in investment B because of compounding.
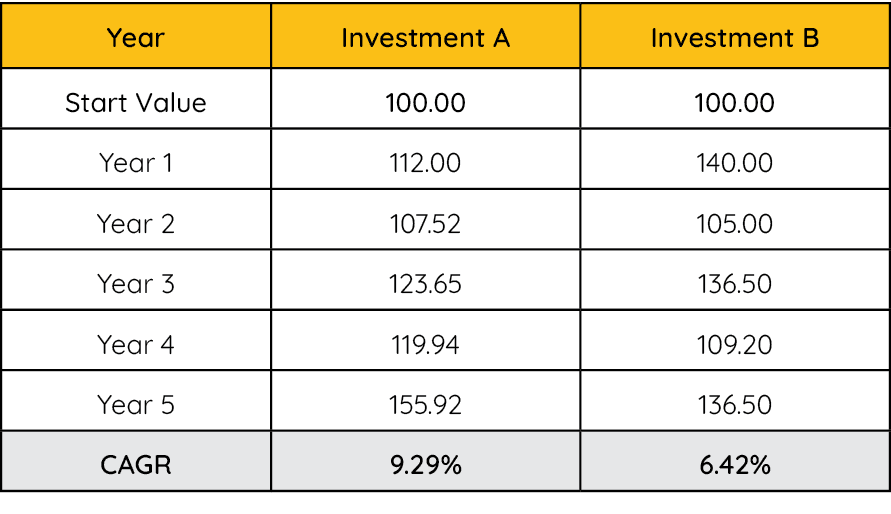
Because of lower volatility, investment A had a compound annual growth rate (CAGR) of 9.29% compared with just 6.42% for investment B.
Below are the same two investments shown visually with a line chart.
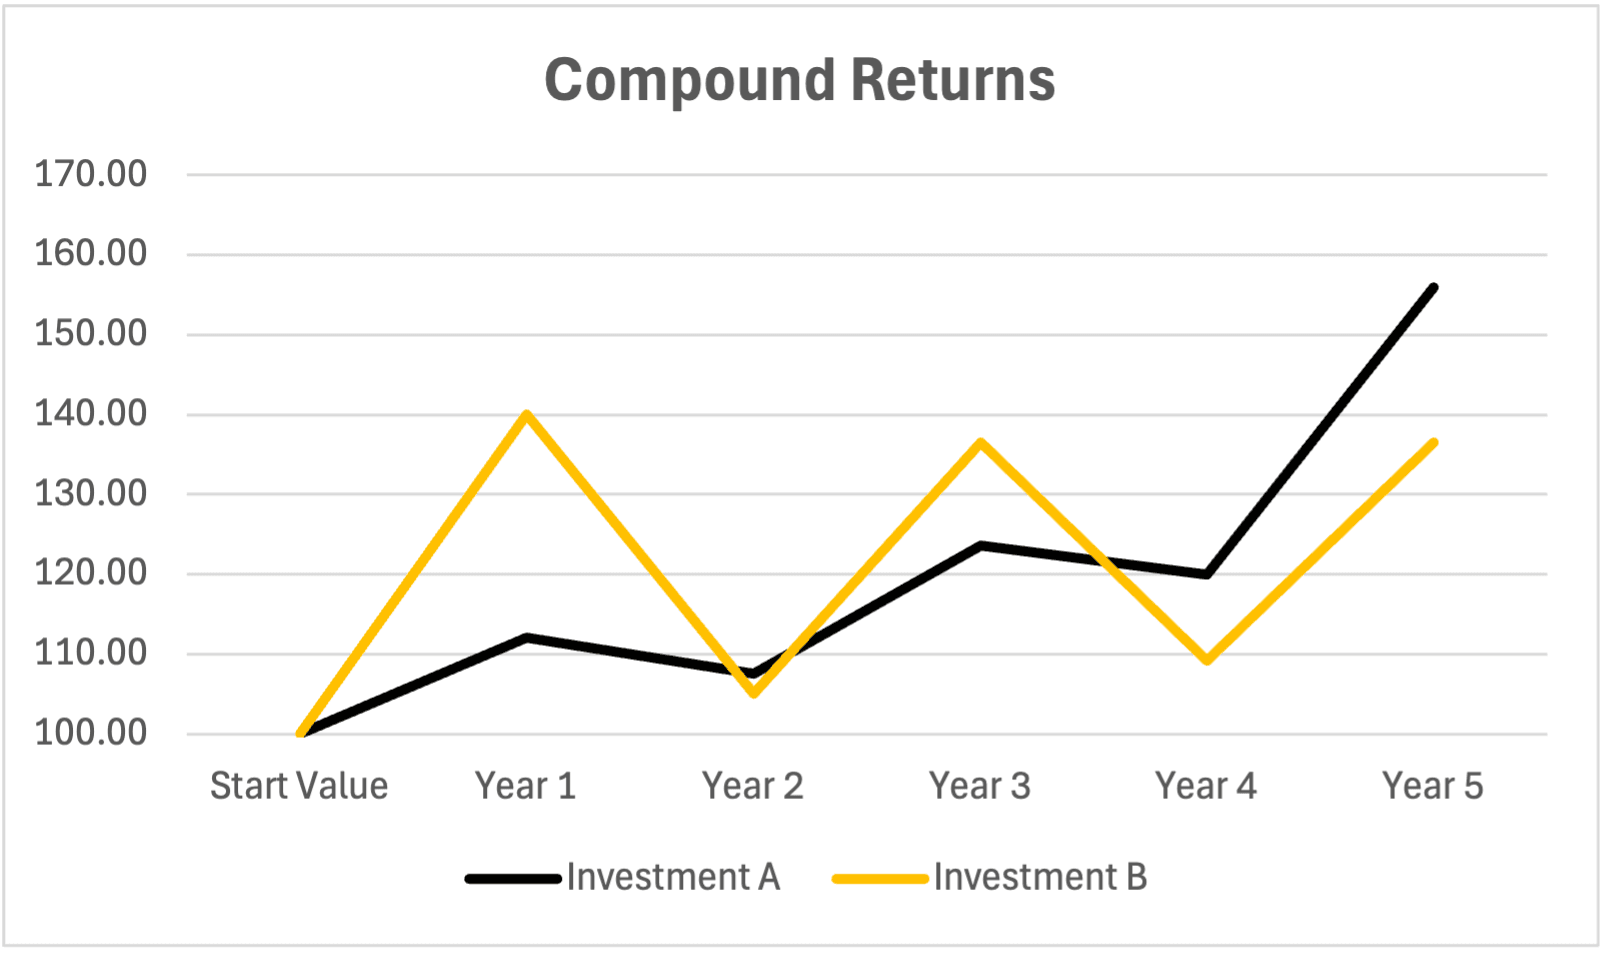
Despite investment B jumping ahead with a huge lead in Year 1, the result for the full period was worse due to the volatility. Investment A outperformed investment B by 19.42% (total return).
The Takeaway
When investing in financial markets, understanding the context around average returns is critical. Year to year returns typically vary dramatically around the average, making returns close to the average more of an outlier than the norm.
The second, and more critical issue is the impact of volatility on real returns. Many investors don’t understand the difference between average and compound returns. It’s the compound returns that matter, and for those, volatility gremlins diminish it.
As our example shows, two investments with identical average returns can finish with nearly 20% different total returns after just five years.
This is why active managers emphasize risk management. Large losses and drawdowns are the gremlins that erode total returns. Managing these risks requires a tactical, adaptive approach with a focus on controlling drawdowns, all with the goal of achieving long-term compound returns that investors can stick with.
To read more about Potomac’s solution to these compounding issues, you can explore our approach here.


