
Buffered ETFs: Expensive Underperformance
Woody Wiegmann and Shawn Snyder
The Pitch
Hey, do I have the product for you.
It caps your upside in strong markets and still leaves you exposed to meaningful downside in weak ones.
Pass? Yeah, same.
And yet, Wall Street has been selling this exact idea for years. Welcome to the world of defined-outcome, or “buffered,” ETFs.
These products have pulled in roughly $80¹ billion to date. That alone tells you the story resonates. The problem is that reality rarely matches the pitch.
How the Sausage Gets Made
Buffered ETFs do not actually own the underlying index. Instead, they use a package of options to engineer a specific return profile over a set period.
The pitch sounds clean: stay invested in equities, but limit downside.
The tradeoff is less appealing.
Most buffered ETFs cap upside somewhere in the 10% to 16% range over a given outcome period. So, if the S&P 500 returns 25%, you keep the first 10% to 16% and give the rest away. Dividends are typically sacrificed along the way as well.
On the downside, the protection only goes so far. A typical buffer might absorb the first 10% of losses. After that, you are fully exposed again. A 30% market drawdown with a 10% buffer still leaves you down 20%.
So, what you really have is partial protection in mild selloffs, paired with capped participation in strong rallies.
That is not a free lunch. It is a tradeoff.
The Cost of Protection
The tradeoff becomes clearer when you think about how markets actually work.
Most returns cluster in the middle, but the tails matter, and they are fatter than a normal distribution would have you believe. The tails are where real wealth is created or destroyed.
Buffered ETFs soften some of the middle. They absorb part of moderate declines and allow for modest gains. But they leave the left tail exposed and cap the right tail.
In other words, they dull the middle while cutting off the right tail of the distribution.
Figure 1. Sample Defined Outcome ETF Return Distribution Curve
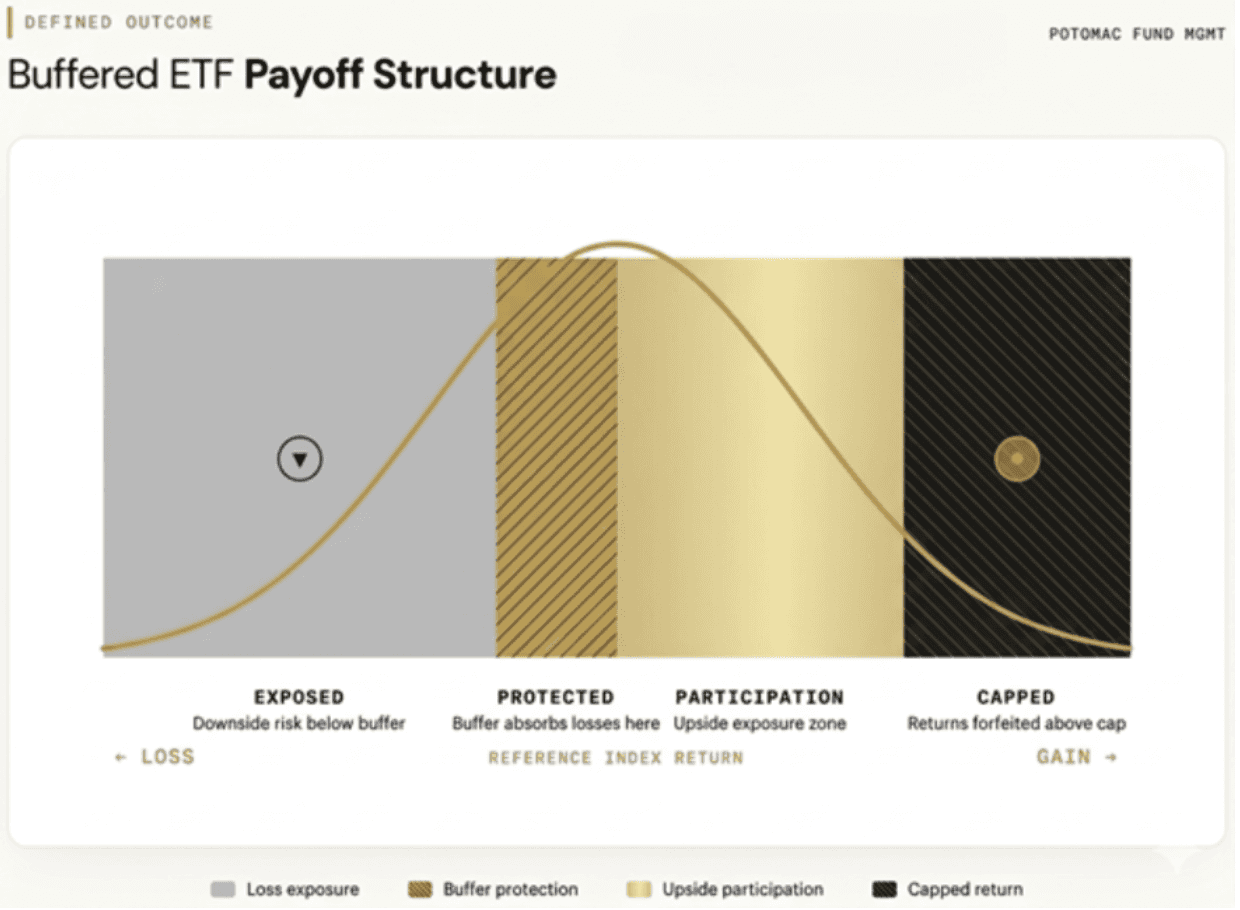
Source: Alpha Architect (Ordonez, 2025) and Potomac
A Simple Test: Complexity vs Simplicity
Let’s look at what this means in practice.
The FT Vest Laddered Buffered ETF (BUFR), the largest buffered ETF, has about $8.7 billion in assets. Since inception, it has delivered materially less upside participation than the S&P 500, along with significantly lower dividend income.
On top of that, investors are paying for the structure. Between options costs and management fees, roughly 0.7% to 1.0% annually, well above a standard index ETF.
So, the question is: does the structure add value in some other way?
One way to test that is to compare BUFR to a basic portfolio that reduces risk by holding a blend of equities and cash.
Using an approach conceived by AQR, we can roughly match BUFR’s market exposure.
Based on data from Bloomberg, BUFR has a 0.57 beta to the S&P 500 over the past two years.
Figure 2. Daily Percent Change of BUFR ETF vs. S&P 500 (%)
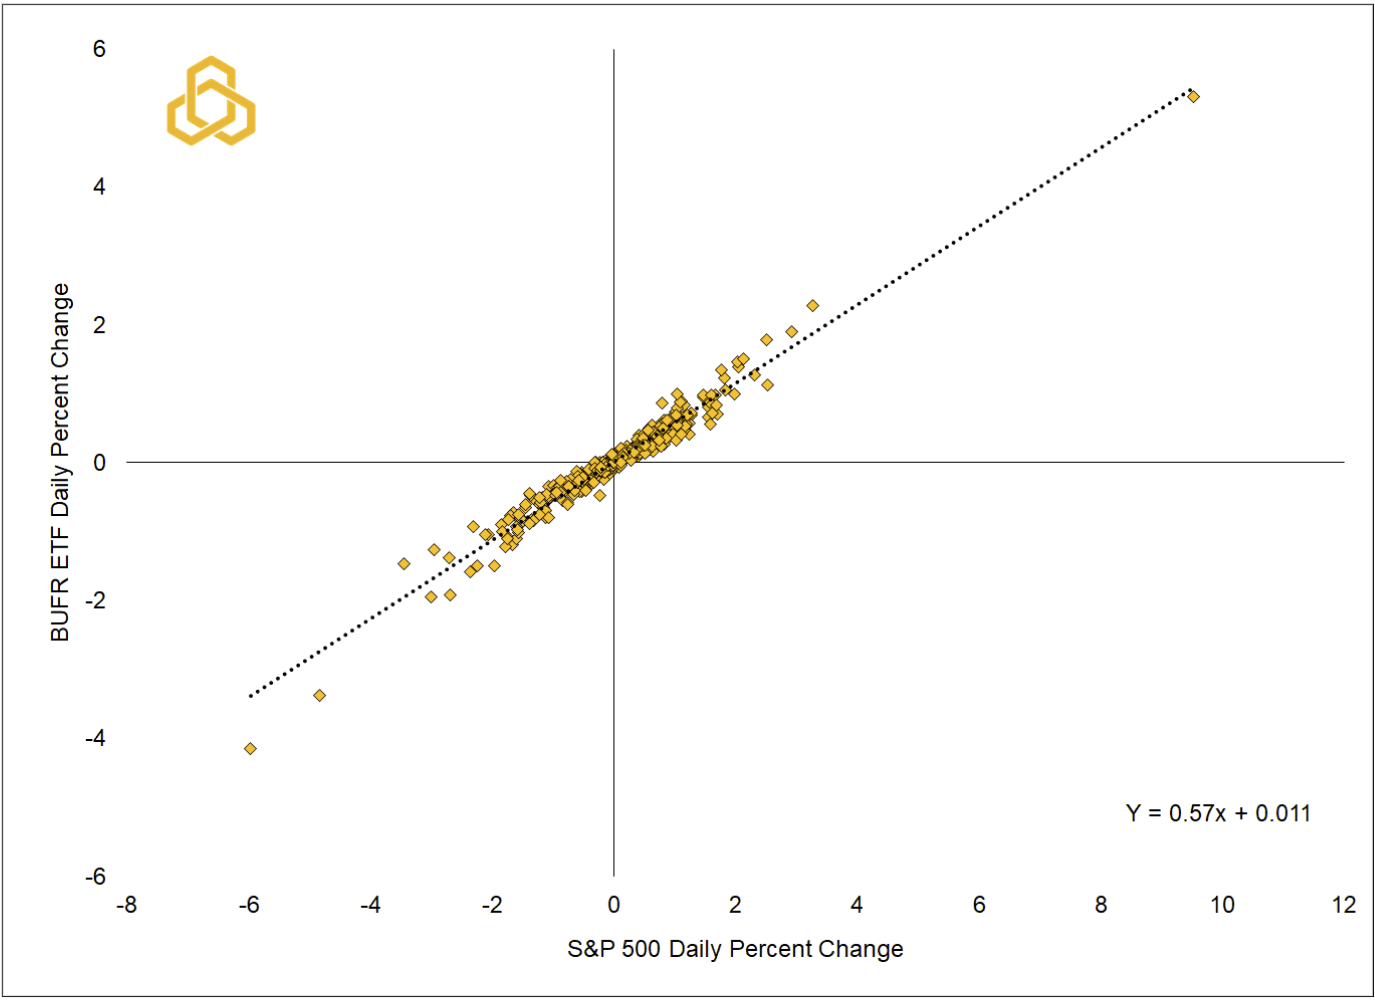
Source: Bloomberg, L.P. and Potomac. Note: Daily data from April 2, 2024 to April 2, 2026. Past performance does not guarantee future results. One cannot invest directly in an index.
That translates into a portfolio of ~60% equities (in this case we use the S&P 500 Index ETF, SPY) and 40% cash (iShares 0-3 Month Treasury Bond ETF, SGOV).
No options. No engineering. Just a straightforward allocation.
Figure 3. Comparative Risk / Return Metrics of BUFR vs. Sample 60/40 Portfolio
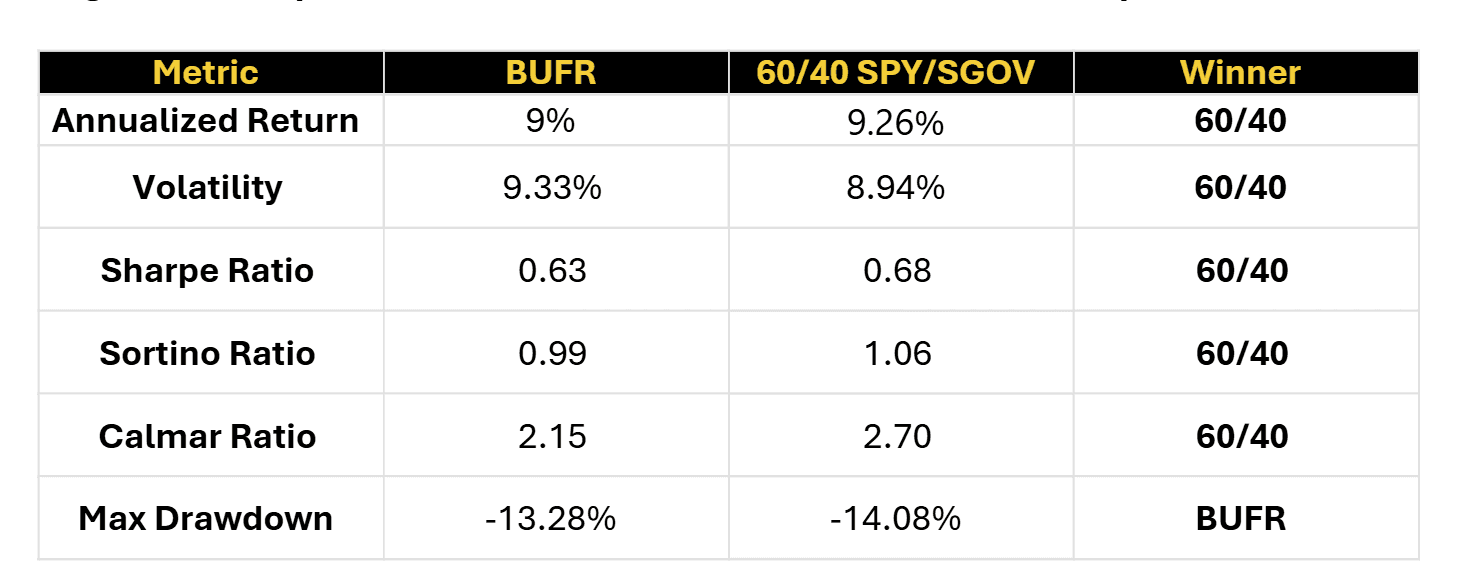
Source: AQR, Potomac, Portfolio Visualizer. Note: Analysis period: 2021-0-01 to 2026-03-31. 60/40 Rebalanced Annually. BUFR beta computed from daily returns via OLS. Replica = 60% SPY + 40% SGOV daily returns. Source: FastTrack daily close prices. Past performance does not guarantee future results.
Here are the key takeaways:
Higher returns from the simple portfolio
Lower volatility
Better risk-adjusted outcomes across the board
Slightly worse drawdown, but not meaningfully different
The added complexity does not improve the outcome.
The Evidence Is Pretty Clear
AQR looked across the entire universe of buffered products in Morningstar’s database with at least two years of history, and the results were not subtle.
Most buffered ETFs underperform their underlying index on a risk-adjusted basis. For funds with longer track records, the underperformance becomes overwhelming with about 90% underperforming their reference asset (typically the S&P 500).²
And the “buffer” itself is far less reliable than advertised.
In real-world usage, these funds still lose money the vast majority of the time when markets are down, even within the supposed protection range. According to AQR, when the market drops into the buffer zone, funds still lose money 94% of the time.
Why?
Because the advertised payoff only works if you buy on the exact reset date and hold through the entire outcome period. That is not how most investors actually use these products.
In practice, many investors are buying into a payoff structure that already moved.
The Takeaway
Buffered ETFs are marketed as a middle ground between risk and return.
What they actually offer is a very specific trade: give up a meaningful portion of the upside in exchange for partial protection in moderate declines.
For long-term investors, the juice may not be worth the squeeze.
The strongest market periods do most of the heavy lifting in compounding returns. Buffered ETFs are designed to miss part of those periods by construction.
At Potomac, we take a different approach.
We do not cap upside, and we do not rely on engineered payoff structures to create the appearance of safety. When risk rises, we reduce exposure directly. When it falls, we re-engage.
Simple, transparent, and, in our view, more effective.
Frustrated With Your Bond Hedge? How About a Buffer ETF? - Bloomberg
Asness, C., Cao, J., Ilmanen, A., & Villalon, D. (2025). “Rebuffed: An Empirical Review of Buffer Funds.” Journal of Portfolio Management, September 2025.


