Whether it is a virus that shuts down the globe or a single-day decline in stocks of more than 20%, we must expect the unexpected.
In both markets and life, it is remarkable how often the unlikely happens. Usually, these events are described as outliers, which happen far more often than statistics suggest they should.
These scenarios are rare and unimaginable beforehand. For an investment manager, any strategy other than buy and hold aims to minimize the risk associated with these outlier events.
To understand why they occur more often than expected, we must look at the statistical model used to define them.
The Normal Distribution
A normal distribution comes with major assumptions. The most well-known being that 95% of all data falls within two standard deviations of the average. This distribution is often used to model market behavior and predict the likelihood of different outcomes.
However, the assumption that market movements will always follow this pattern can be misleading, leaving the investor open to the risk of the improbable.
Most will recognize the chart below, which shows the bell curve along with one, two, and three standard deviations from the mean.
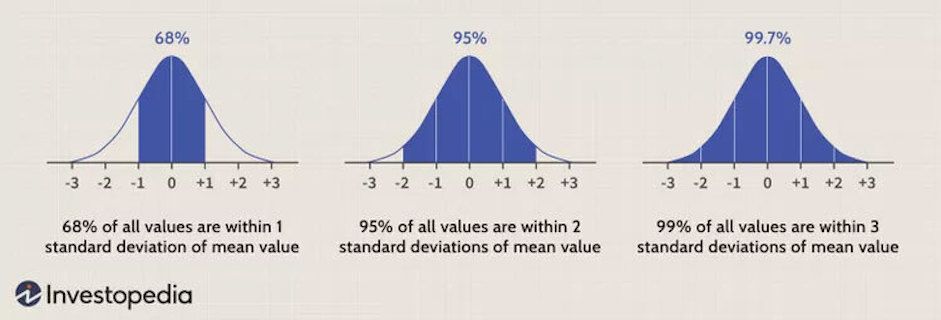
Source: Investopedia.com
The finance industry, and many others, rely on these guidelines as a foundation. As we will see in the following examples, markets often behave in ways that contradict these assumptions.
Three Examples
As the chart below shows, on October 19th, 1987, the Dow Jones Industrial Average declined -22.61%. A 25 standard deviation move.
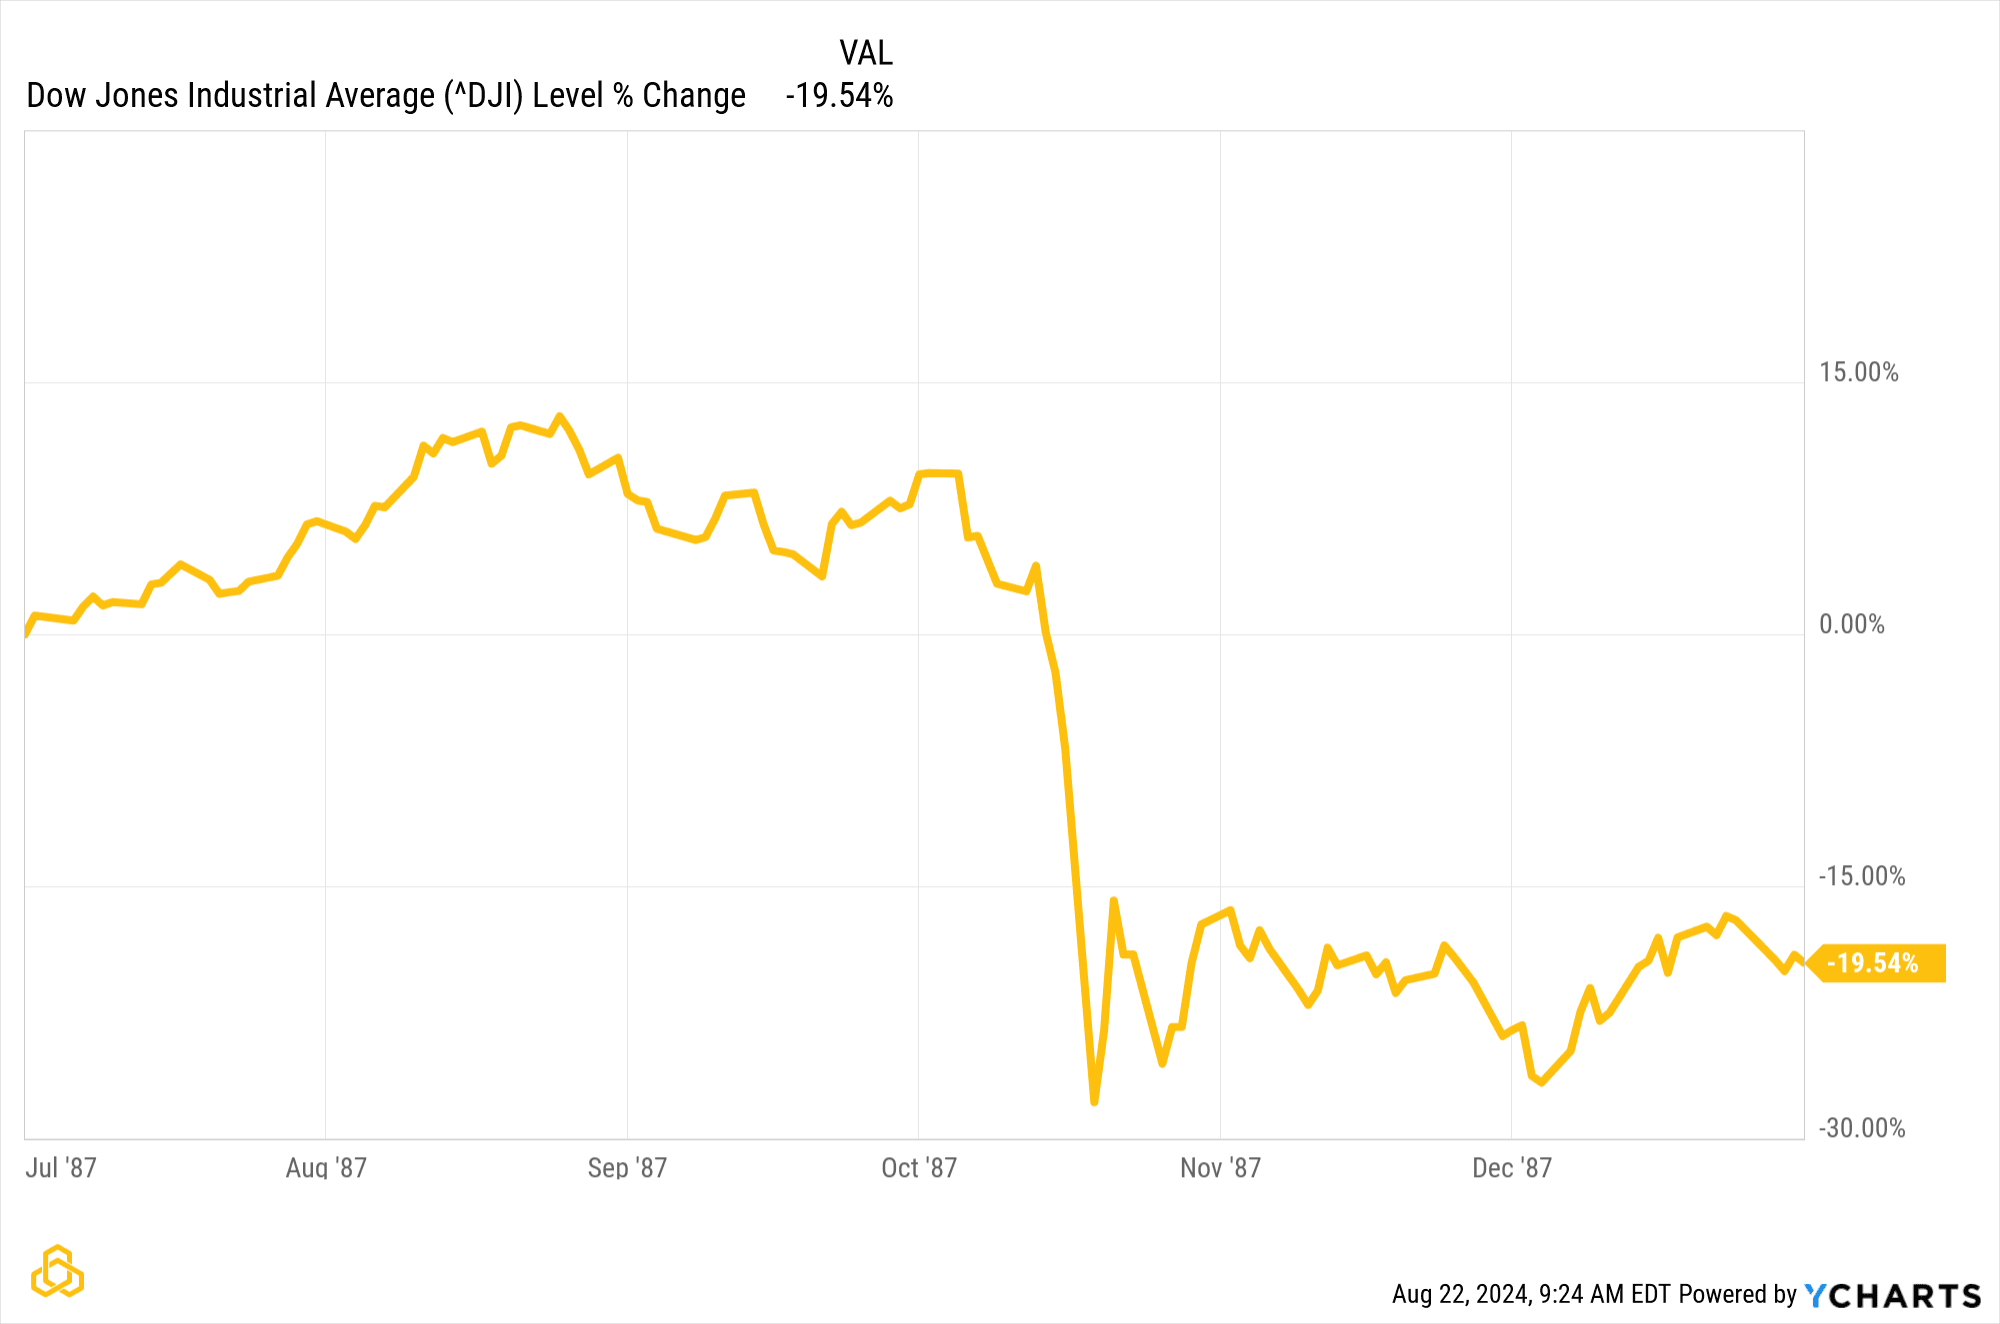
*Chart Data from Ycharts.com
Regarding the decline, Roger Lowenstein of the Wall Street Journal noted, "Economists later figured that, on the basis of the market's historical volatility, had the market been open every day since the creation of the Universe, the odds would still have been against it falling that much in a single day. In fact, had the life of the Universe been repeated one billion times, such a crash would still have been theoretically 'unlikely.'" (Forbes.com)
While this highly improbable single day -22.61% decline may never happen again, more frequent market movements still defy the normal distribution.
Bollinger Bands
A Bollinger band is a simple moving average with standard deviation bands placed on both sides.
As shown by the graphic earlier, two standard deviation bands should contain 95% of all trading days. In other words, only 5% of days should trade outside of them. Yet, using the S&P 500 index from 1950 through present (August 21, 2024), the closing price landed outside the bands 11.27% of the time.
In this example, what should have occurred only 5% of the time happened more than twice as often. This reinforces the idea that this standard model does not accurately describe market movements.
Small-Cap Rotation
The most recent example of an outlier event occurred on July 11, 2024, when a massive rotation from tech stocks into small caps took place. This is yet another example of an extreme market movement that defied expectations.
In just one trading day, the Russell 2000 index outperformed the S&P 500 by 4.51%, as shown by the chart below.
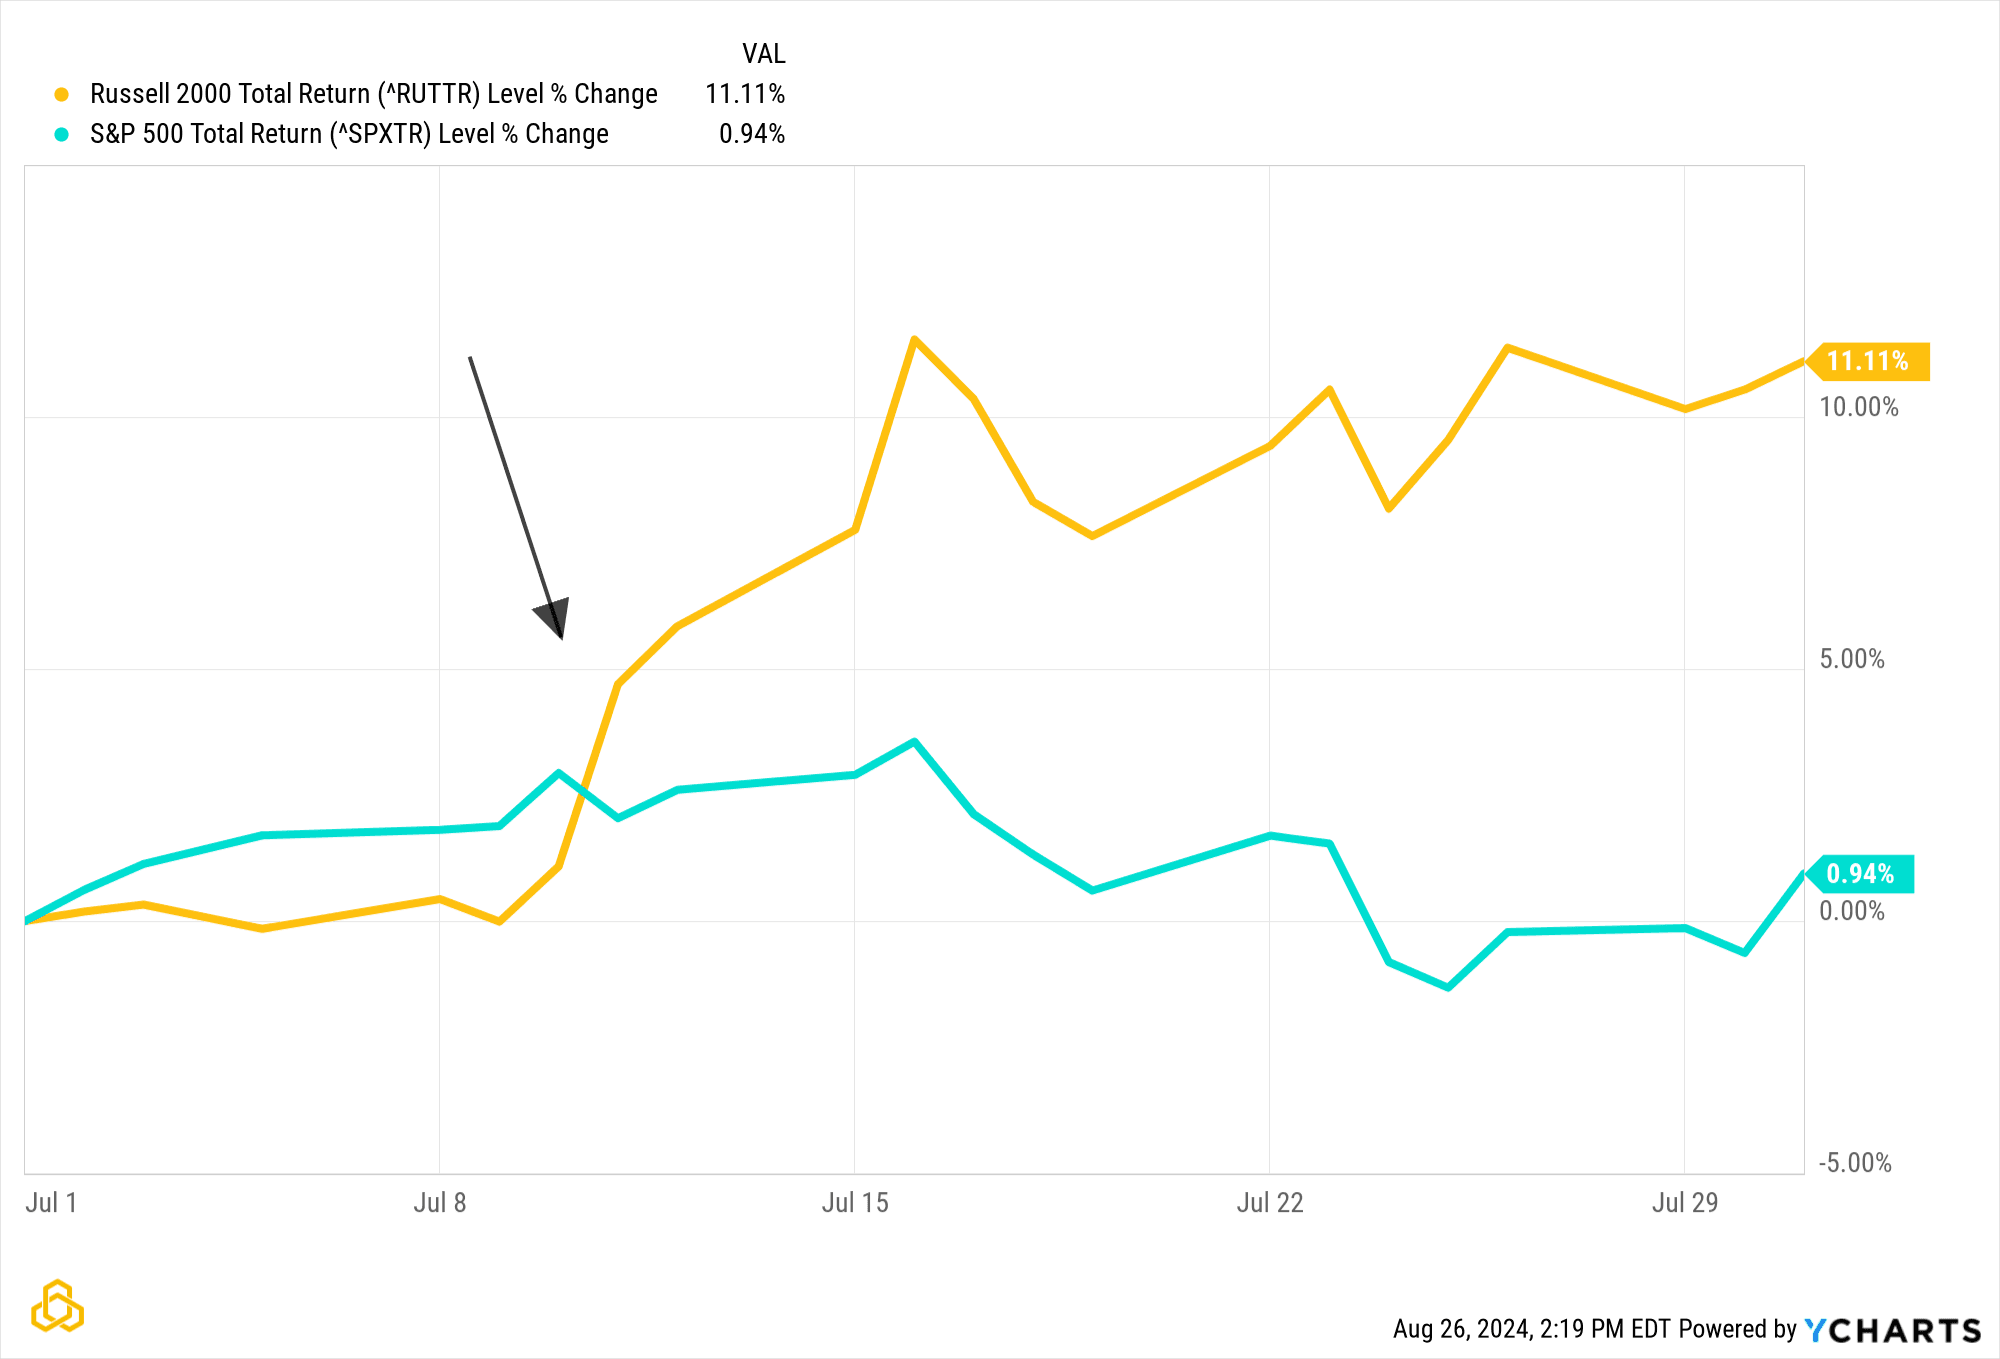
*Data and chart by Ycharts.com
This translates to a 6.5 standard deviation event, or something that should occur less than 0.000000197% of the time.
Events like these three highlight the importance of being prepared for the unexpected, even though a normal distribution considers them nearly impossible.
What is the Point?
The improbable happens far more frequently than standard statistics imply, and as such there is more risk in markets than many are willing to admit, especially for those relying on traditional models to make investment decisions.
In 1987, a once-in-100-billion-lifetime decline shocked the world. Since 1950, the number of days exceeding a two standard deviation band was more than double what a normal distribution suggests, and just recently in July, there was a 6.5 standard deviation move between small caps and the S&P 500.
This shows that the normal distribution, the basis for most risk measures, does not account for the actual risk in the markets. That is why an investment manager focused on the potential for loss chooses to manage it.
Being a tactical manager does not mean being right on every trade. It means focusing on reducing losses when the unexpected happens, losses that can be larger than explained by the normal distribution.