
Keeping it Strait – Five Charts We Are Watching Closely
The U.S.–Israel–Iran conflict continues to dominate the headlines. On some days, it almost feels like artificial intelligence and the Magnificent 7 no longer exist, with the price of “black gold” suddenly becoming the only market that matters.
Given the potential implications for energy, inflation, and global growth, we thought it would be helpful to highlight the five charts we’re watching to assess how this plays out.
We’re also introducing our “Keeping It Strait” Market Monitor. Each week, we’ll track a consistent set of indicators to help separate signal from noise as headlines shift by the hour.
Here are the five charts we are refreshing literally every day:
1) Oil: Watching the Curve, Not Just the Price
This is the obvious starting point. While the broader commodity complex has moved (aluminum, fertilizer, natural gas), oil is the transmission mechanism to the global economy.
We are focused less on the spot price and more on the WTI futures curve. Specifically, whether it begins to flatten. A flattening curve suggests the geopolitical risk premium is fading and that’s what matters most for markets. This week, it went the wrong direction.
We are watching for:
A 10% decline from the March 9 spike ($98.71) → early signs of easing
A 20% decline → risk premium largely priced out
Right now, the curve suggests:
Some easing by mid-summer (July/August)
Risk premium mostly gone by fall (October/November)
Takeaway: Risk premiums are not suggesting a rapid solution.
West Texas Intermediate Crude Oil Futures Curve ($/Barrel)
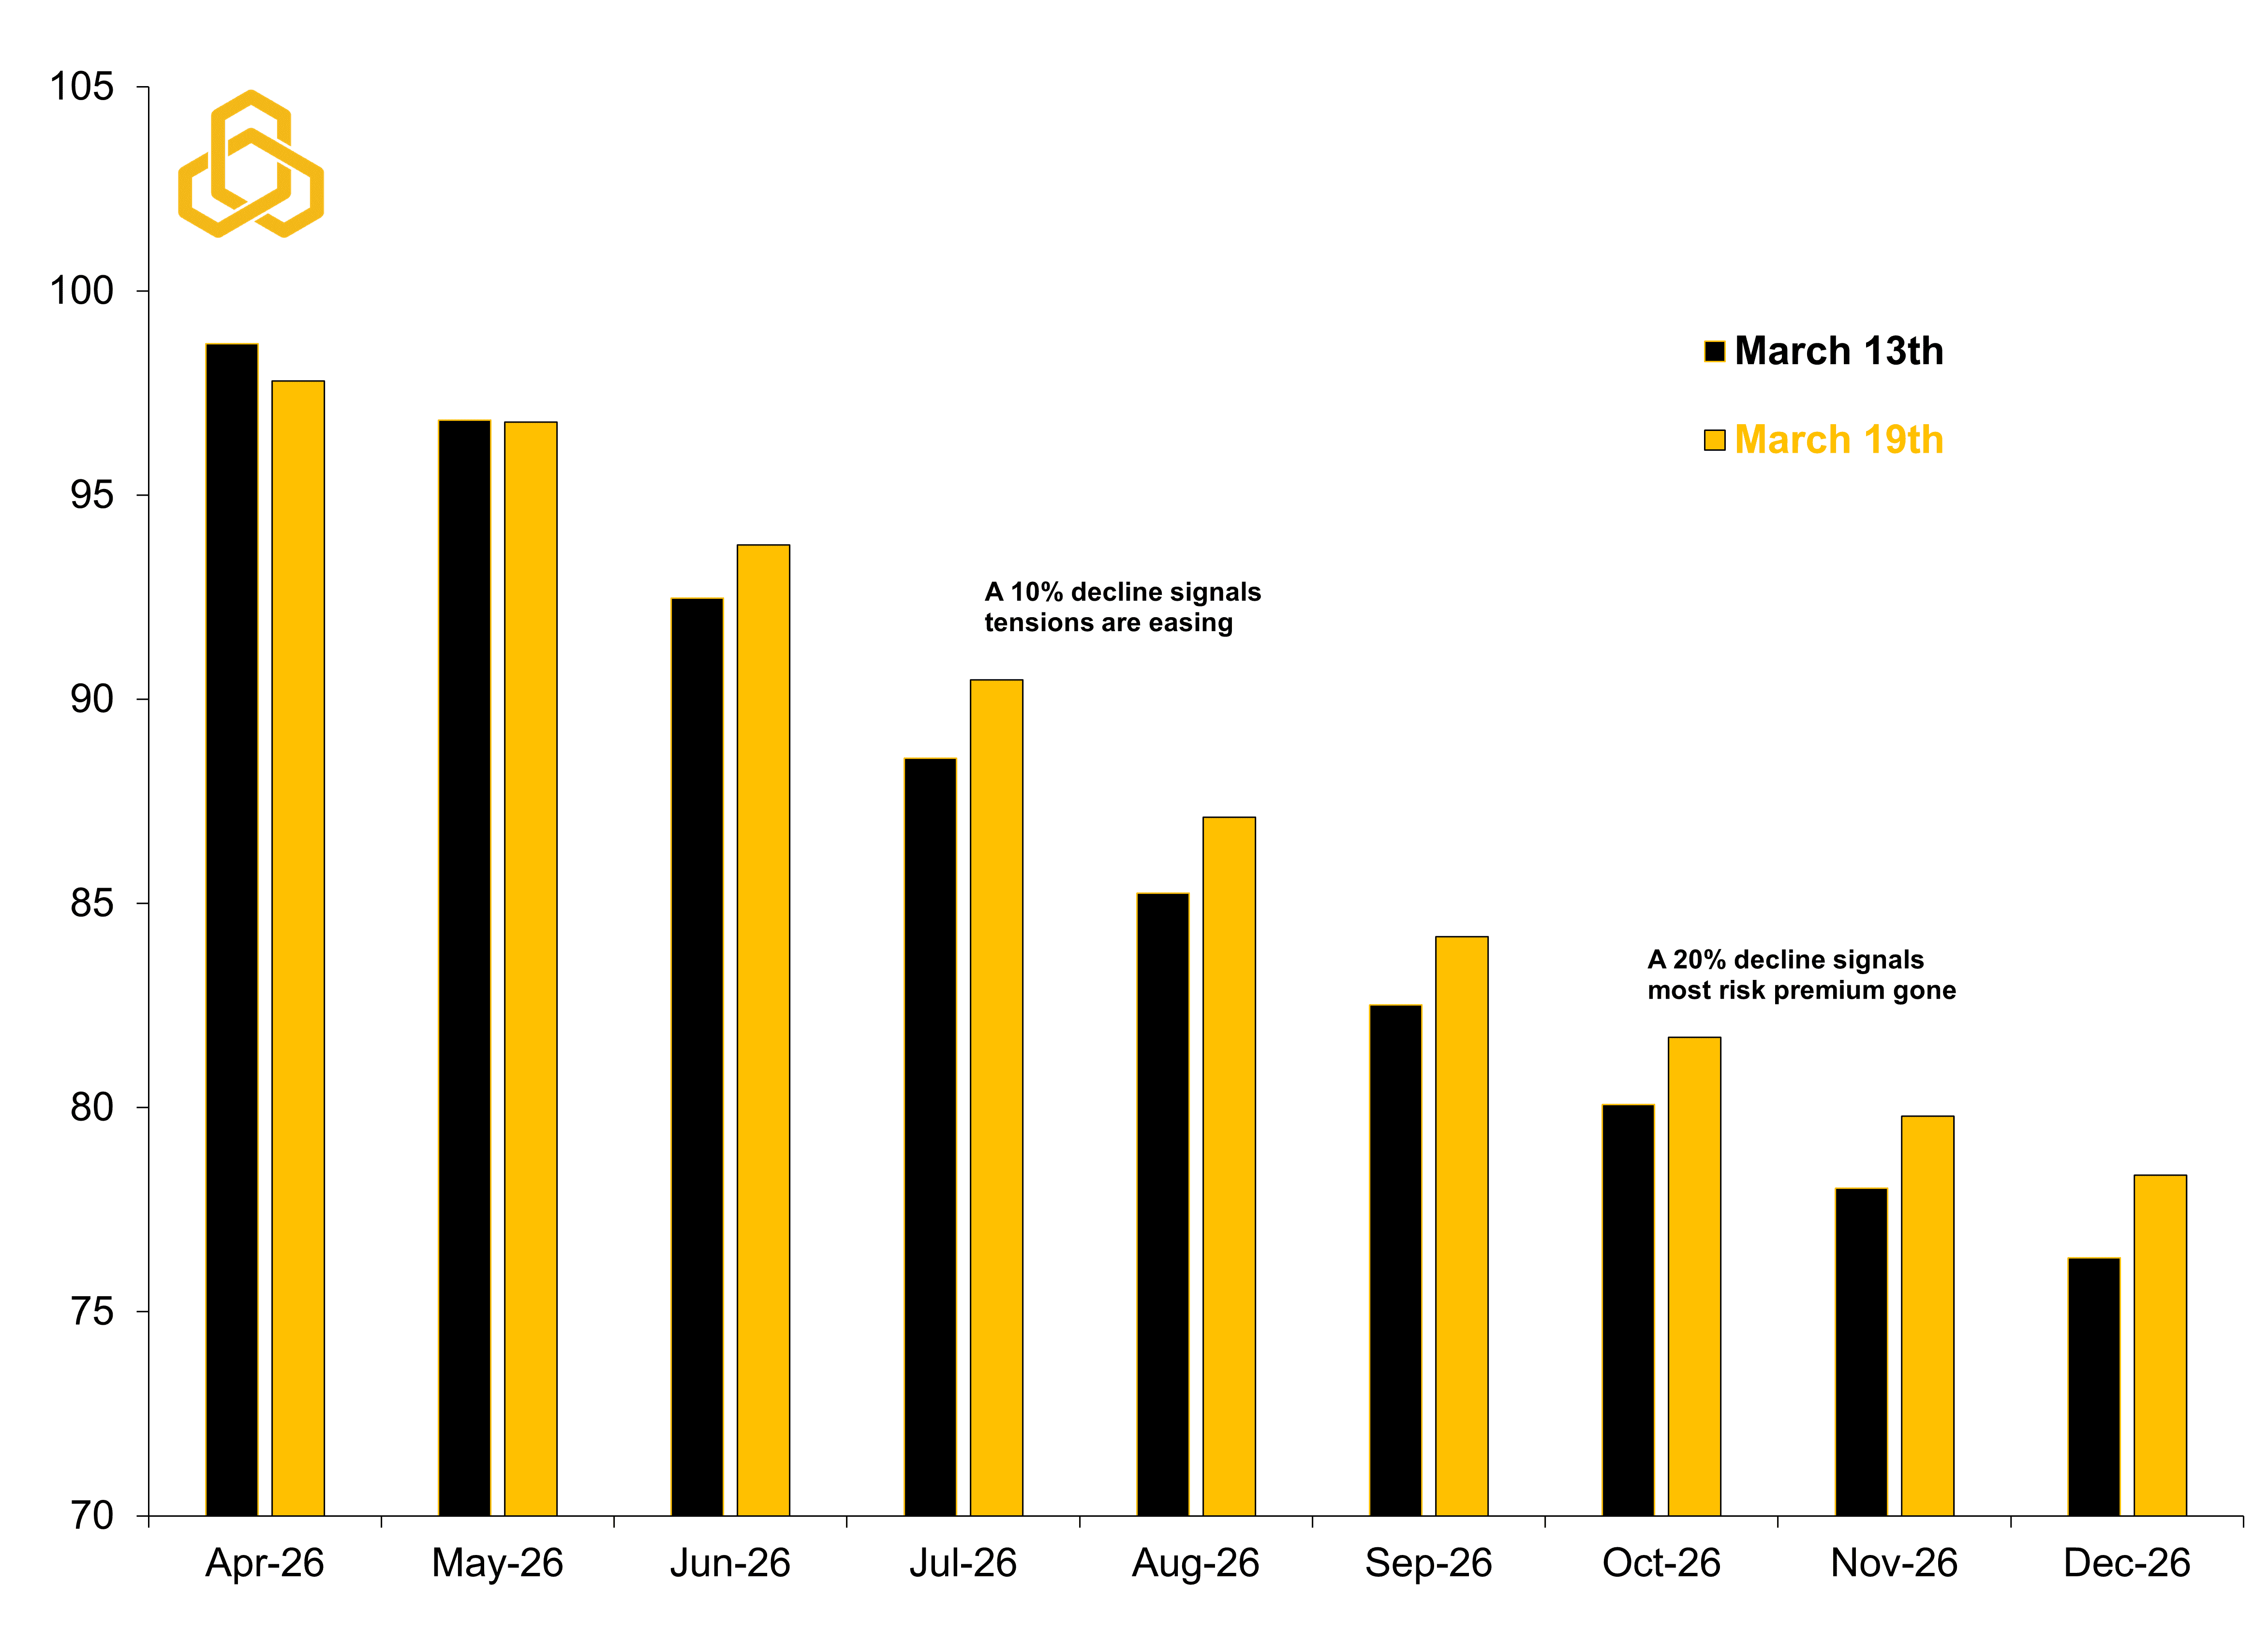
Sources: Department of Energy, Bloomberg L.P., and Potomac. Data as of March 12, 2026.
2) Betting Markets: Where Money Meets Conviction
Platforms like Polymarket and Kalshi are a new, but incredibly useful tool. They show where participants are putting capital – not just opinions.
Right now, the odds of a potential ceasefire between the U.S., Israel, and Iran are more optimistic than the oil curve with the majority seeing on by the end of June. As we discuss below, perhaps investors are pricing in more political pressure while the curve is pricing in more risk premium.
Takeaway: Don’t expect an immediate resolution, but perhaps by summer
Polymarket’s Odds of a U.S. / Israel - Iran Ceasefire by Date
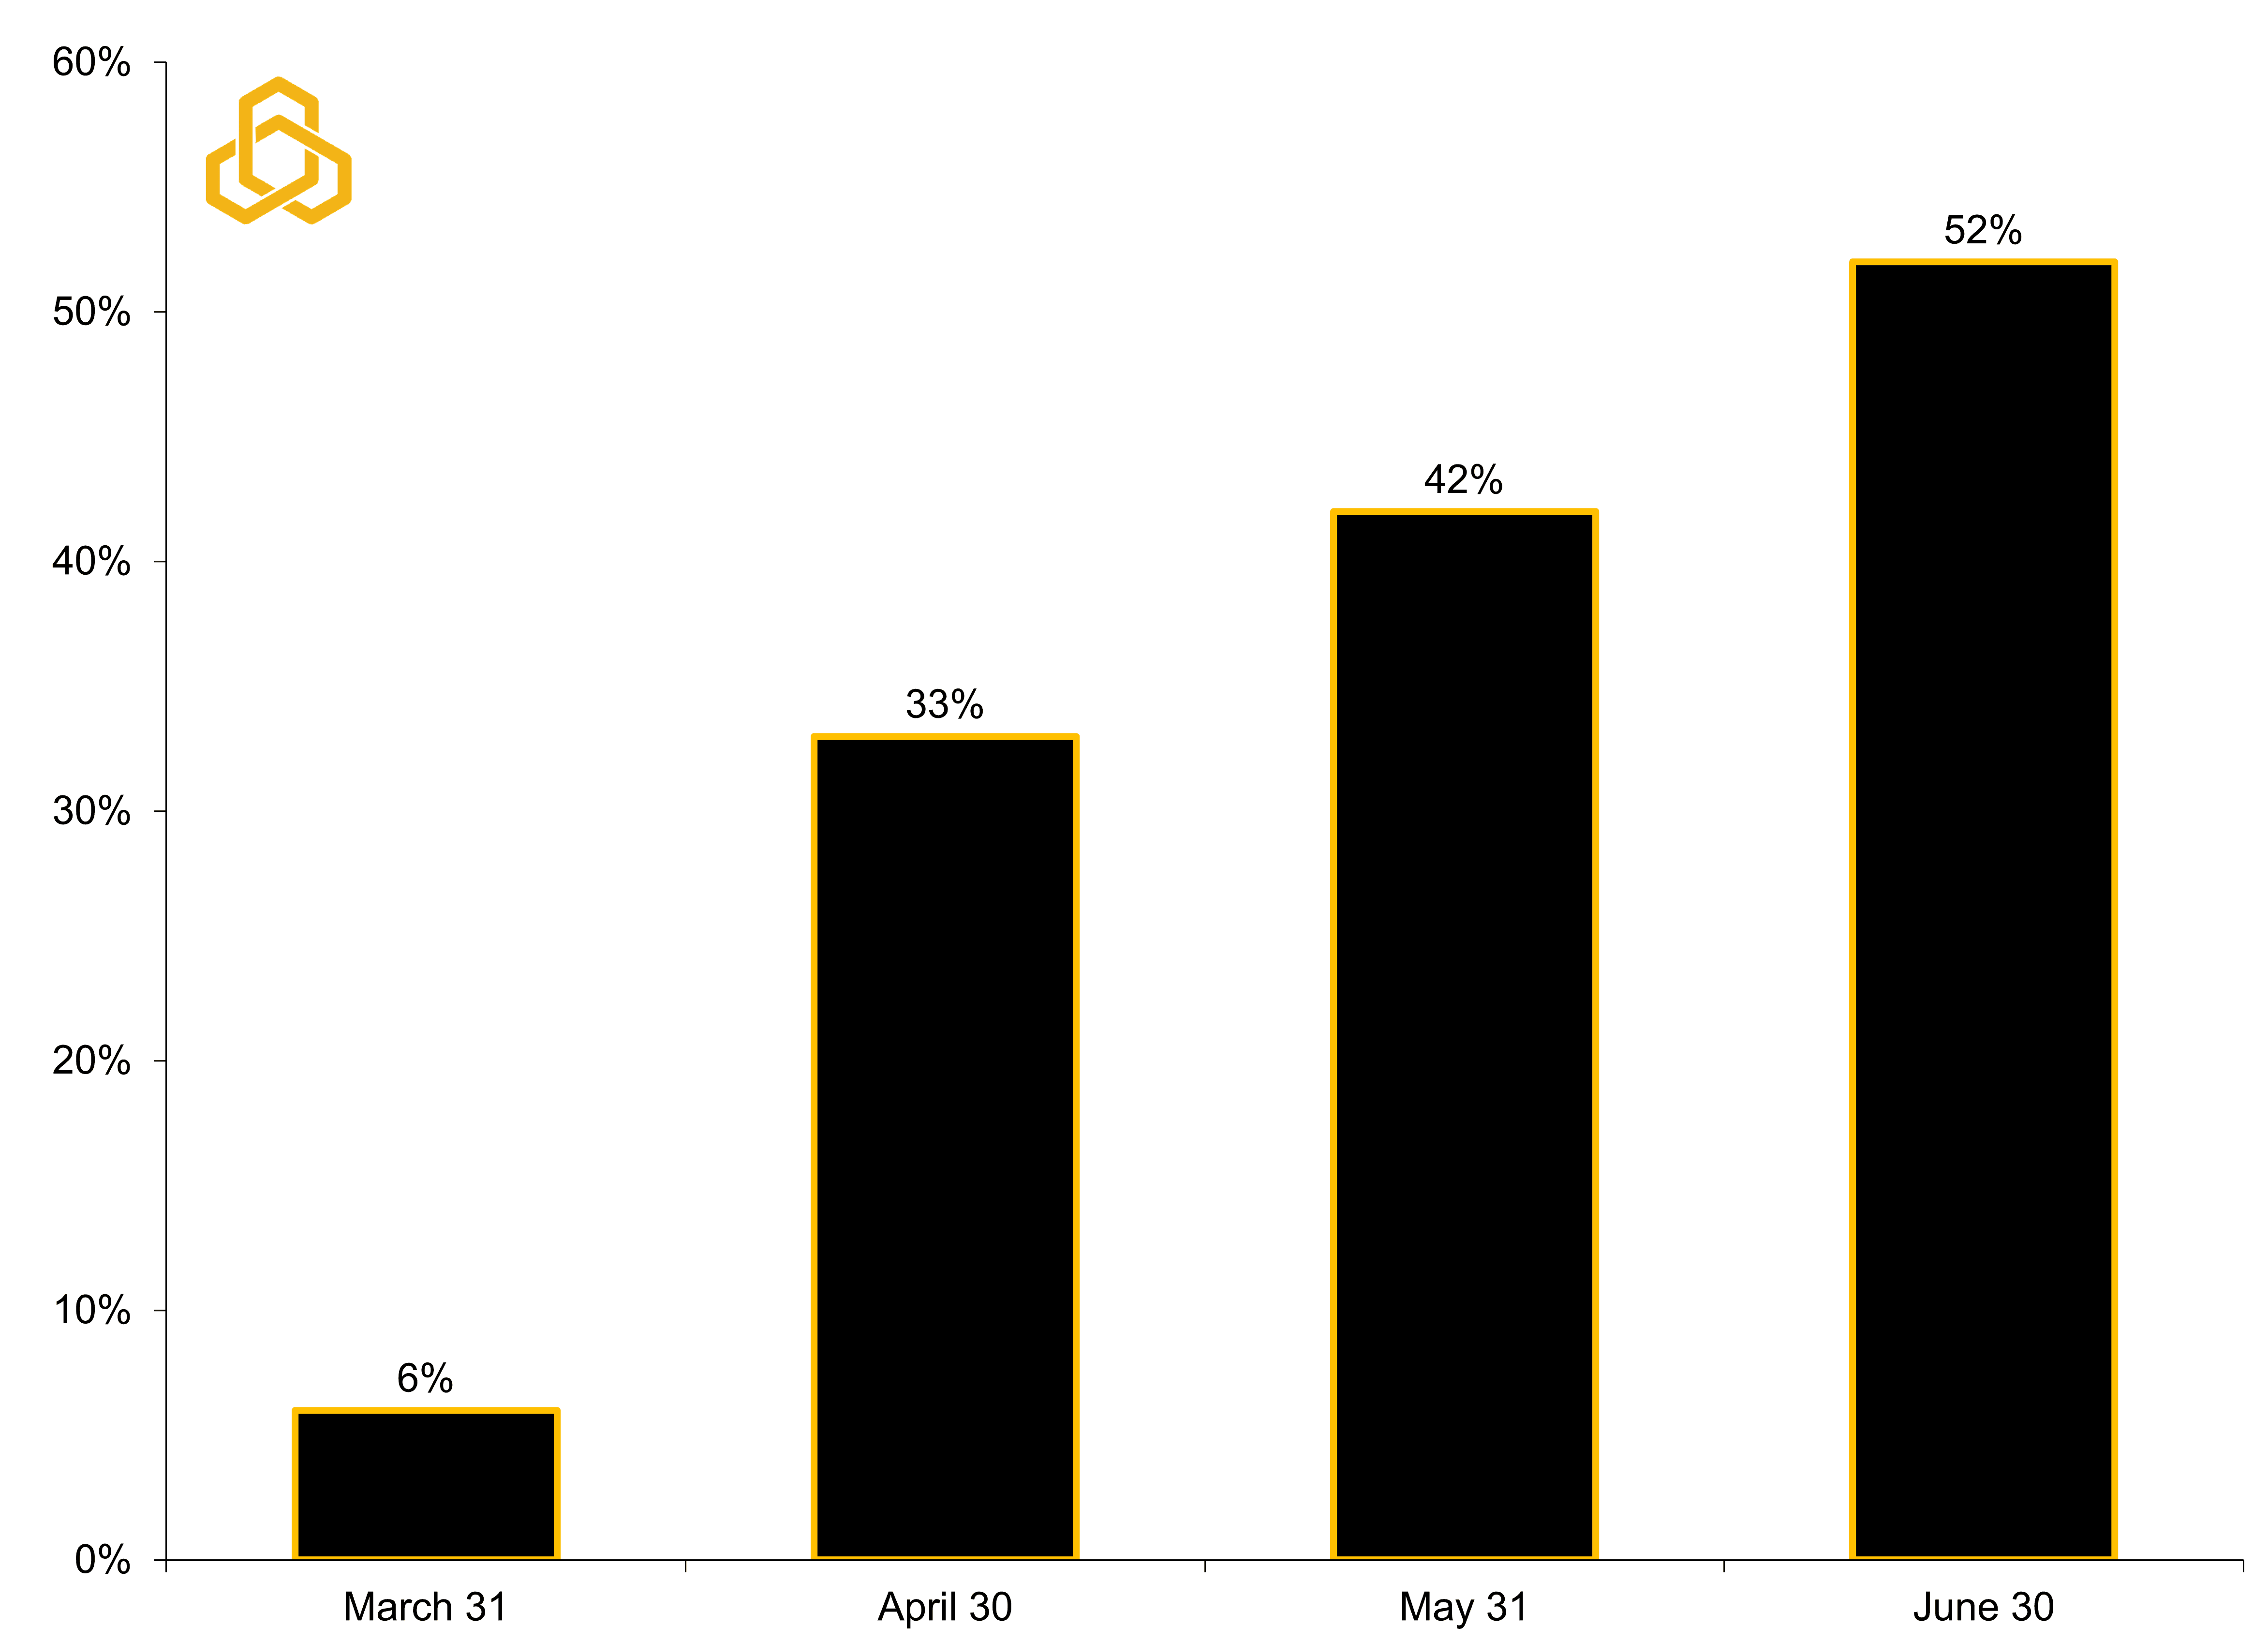
Sources: Department of Energy, Bloomberg L.P., and Potomac. Data as of March 19, 2026. All forecasts are expressions of opinions and are subject to change without notice and are not intended to be a guarantee.
3) Inflation: Headline to Move Higher, Core Unclear
Inflation is the lingering aftershock of the pandemic and higher oil prices will only add to that pressure. At current levels, oil likely pushes headline CPI back toward early 2024 levels with the Cleveland Fed’s Inflation Nowcast currently sitting at 3%.
The key question is whether this spills into core inflation. If it stays contained, then the market will likely see it as manageable, but any further rise in services inflation could become a negative catalyst for the market.
Takeaway: Inflation is moving in the wrong direction, but the market is going to care much more if core inflation readings start to creep upward.
U.S. Consumer Price Index vs. Crude Oil Price (YoY Percent Change)
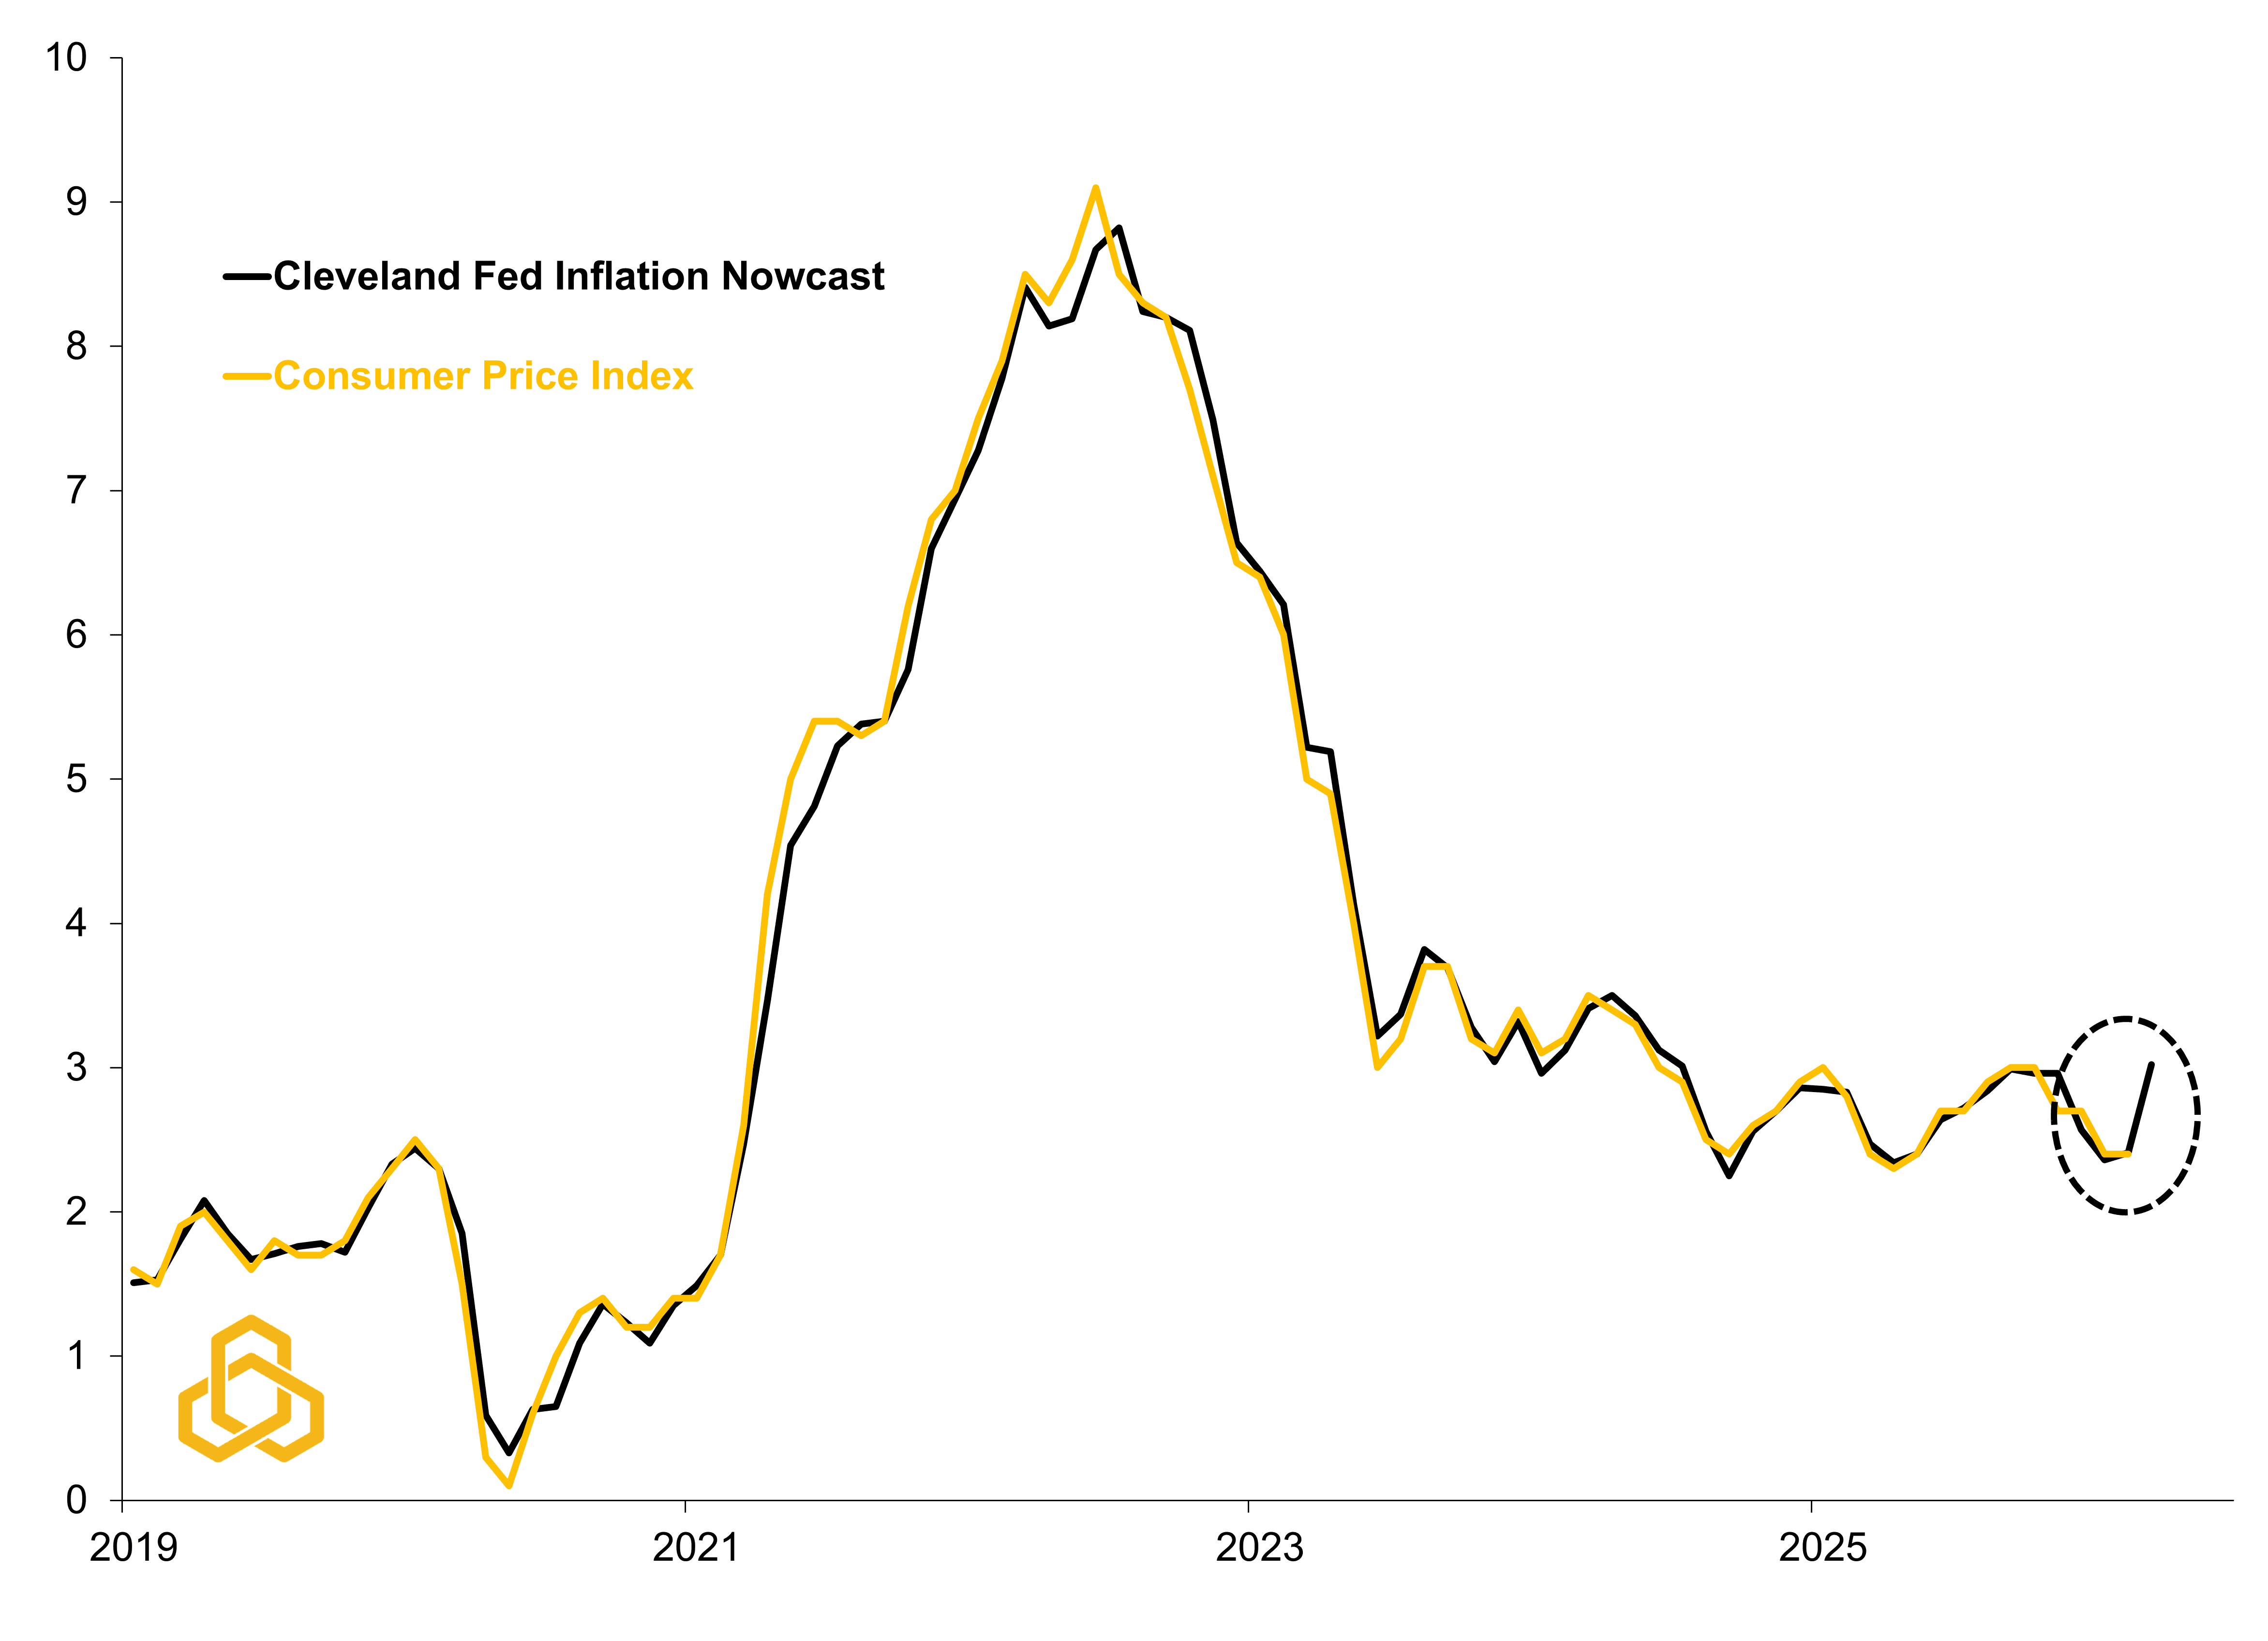
Sources: Bureau of Labor Statistics, Department of Energy, Bloomberg L.P., and Potomac. Data as of March 17, 2026. All forecasts are expressions of opinions and are subject to change without notice and are not intended to be a guarantee.
4) The Fed: Pause Mode Extended
Global central banks have been easing, but this shock complicates things. In the U.S., the 2-year Treasury yield, a proxy for Fed expectations, has risen about 47 basis points since the conflict began. This move reflects both higher inflation expectations and the pricing out of all Fed rate cuts in 2026.
Although we should note that this depends on the labor market holding up as much as it does the price of oil. If the labor market shows further weakness, then it could be pulled forward again.
Takeaway: Even one rate cut in 2026 is now in question.
Two-Year U.S. Treasury Yield vs. Fed Funds Rate (%)
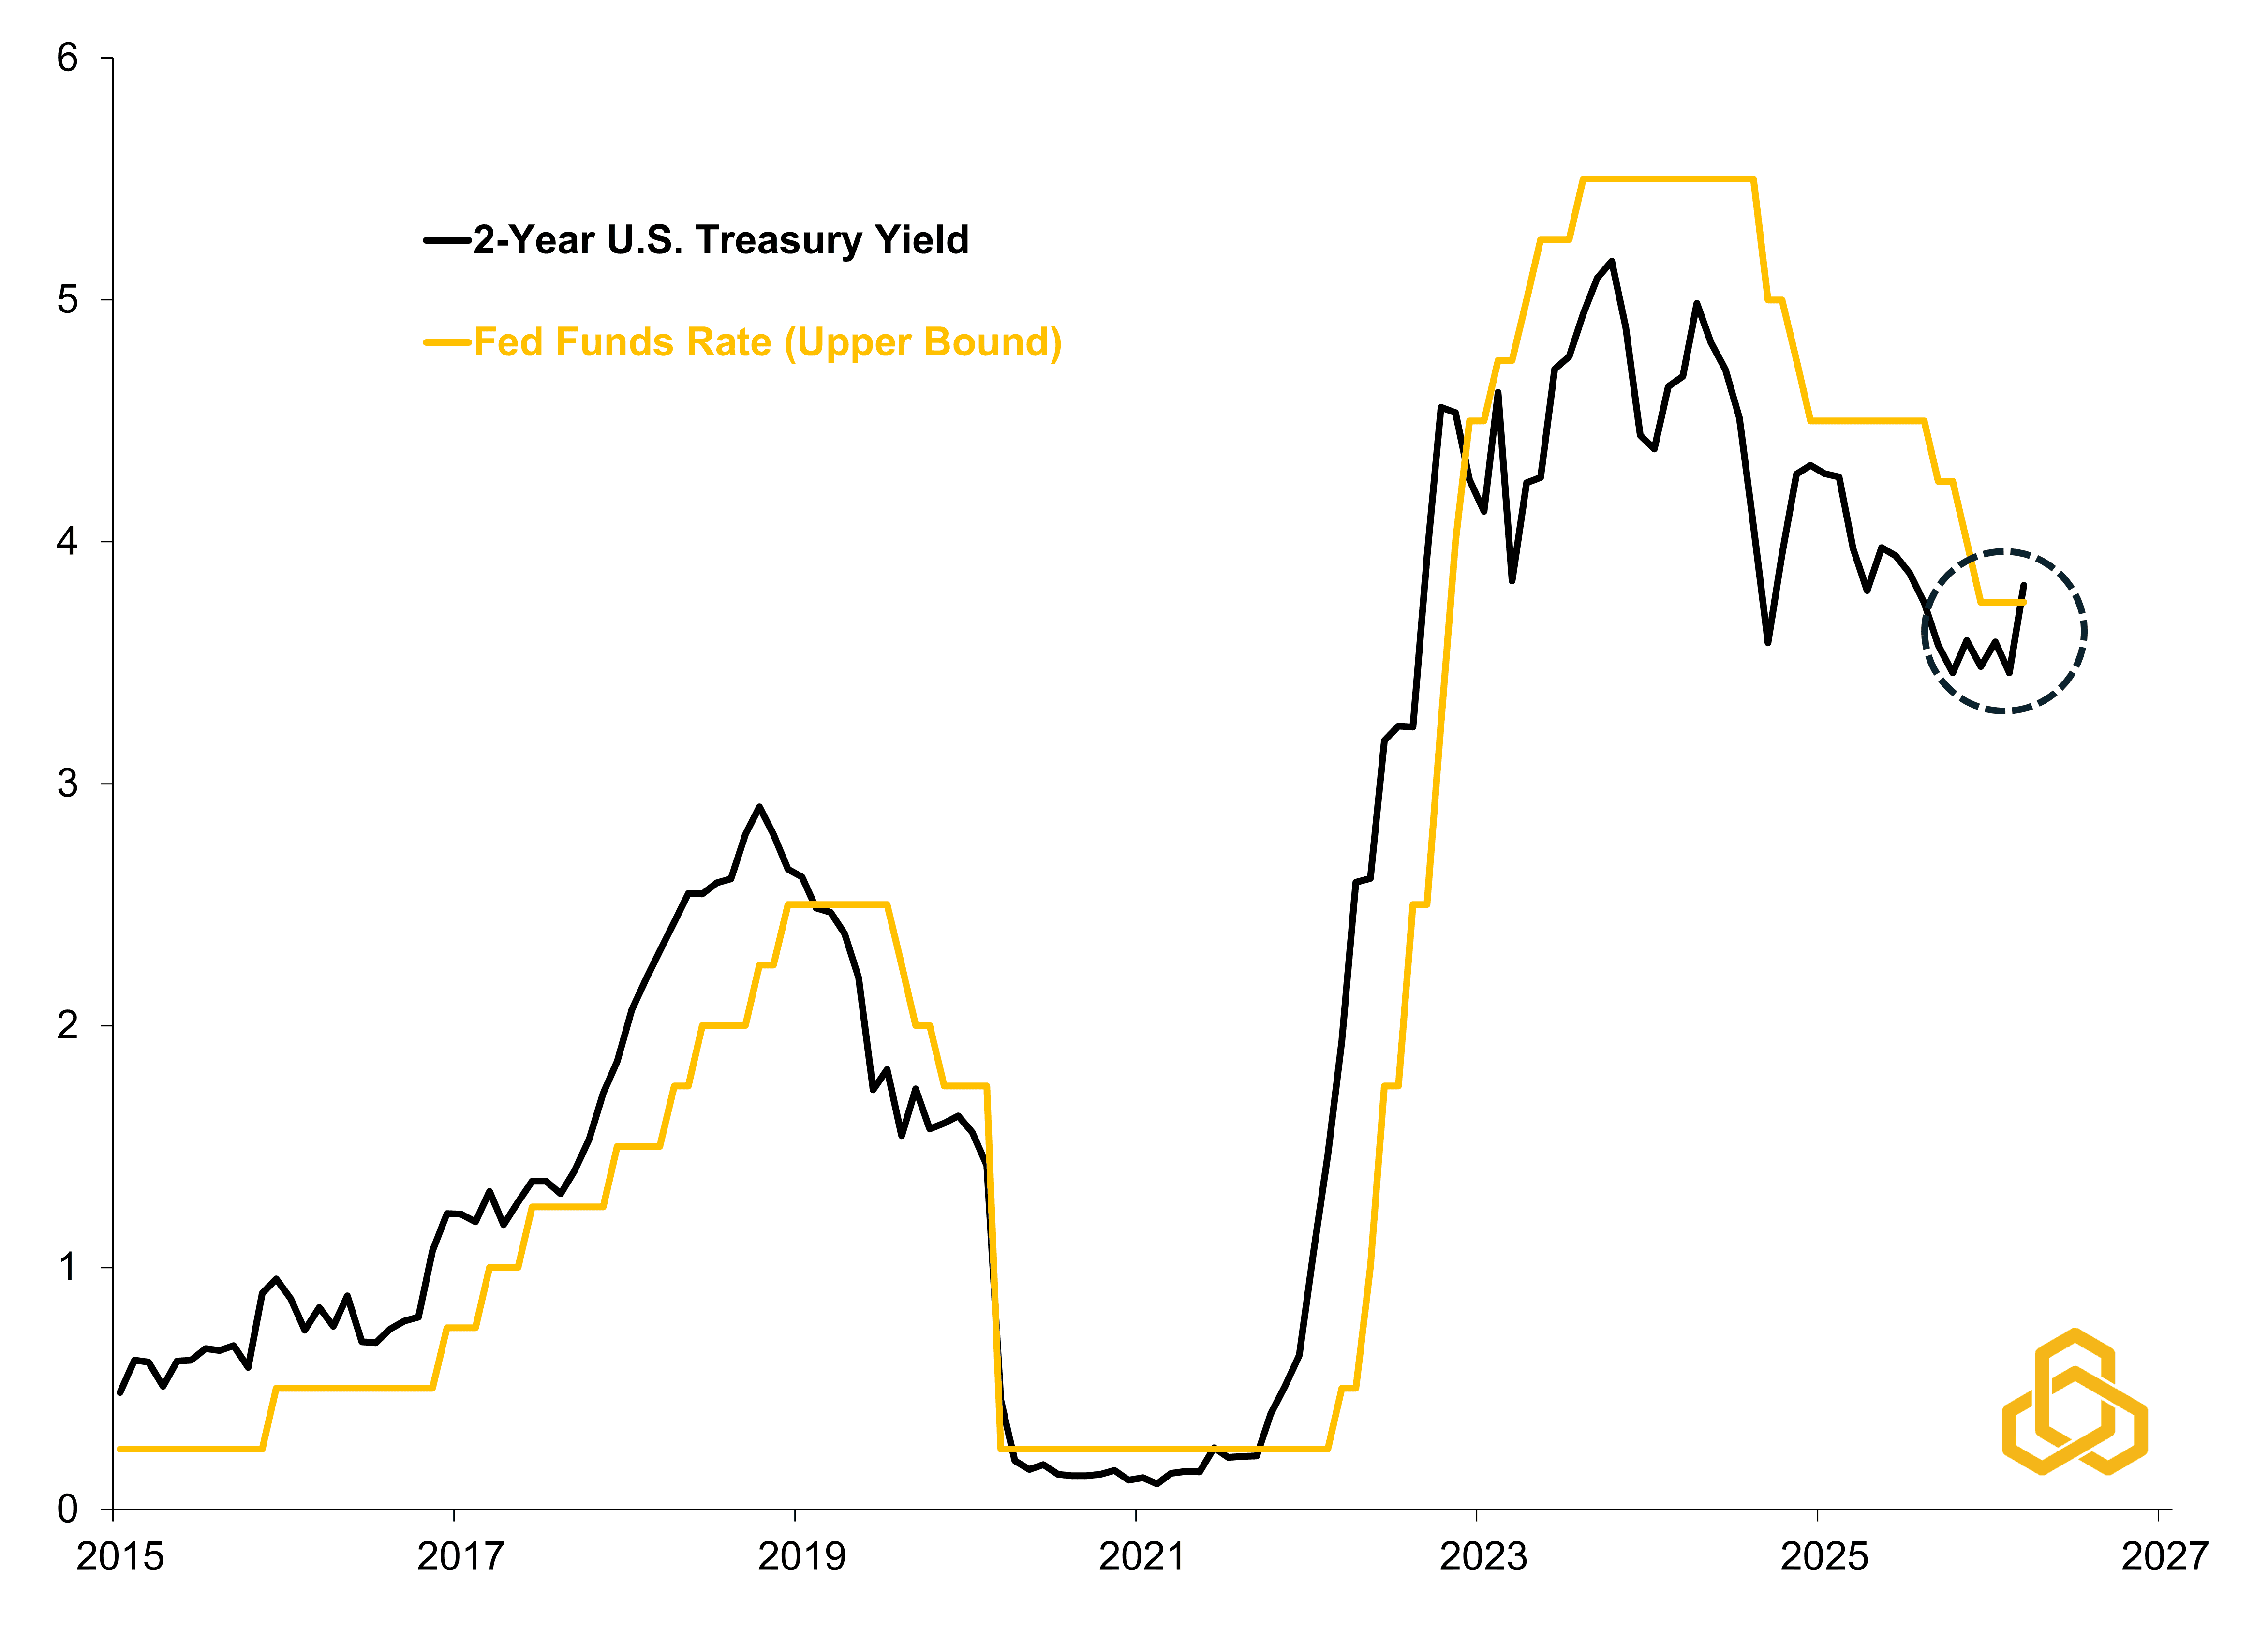
Sources: Department of Treasury, Federal Reserve Board, Bloomberg L.P., and Potomac. Data as of March 19, 2026.
5) Politics: The Midterm Clock is Ticking
Geopolitics doesn’t exist in a vacuum with gasoline prices one of the most visible pressures on consumers. The longer they stay elevated, the greater the political cost.
Since the conflict began, the odds of a Republican victory in the Senate have fallen from 60% to roughly a coin flip. Combined with an expected Democratic victory in the House, pressure will likely continue to build on President Trump to stabilize energy markets and to reopen the Strait of Hormuz.
Takeaway: Political incentives are building for a resolution sooner.
Odds of a Republican Victory in the U.S. Senate vs. Retail Gas Prices
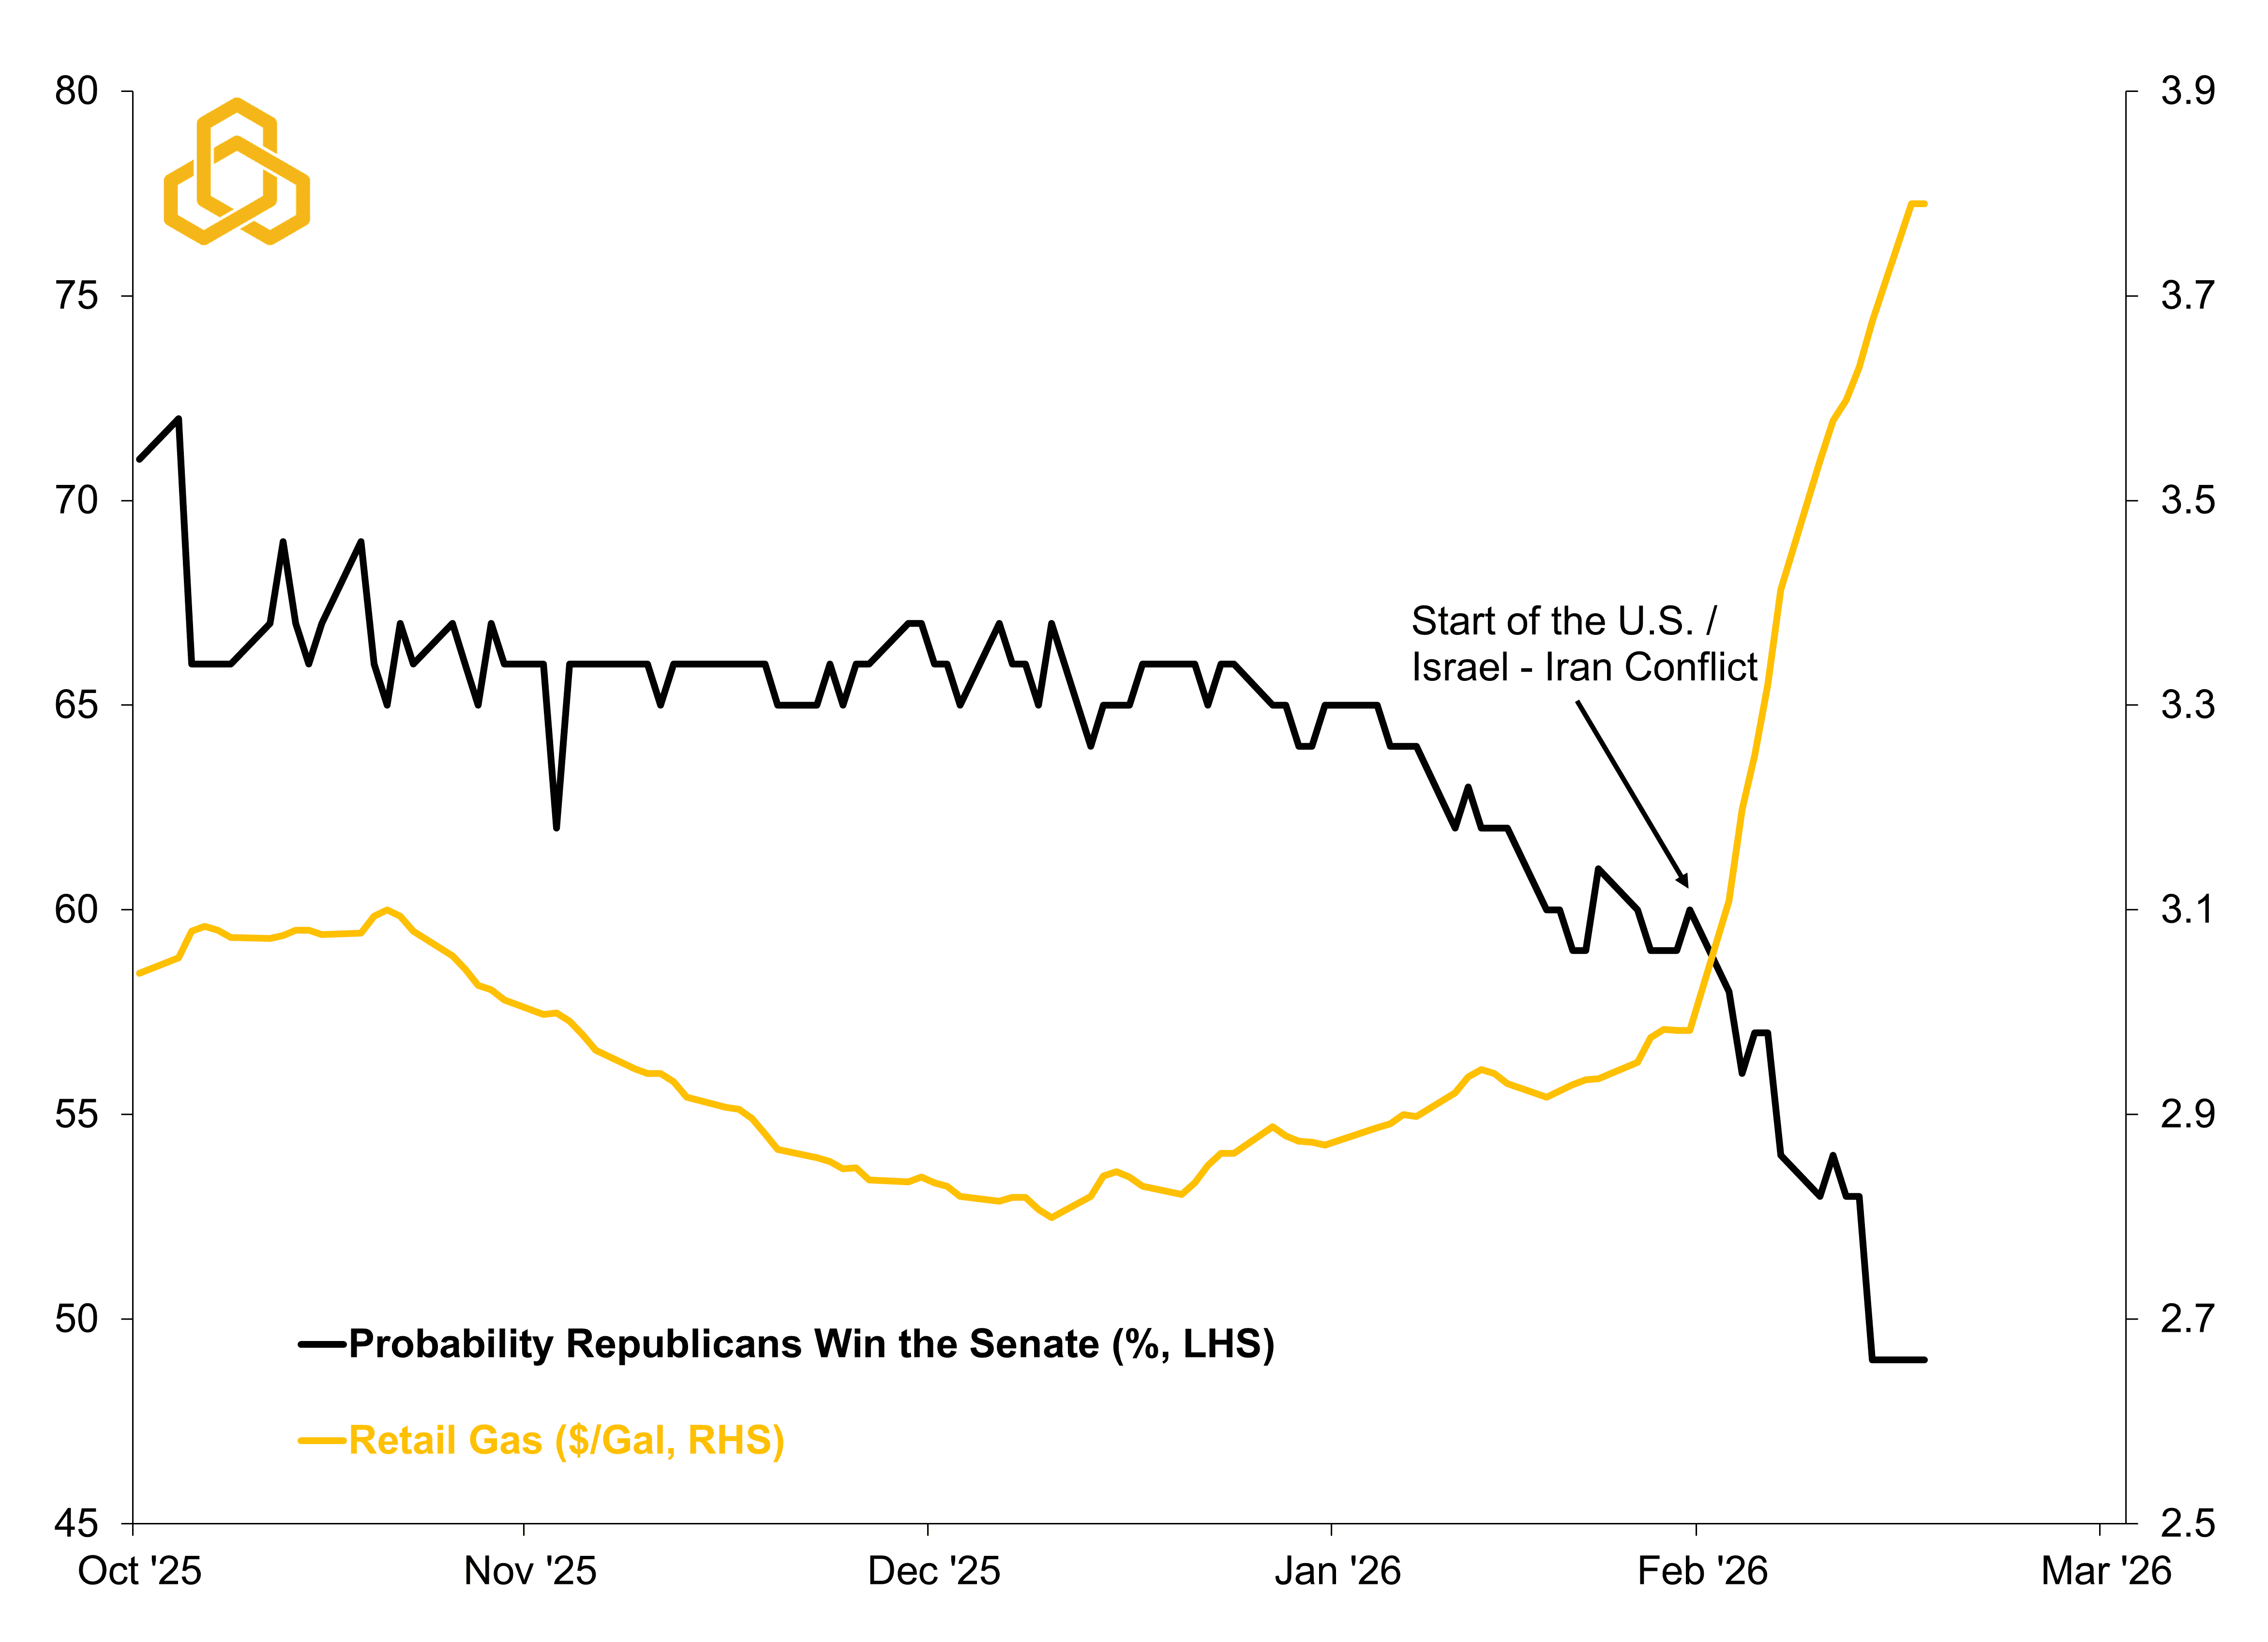
Sources: Polymarket, American Automobile Association, Bloomberg L.P., and Potomac. Data as of March 17, 2026. All forecasts are expressions of opinions and are subject to change without notice and are not intended to be a guarantee.
Bottom Line
Uncertainty remains high, and commodity prices are still elevated. But beneath the surface, markets are already beginning to map out a path toward eventual de-escalation.
For now, the data suggests the shock may persist longer than initially expected, but the worst of the risk premium could fade over the coming months. We’ll continue to monitor these indicators closely and update our view as the situation evolves. In our “Keeping it Strait” Market Monitor below we share a more comprehensive list of indicators that we are following and will share each week.
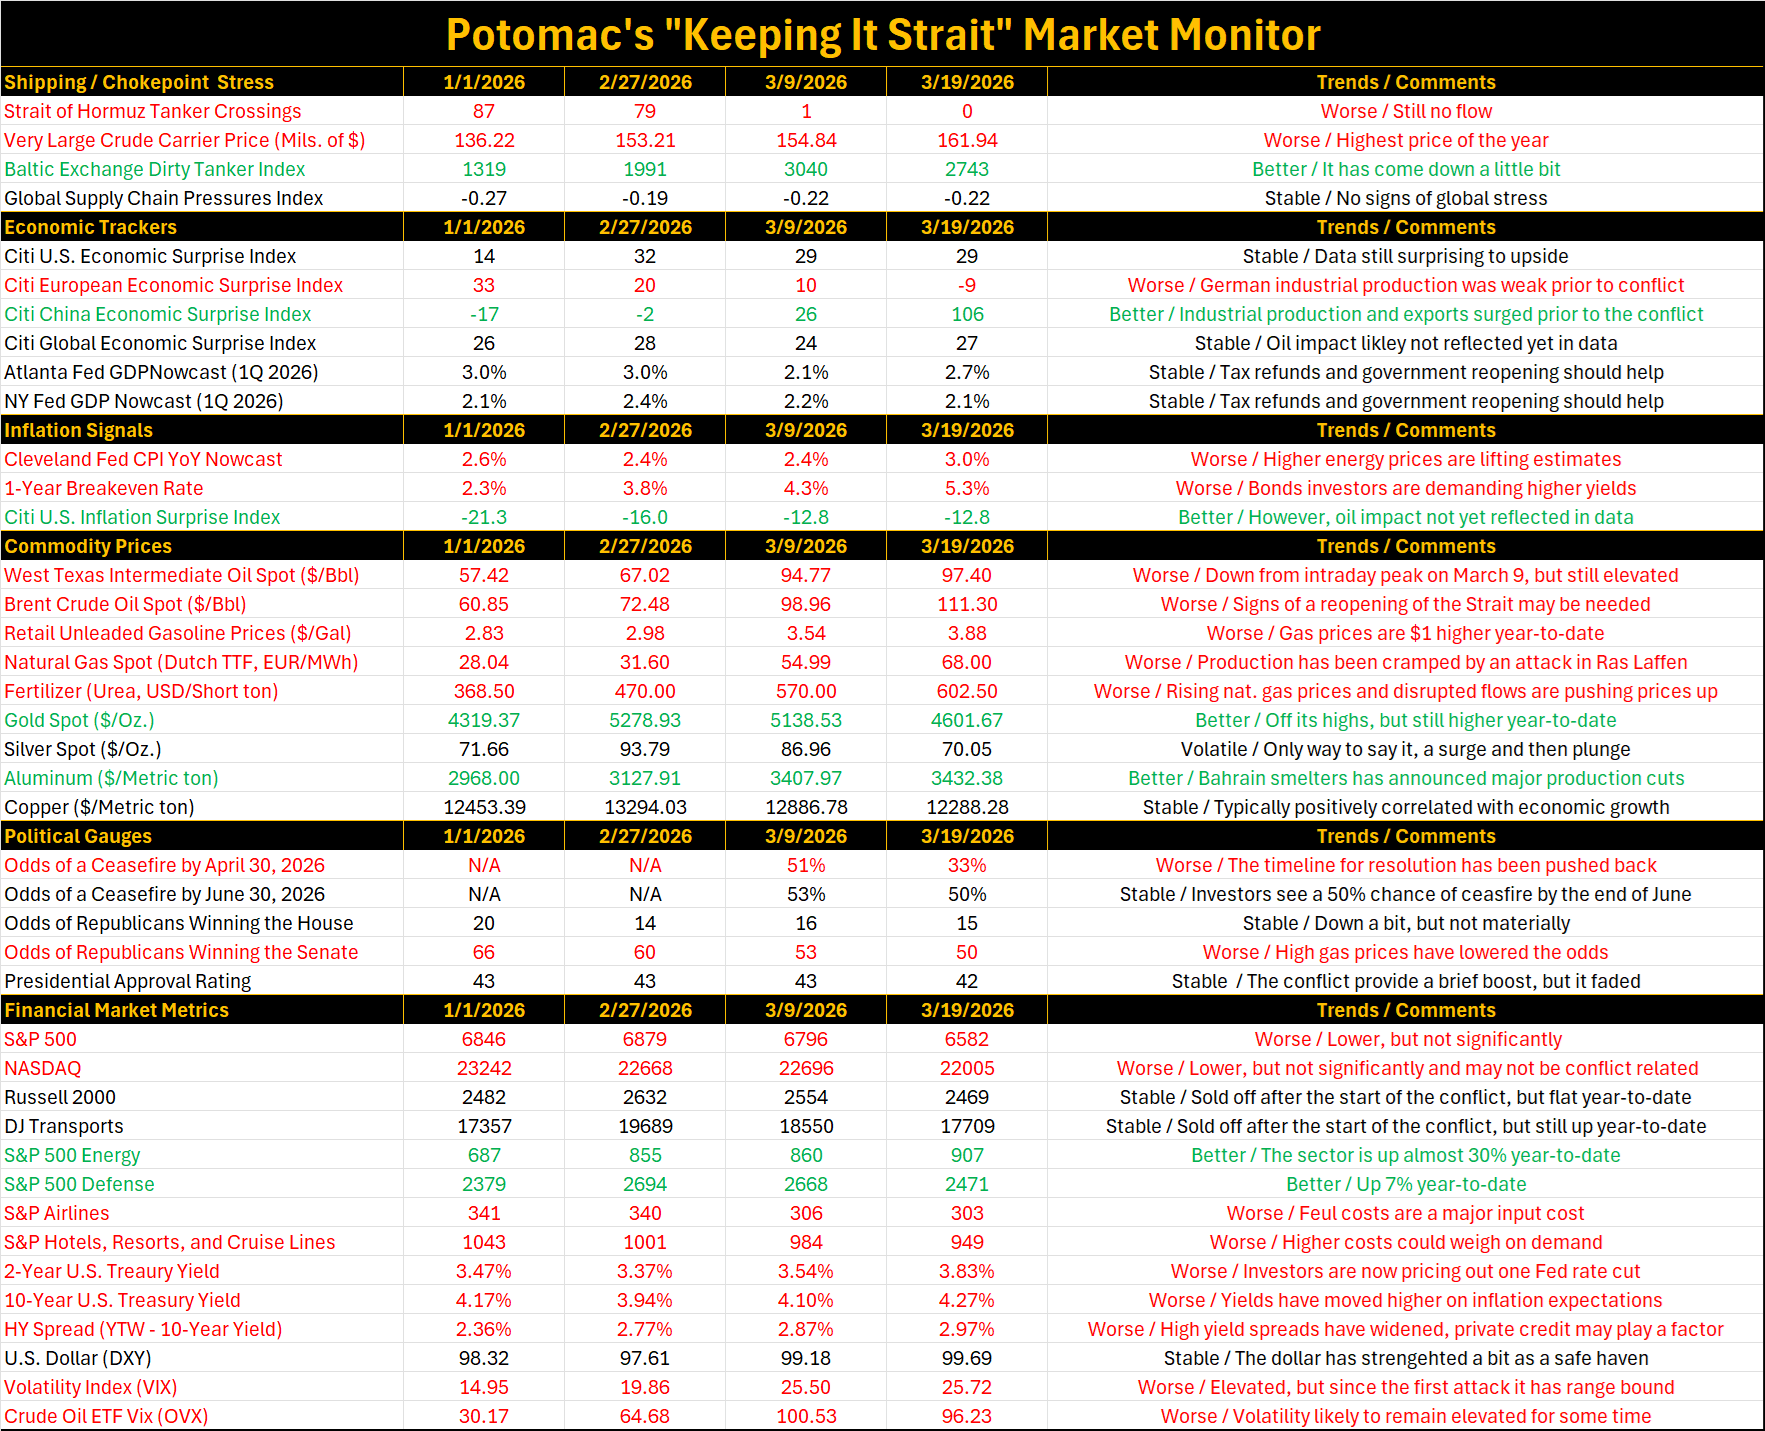
Source: Bloomberg L.P. and Potomac. Data as of March 18, 2026. Note 1: The dates selected are 2/27/2026 (start of the conflict), 3/9/2026 (initial oil surge/peak as the Strait closed), and 3/18/2026 (latest data). Note 2: Economic and inflation surprise index readings about zero imply that data are beating the consensus on average, below zero means that data are missing expectations. Note 3: In commodity prices, we ranked higher oil, natural gas, retail gas, and fertilizer prices as bad for the economy because it weighs on growth, we ranked rising gold, silver, and aluminum prices are good due to the investor perspective. Note 4: Political betting market odds are forecasts. All forecasts are expressions of opinions and are subject to change without notice and are not intended to be a guarantee.
PFM-315-20260304


