
Naturally, in times of high inflation, the Federal Reserve's actions dominate media coverage, especially leading up to interest rate decisions.
The federal funds rate rose from 0.25% in March 2022, to 5.5% in July of 2023, and stayed there for over a year. As of September 19, 2024, the Fed pivoted and lowered the rate to 5.00% . This "50 basis point" cut has sparked many debates among commentators.
Is this bullish or bearish? What happened last time? Stocks are at all-time highs, so how does that affect the narrative?
The potential narratives could go on, and people can argue endlessly over them. We prefer to look at the data and see if the Fed's pivot is actionable, or just noise.
Popular narratives
Before reviewing the data to form our conclusion, let's review the common narratives surrounding rate cuts, as generated by Claude.ai:
View 1: Bullish Outlook
Lower rates stimulate borrowing and spending, bosting economic growth.
Reduced borrowing costs increase corporate profits.
Lower Yields on bonds make sstocks realtively more attractive.
Historically, markets often rally after rate cuts.
Improved liquidity conditions support asset prices.
View 2: Bearish Outlook
Rate cuts signal economic weakness, potentially leading to reduced earnings.
Markets may have already priced in expected cuts, limiting upsides.
Concerns that rate cuts aren't enough to precent a recession.
Historically, data shows mixed results, with some periods of market decline after cuts.
Rate cuts may be seen as reactive rather than proactive, reducing investor confidence.
Source: Claude.ai
As this shows, there are many economic perspectives on what could happen. While having an opinion is not wrong, money managers ultimately put capital at risk, so a decision must be made. Is it bullish or bearish?
Let's look at the numbers.
Cut Dates and Forward Returns
Before 1990, the Federal Reserve database doesn't list exact historical rate cut dates. To ensure a repeatable process for the dates prior to 1990, we selected the cut date as the highest effective federal funds rate after a prior increase.
The table below shows each Fed cut date and the forward results for the S&P 500 Index (Price Return).
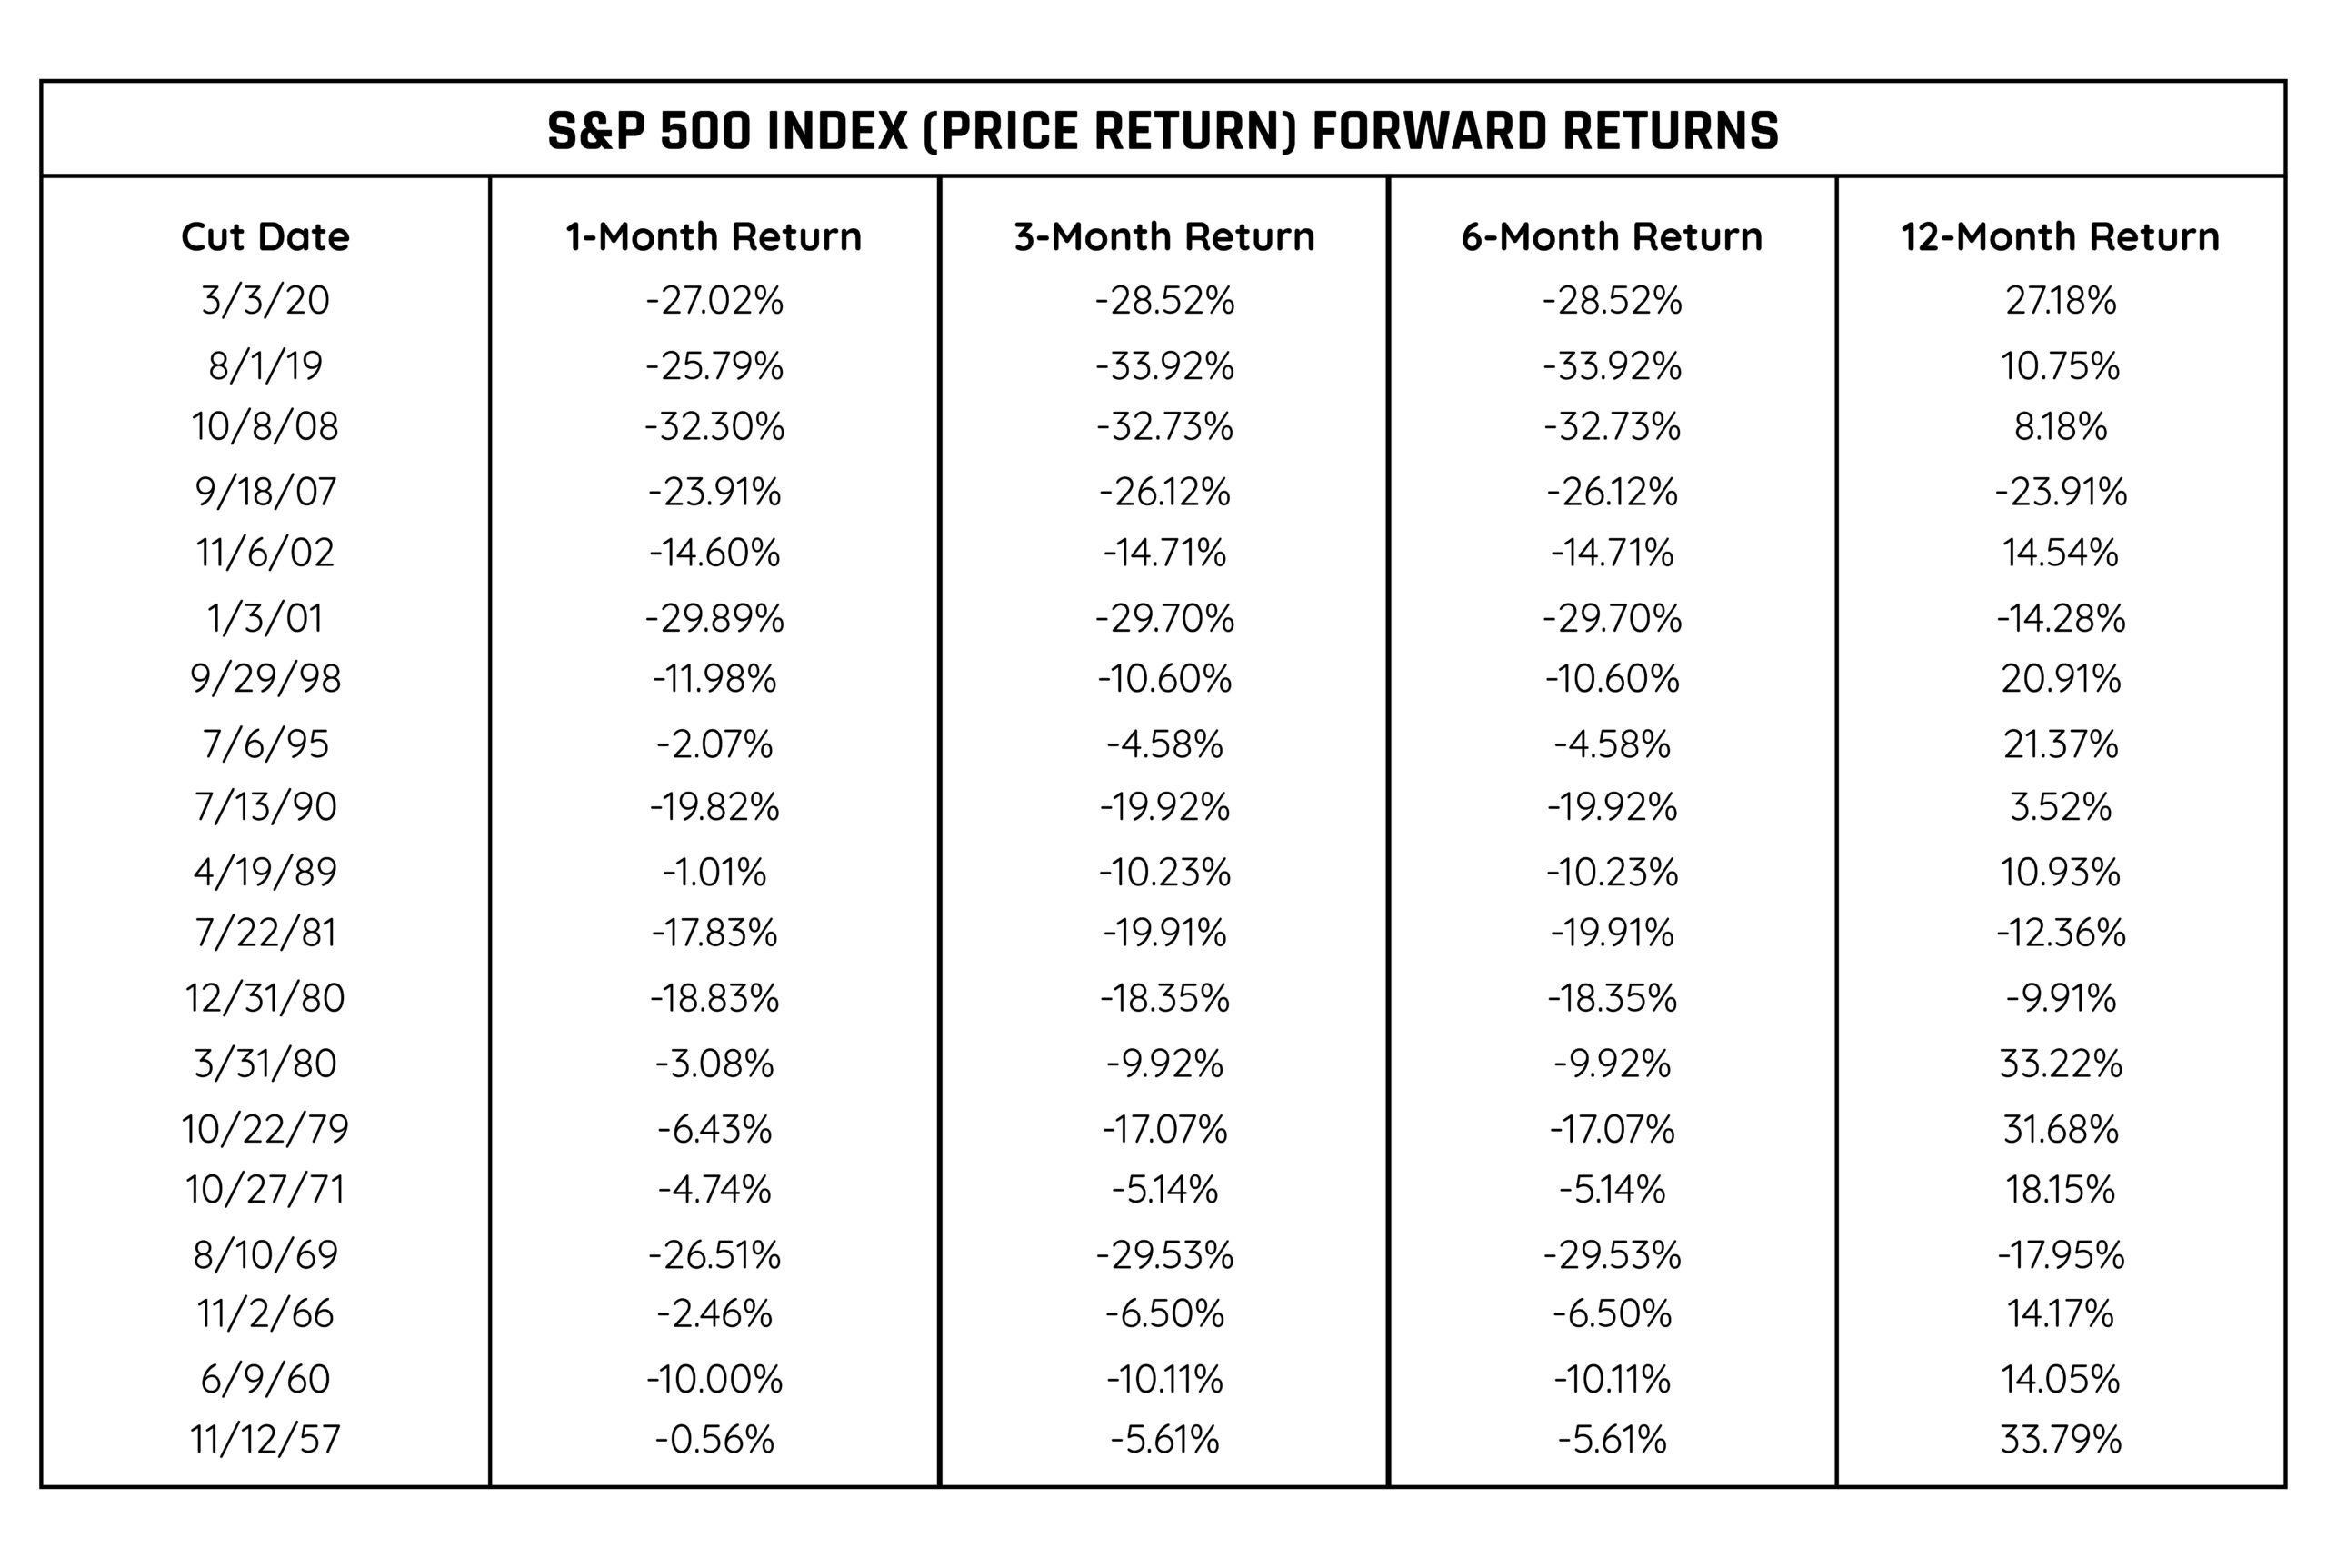
Source: Potomac, Norgate, Y-Charts, Federal Reserve
A first glance shows that over the next year, the S&P 500 Index (PR) generally performed well following the pivot. However, sometimes there were significant drawdowns along the way.
It's important to note that a forward 12-month return on an asset that has historically drifted higher, like the S&P 500, will often show good results.
Cut Dates and Averages
A better approach is to compare the forward returns, after the Fed cut, to the average returns over any period in question. In other words, how did the 12 months after the cut compare to how it has done in all 12-month periods?
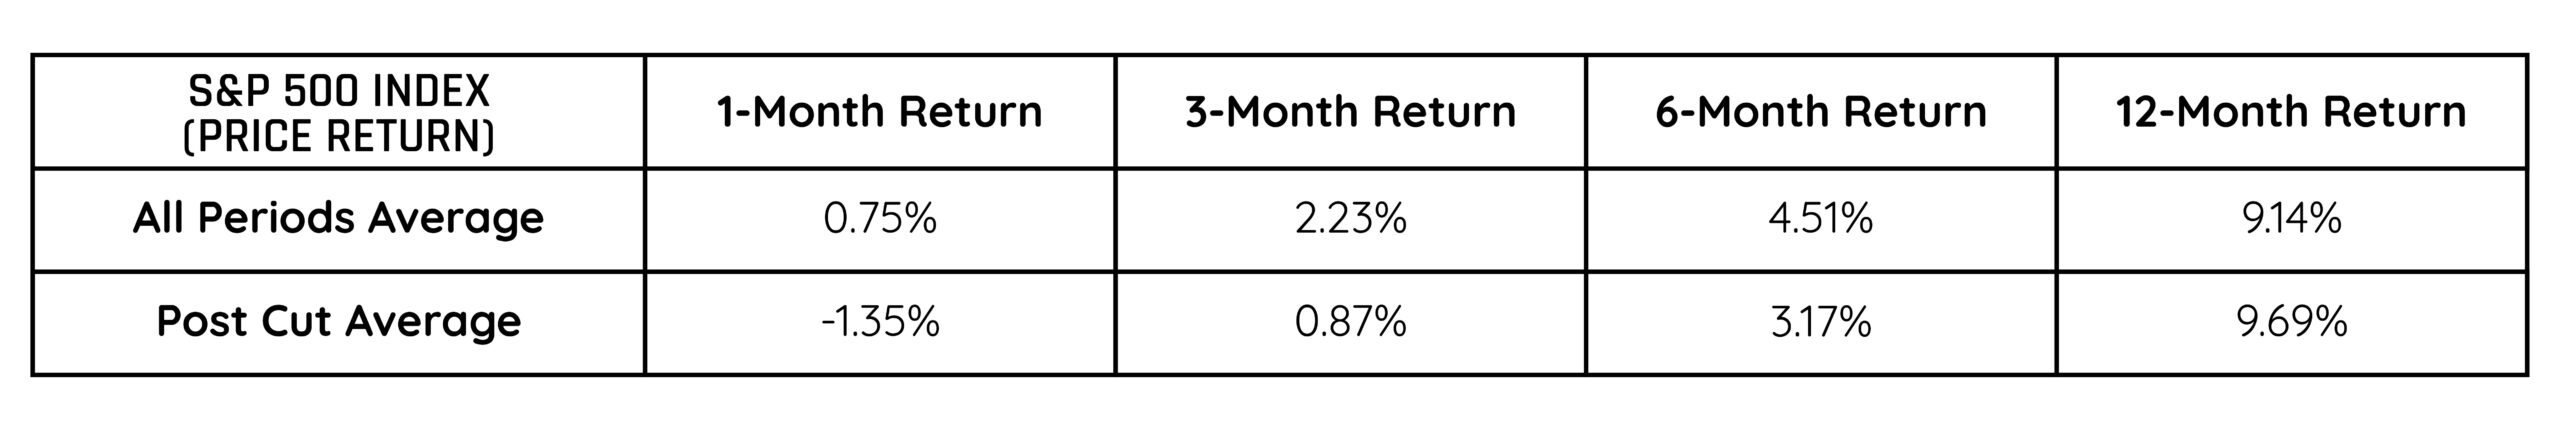
Source: Potomac, Norgate, Y-Charts, Federal Reserve
This data supports our initial observation: looking out one year from the Fed cut has produced an average return higher than the typical 12-month return. However, it also shows that the periods immediately after the cut have been more volatile than normal.
The Past Hasn't Been Easy
To quantify the risk, we look at the Maximum Drawdown (MDD) and the Maximum Adverse Excursion (MAE) for the year following the cut date.
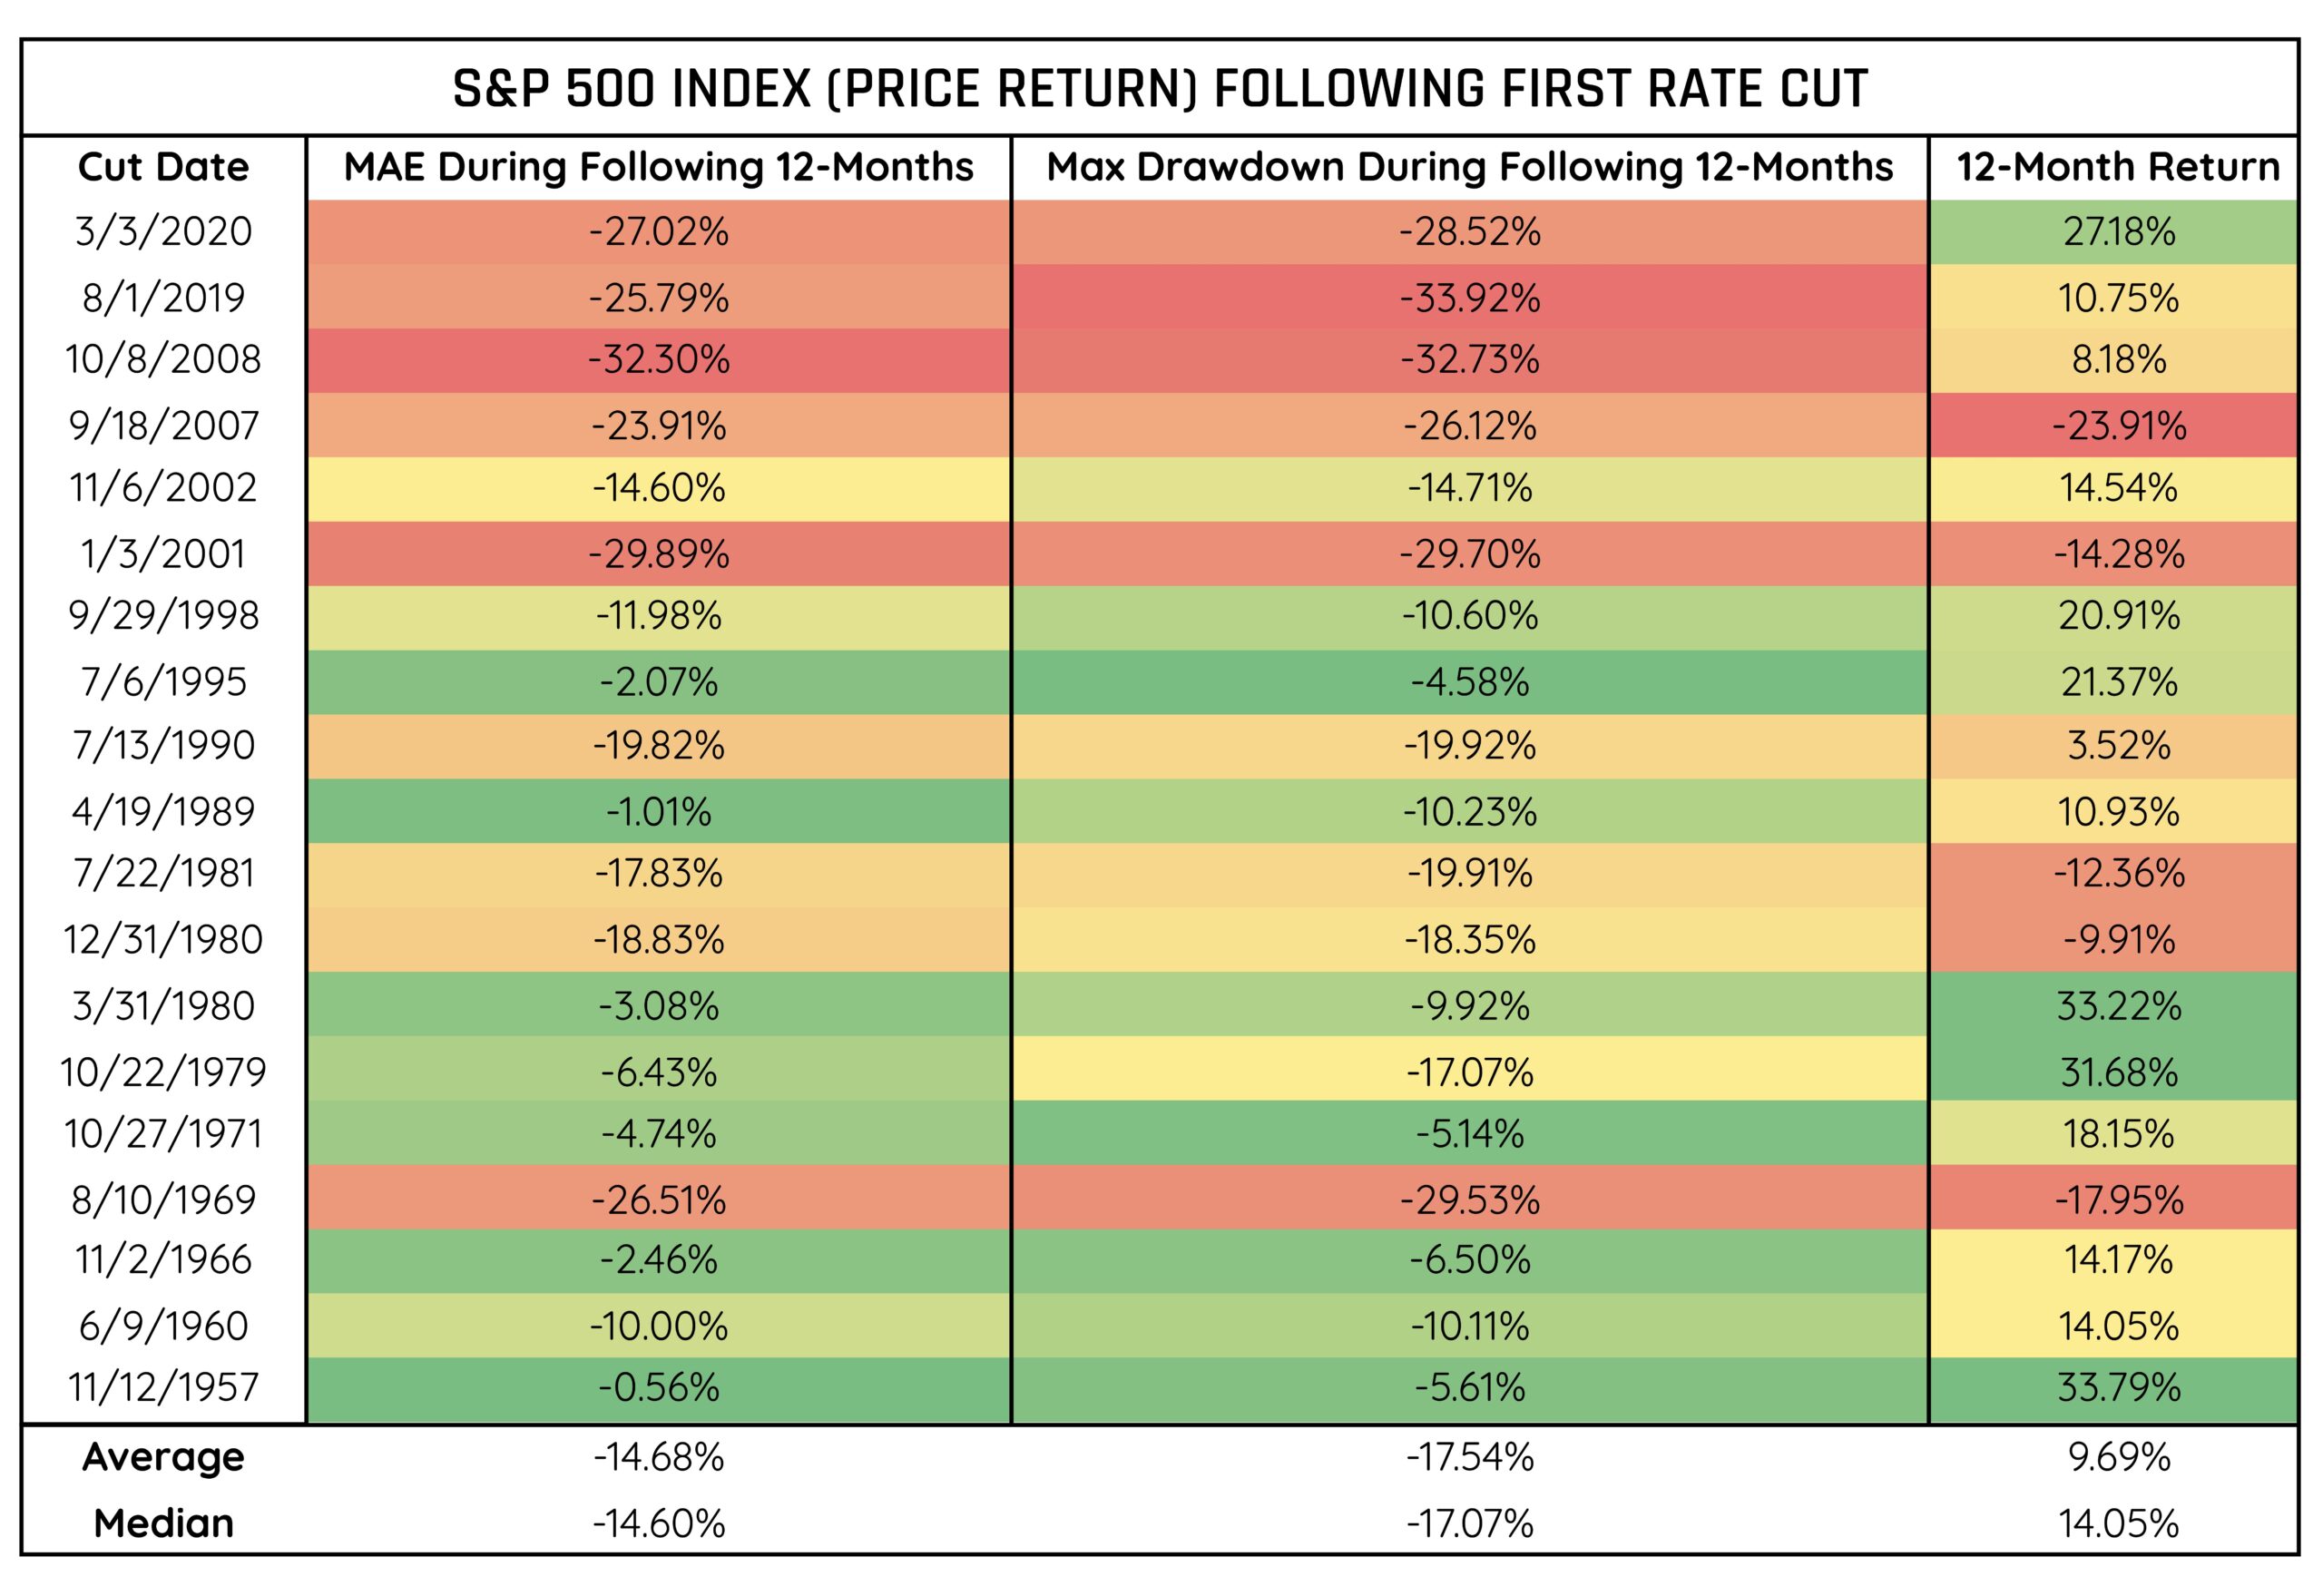
Source: Potomac, Norgate, Y-Charts, Federal Reserve
Maximum Adverse Excursion (MAE) shows us the largest amount by which the index was underwater from the signal date. Maximum Drawdown (MDD) tells us the maximum amount the index declined from its high-water mark during the period.
We Don't Read into Narratives
Data can always be manipulated to support a particular opinion, so we aim to take an objective look and let the data inform our conclusions.
In this case, the Fed's pivot has produced forward 12-month returns that are comparable to any period for the S&P 500 Index (PR). However, the path to get there has shown that, based on history, we should not be surprised to see significant volatility and drawdowns along the way.


