
The Most Important Economic Indicator You’ve Never Heard Of
Famed investor Stanley Druckenmiller once remarked, “The best economist I know is the ISM.” He has long noted that while the stock market follows the economy, the ISM leads it. So, what is the ISM? The Institute for Supply Management (ISM) conducts a massive monthly survey of hundreds of Purchasing Managers, which are the executives responsible for buying the raw materials and supplies that keep companies running.
Because these managers are the first to know if their company is scaling up (growth) or pulling back (trouble), their responses serve as an early indicator for the U.S. economy. These responses are distilled into several indices where a reading above 50 indicates expansion and below 50 indicates contraction.
Manufacturing to Ramp Up
After a year of sluggishness, the U.S. manufacturing sector sprang back to life in January 2026. The headline index jumped unexpectedly from 47.9 in December to 52.6, driven by a massive spike in new orders.
The ISM New Orders Index is a critical leading indicator because new orders today become production and gross domestic product (or GDP) tomorrow (see figure 1). Combined with a 1.5% boost from the federal government reopening, these data lend credibility to Commerce Secretary Howard Lutnick’s recent comments that the $30 trillion U.S. economy could potentially exceed 5% growth in Q1 2026 (versus expectations for 3.0% growth in Q4 2025 which is set to be released a day after this publication).
Figure 1. Real U.S. Gross Domestic Product vs. Weighted ISM New Orders Index*
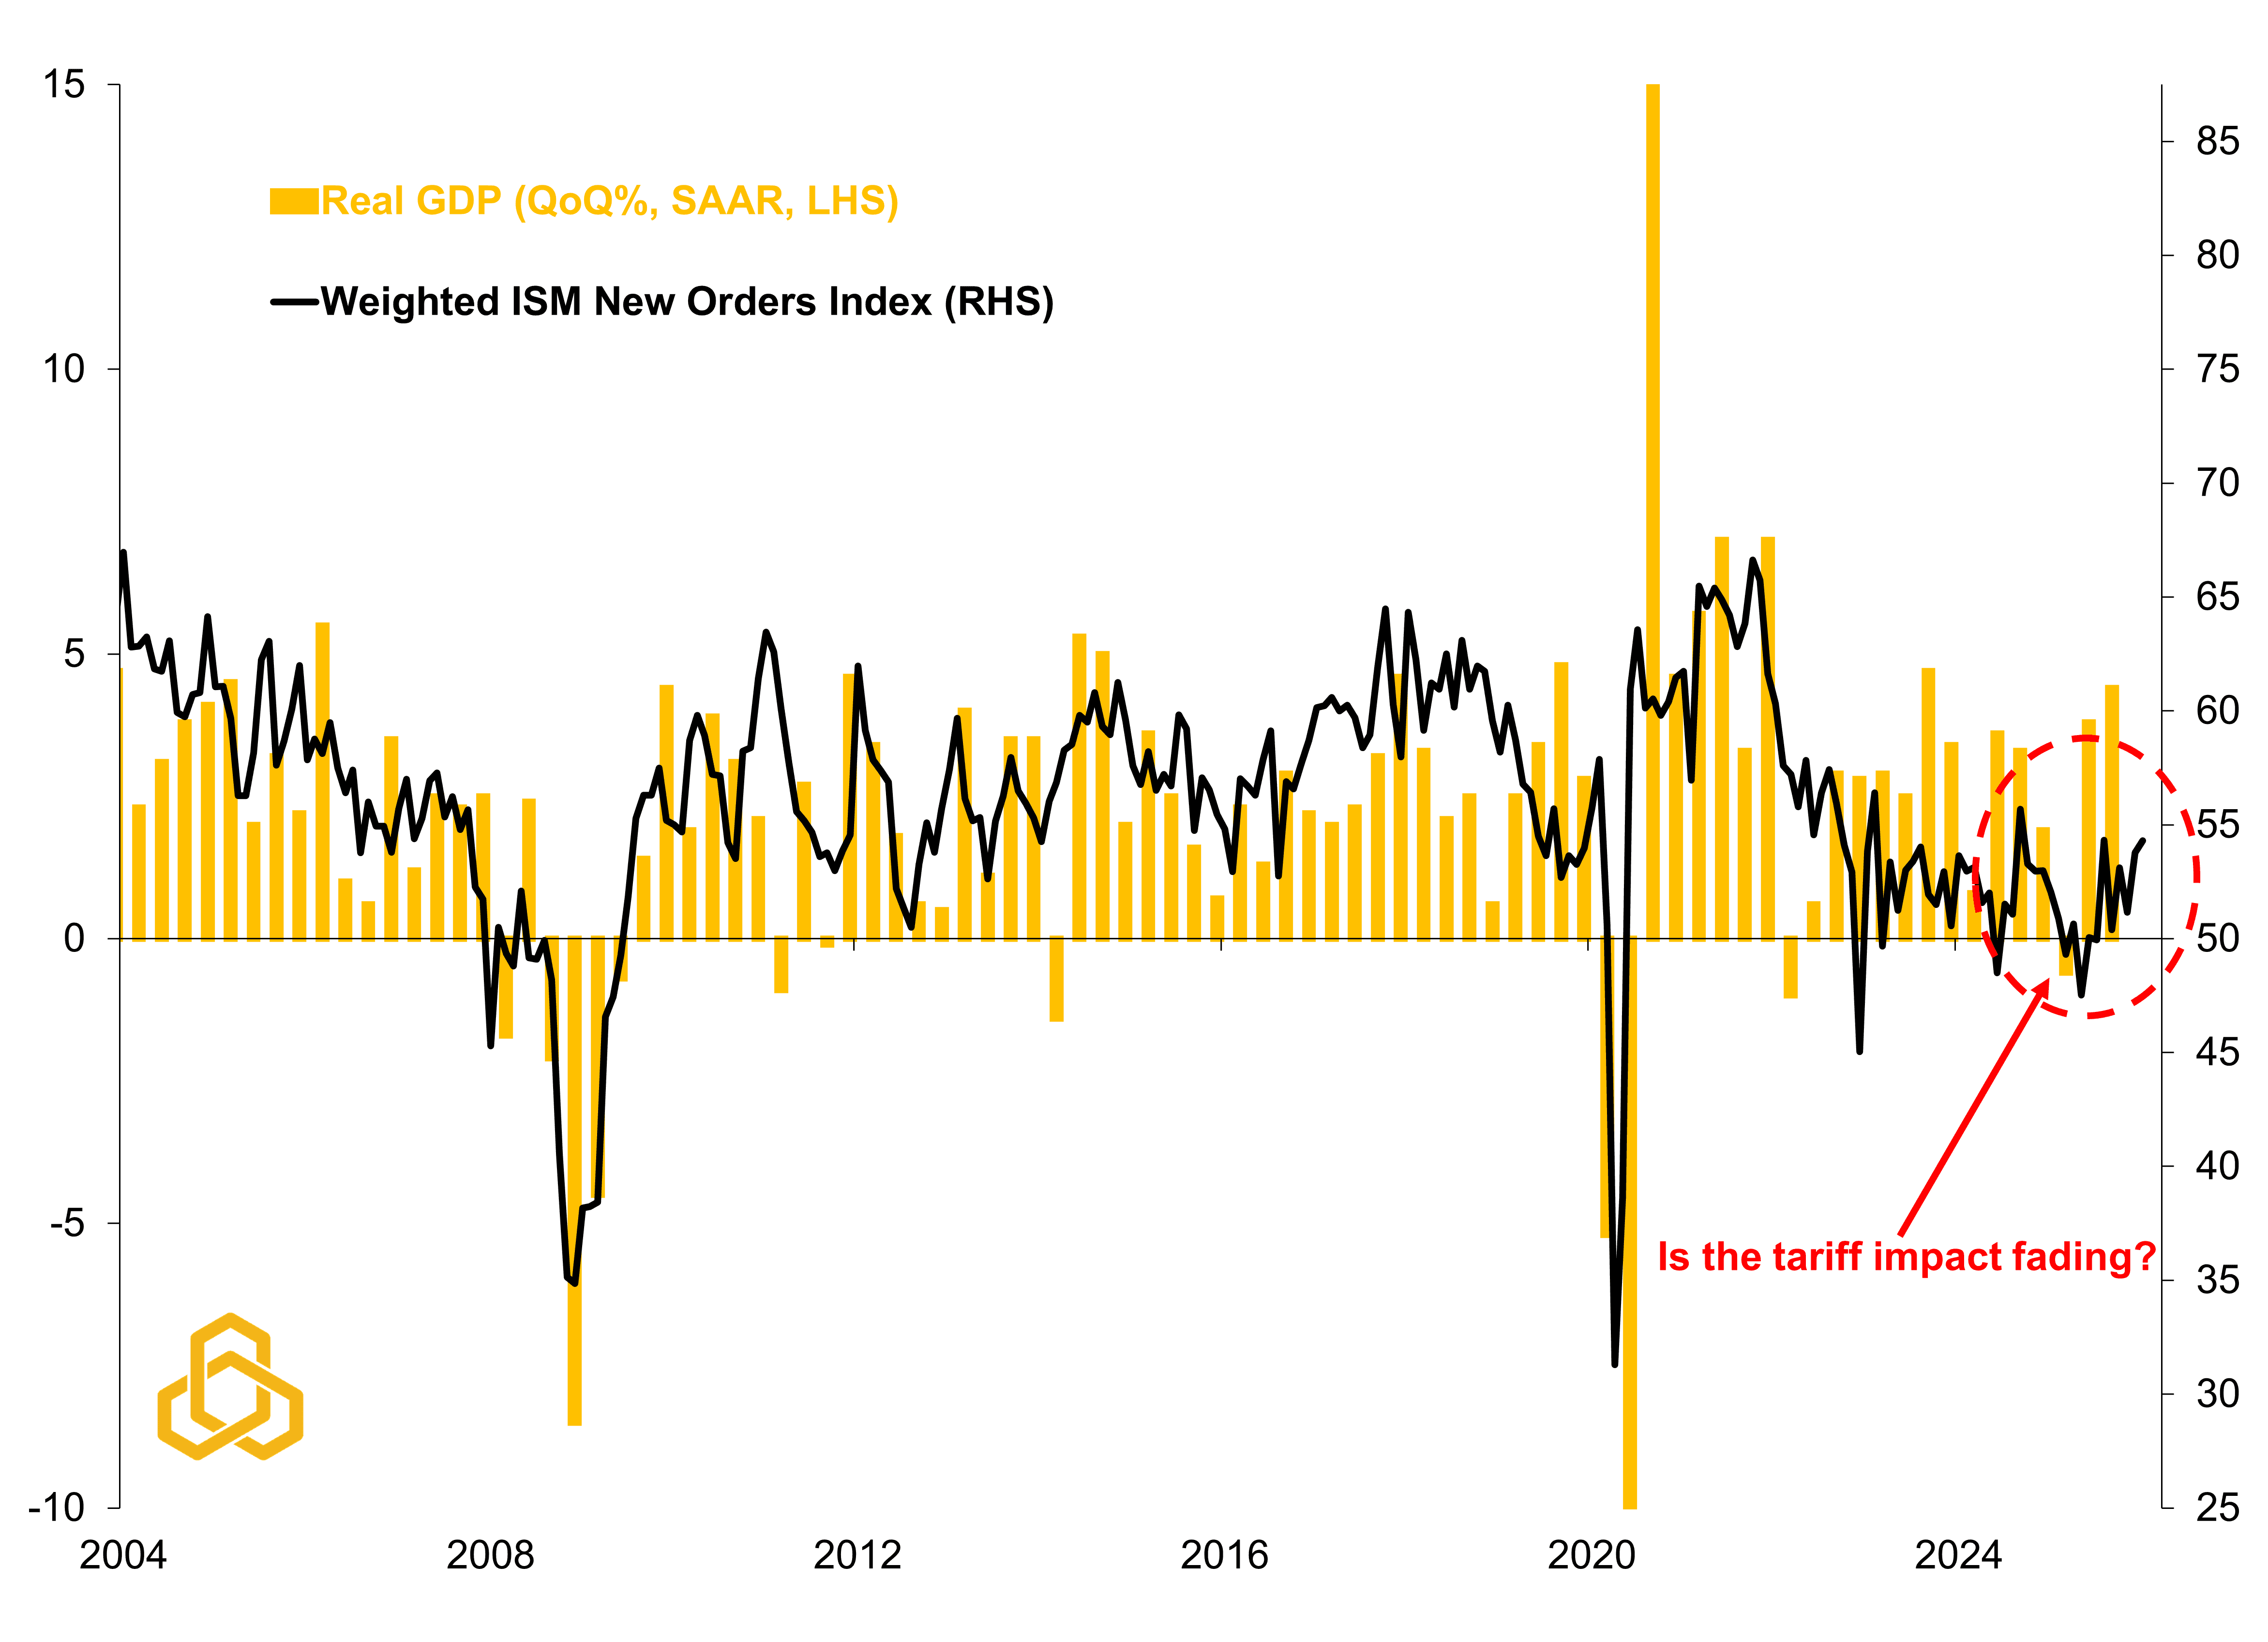
Sources: Bureau of Economic Analysis, Institute for Supply Management, and Potomac. Data as of 3Q 2025 for GDP and January 2026 for ISM. Note 1: The weighted ISM new orders index is 70% services and 30% manufacturing to represent their respective weights in the economy. Note 2: A reading above 50 on ISM index means that the sector is thought to be expanding; below means contracting.
Is this Trend Sustainable?
One month does not make a trend, and it is common to see early year strength in orders due to seasonal restocking after the holidays, but the ratio of new orders to existing inventories suggests this may be a more durable recovery (see figures 2-3).
Figure 2. ISM New Orders Index Average by Month (Jan. 2004 – Jan. 2026)
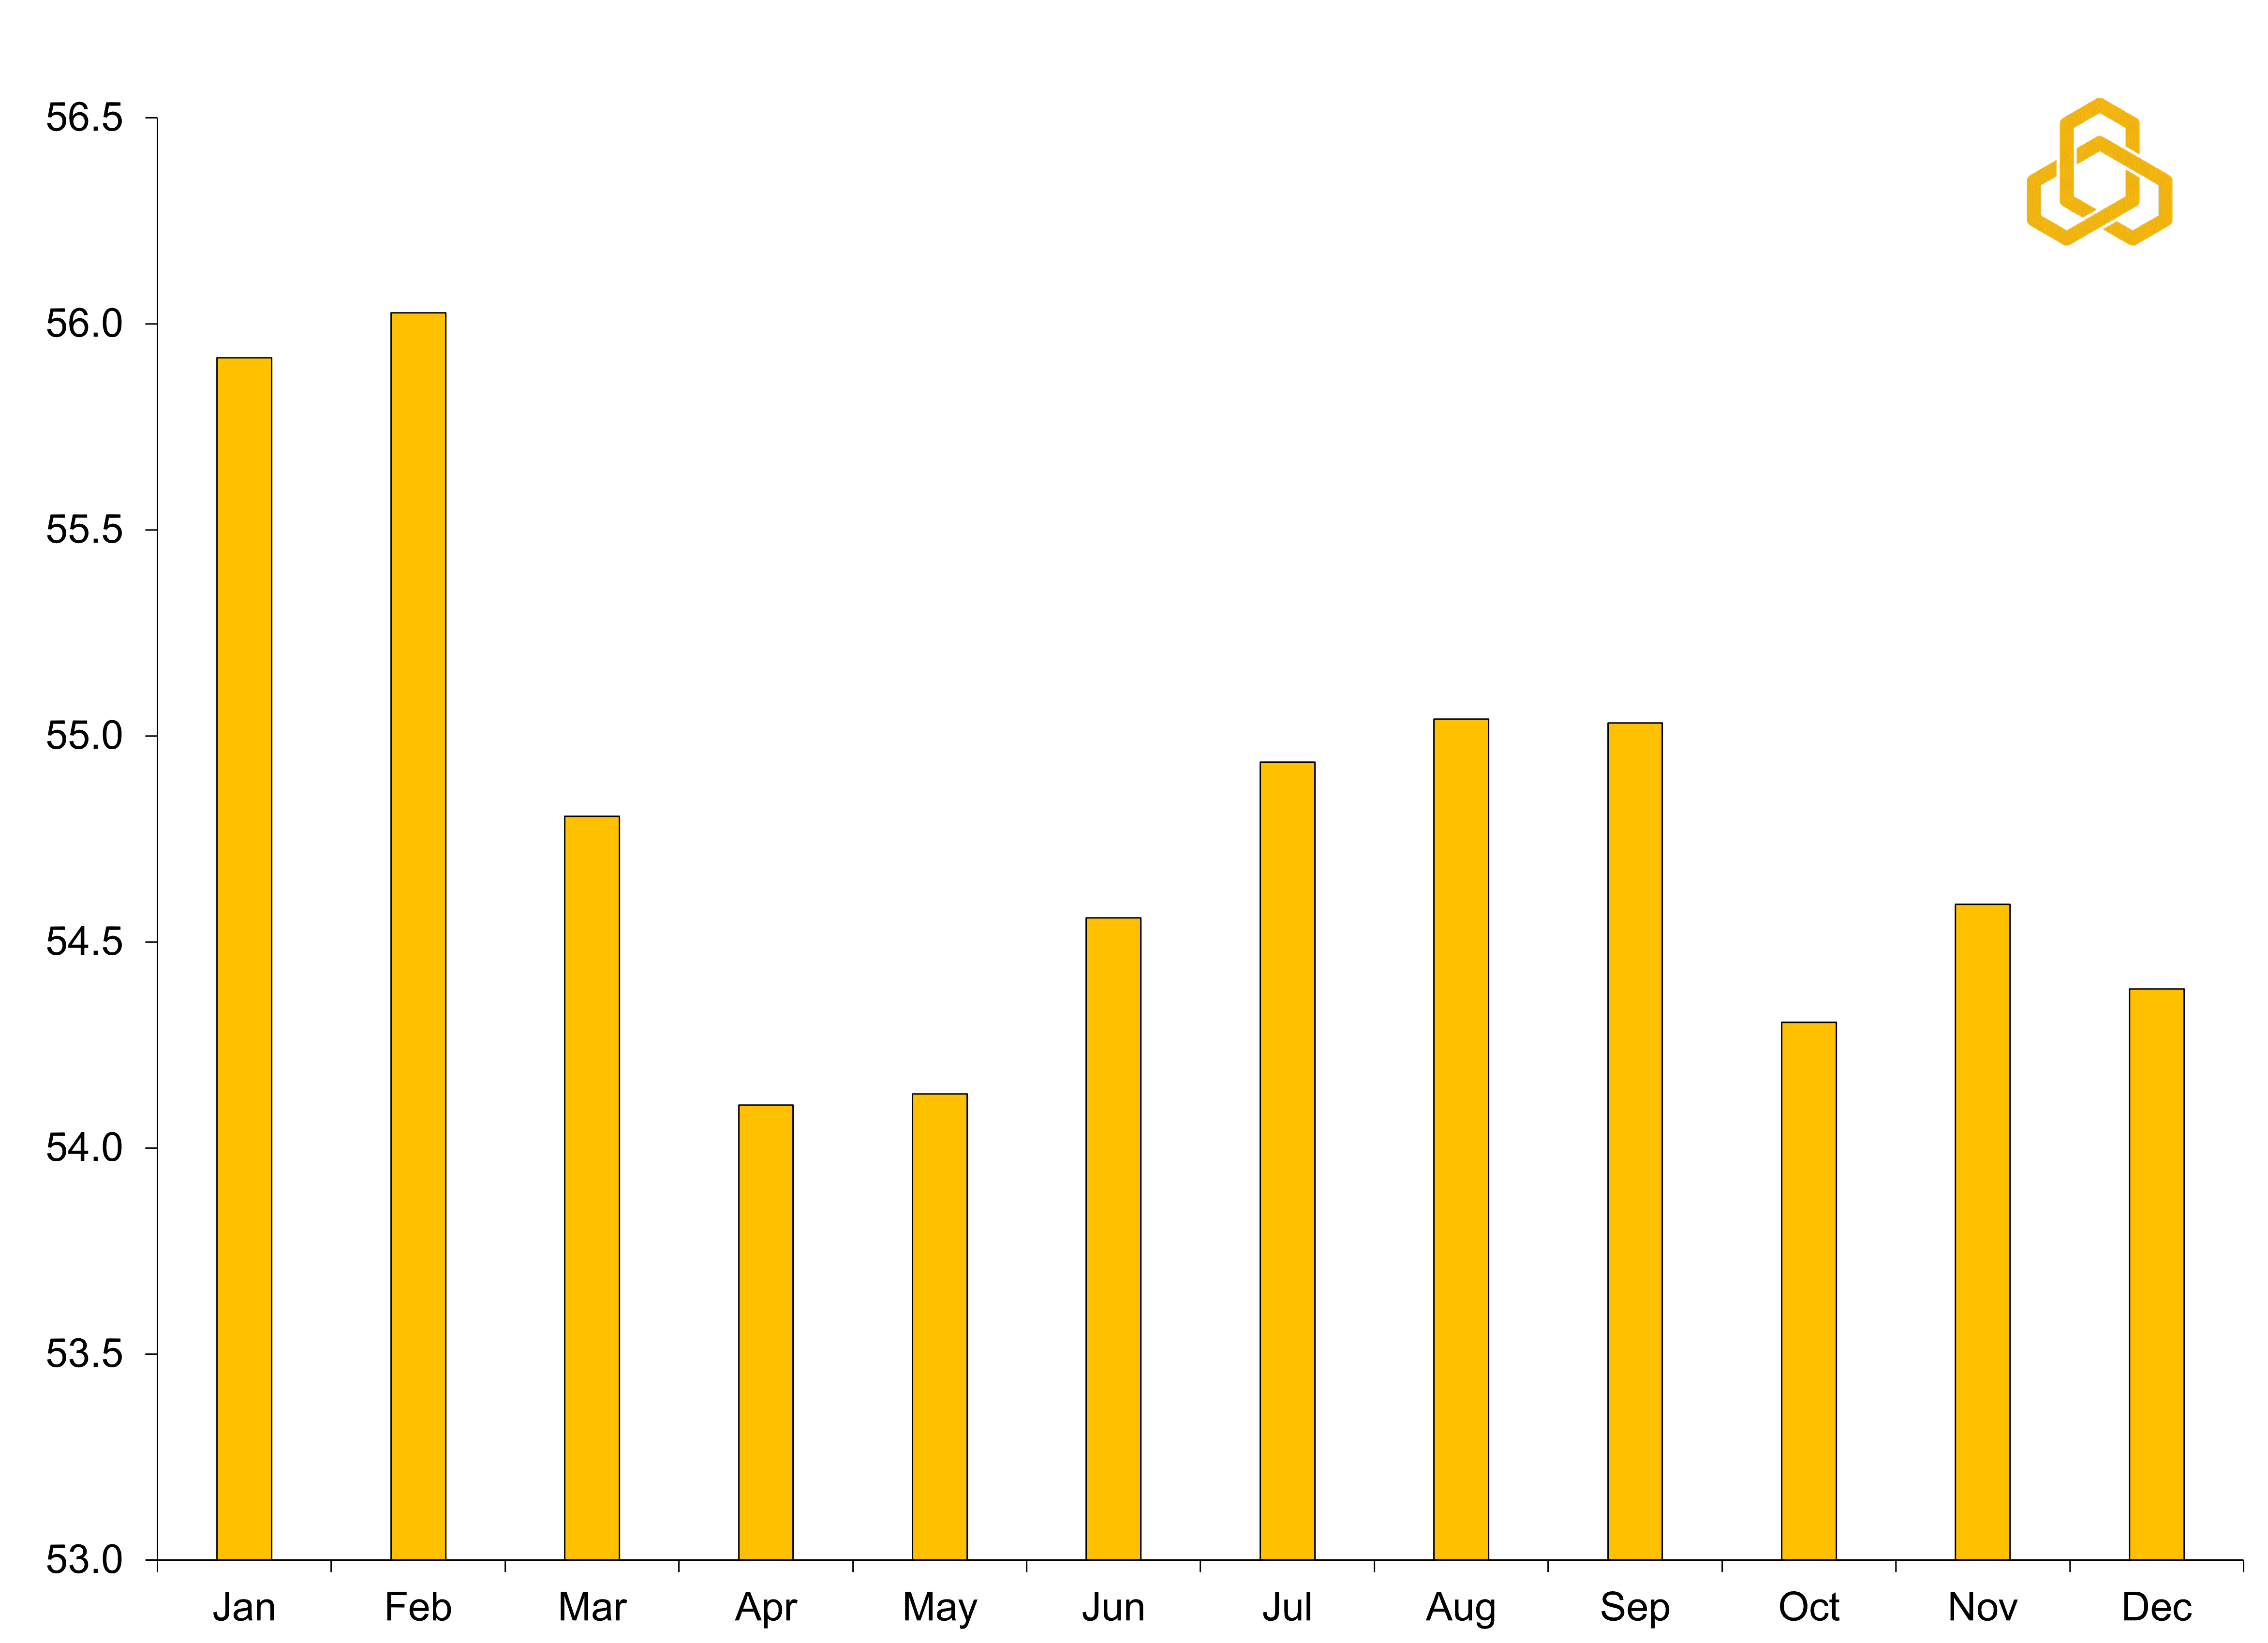
Sources: Institute for Supply Management and Potomac. Data as of January 2026. Note: A reading of above 50 on ISM new orders means that orders are thought to be expanding; below means contracting.
Figure 3. ISM Manufacturing Index vs. New Orders Less Inventories
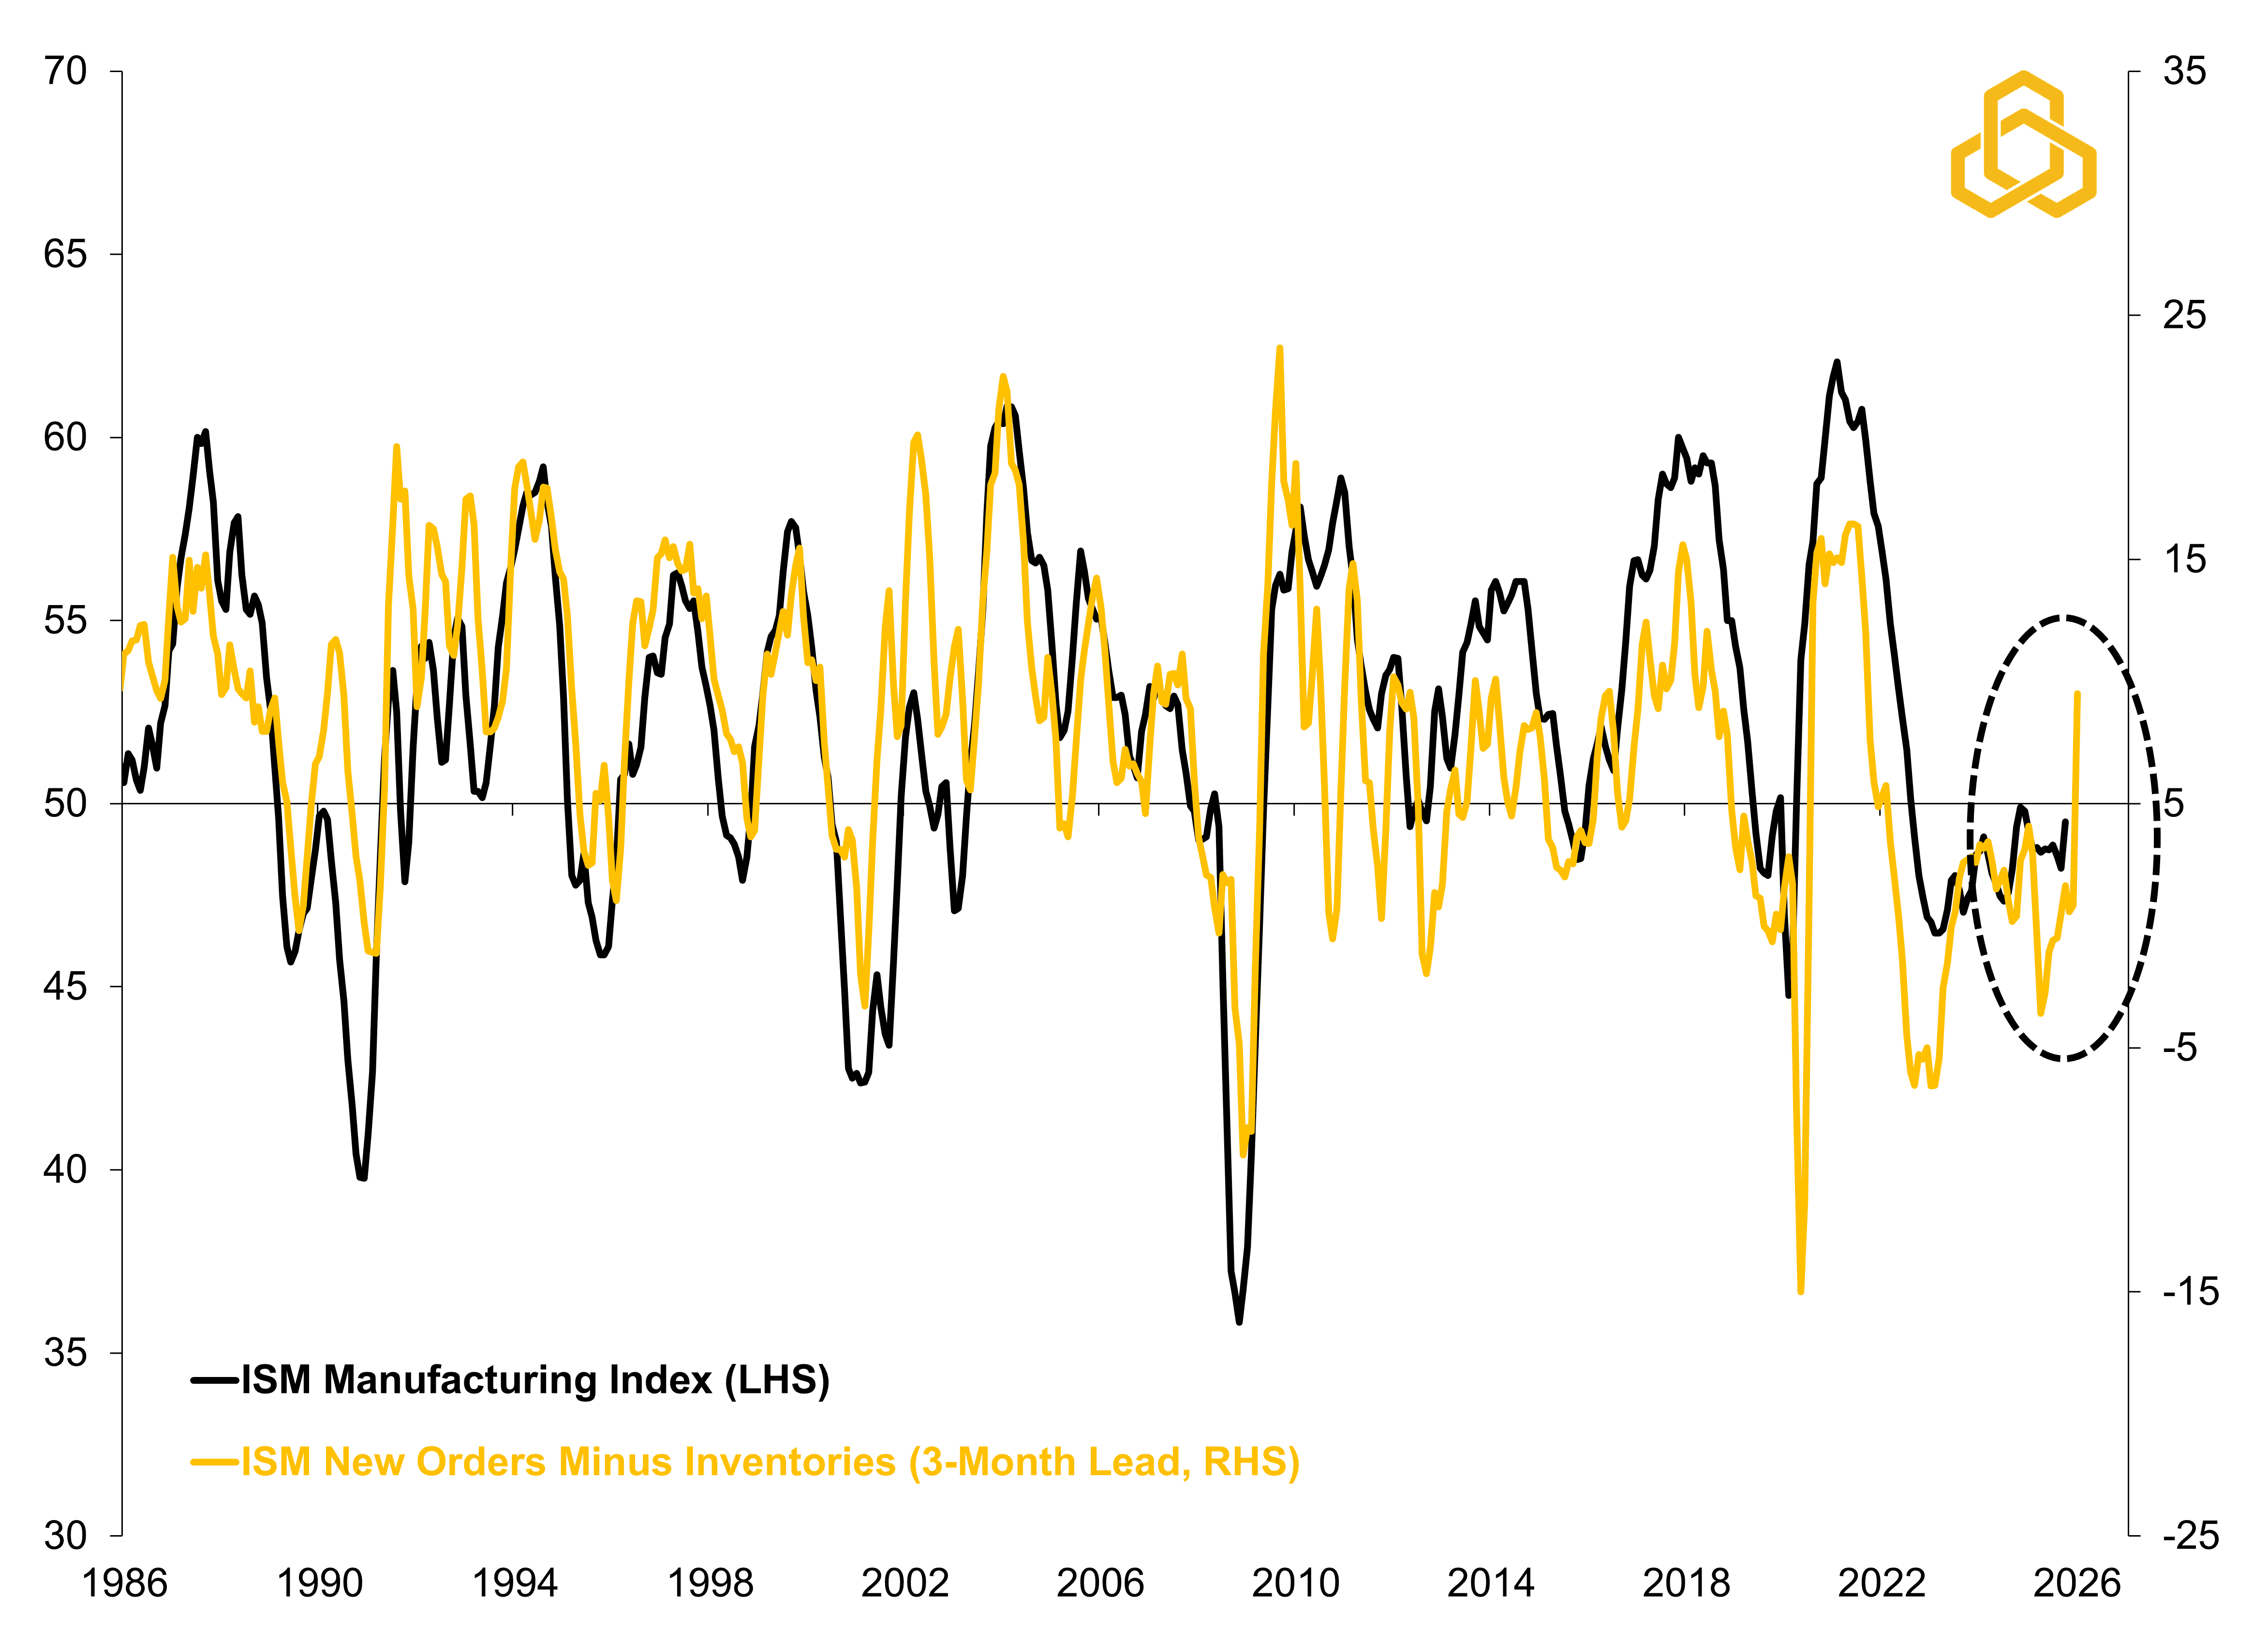
Sources: Institute for Supply Management and Potomac. Data as of January 2026. Note 1: Both time series are three month moving averages, but the last data point for new orders less inventories is strictly January 2026. Note 2: A reading above 50 on ISM index means that the sector is thought to be expanding; below means contracting.
Furthermore, "prices paid" for inputs are trending lower. This suggests that the initial shock of the Liberation Day tariffs (April 2025) may gradually fade (see figure 4). As these lower costs move through the supply chain alongside cooling home prices, we should see inflation moderate further in 2026. This shift is likely to give a Kevin Warsh-led Fed (see last week’s note) the "green light" to cut rates at least once or twice more this year.
Figure 4. Weighted ISM Prices Paid* vs. Inflation
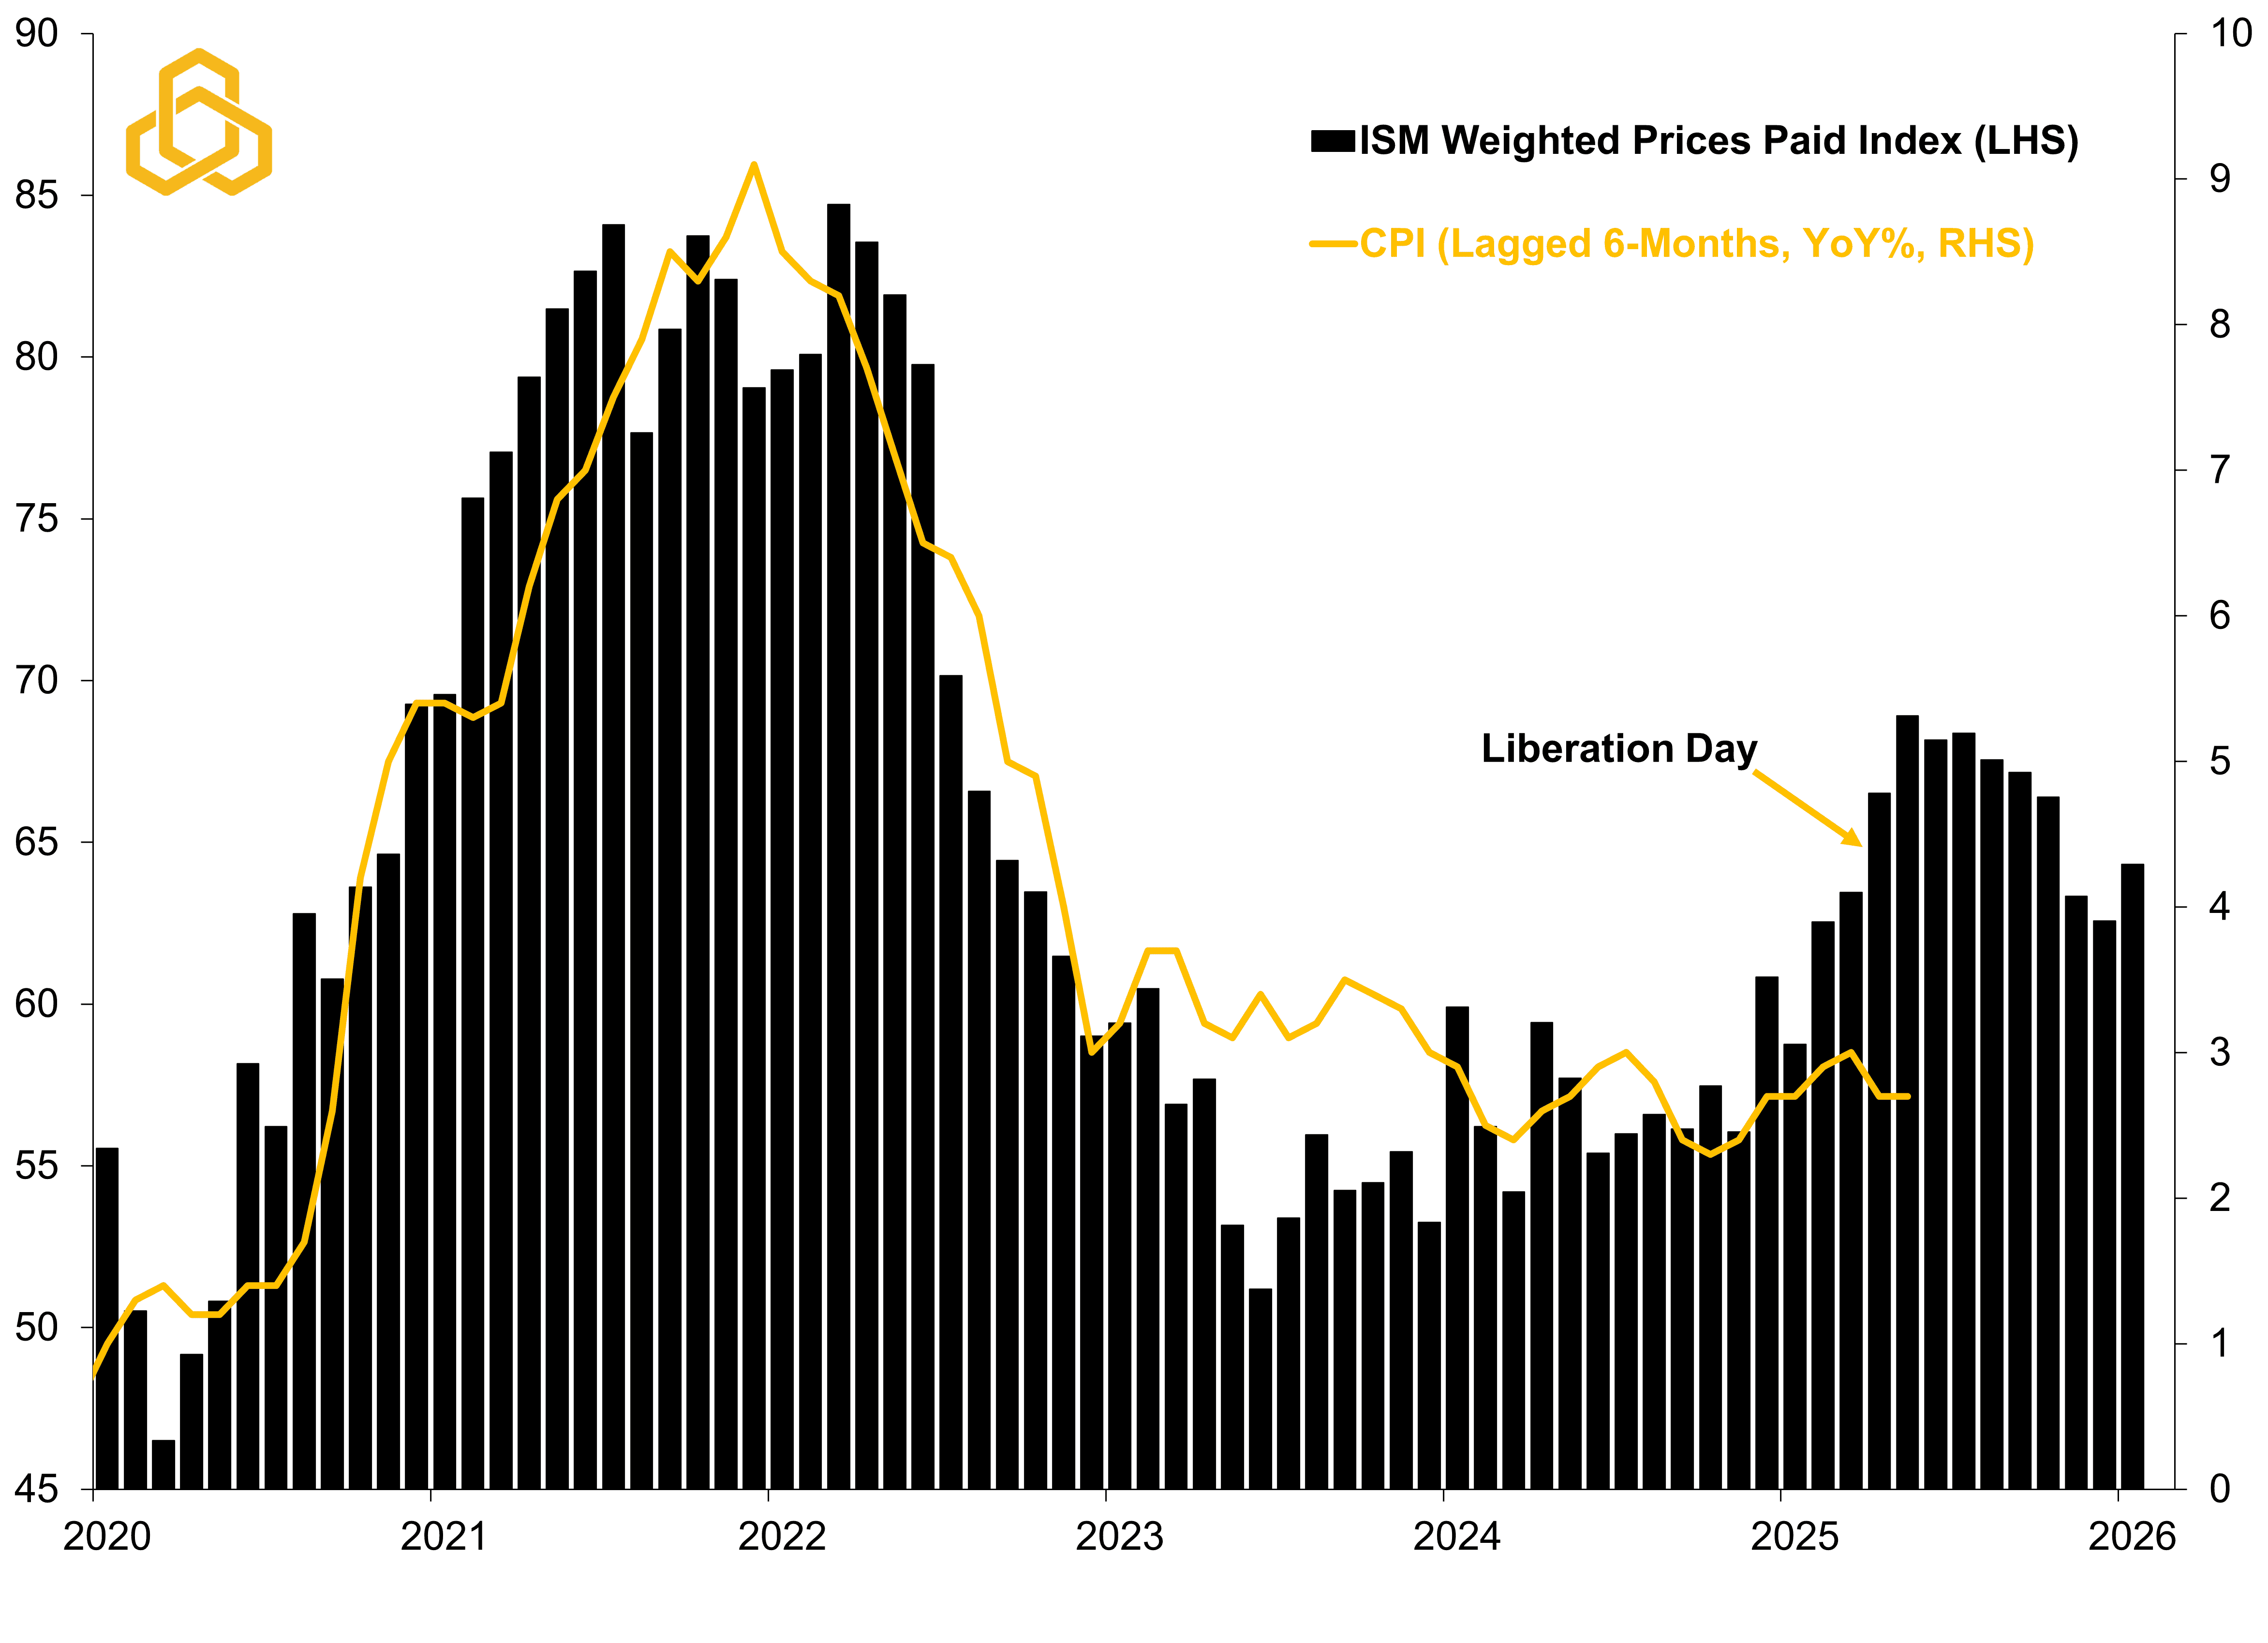
Sources: Institute for Supply Management, Bureau of Labor Statistics and Potomac. Data as of December 2026 for CPI and January 2026 for ISM. Note 1: The weighted ISM new orders index is 70% services and 30% manufacturing to represent their respective weights in the economy. Note 2: A reading above 50 on ISM indices means that the sector is thought to be expanding; below means contracting.
Signs of Life in the Labor Market
Combined, these forces may create tangible tailwinds. For the first time since 2024, the manufacturing sector added jobs – rising by 5,000 – while the broader economy added a surprising 130,000 positions in January 2026. To put this in perspective, monthly job gains averaged a meager 15,000 throughout 2025.
The unemployment rate ticked down from 4.4% to 4.3%, aligning with a recent recovery in overall job postings (see figure 5). Particularly encouraging is the three-month improvement in Temporary Help Services. As the sector most sensitive to economic shifts, this "canary in the coal mine" has not shown such consistent growth since the stimulus-fueled peak of late 2021.
While these figures are promising, it is far from an “all-clear." Early data suggest payrolls could moderate a bit in February, and the breadth of gains remains narrow with Health Care and Social Assistance employment accounting for 124,000 of the 172,000 private sector jobs added during the month. Excluding this category, the private sector lost 278,000 jobs in 2025.
Figure 5. U.S. Unemployment Rate vs. Indeed’s Job Postings Index
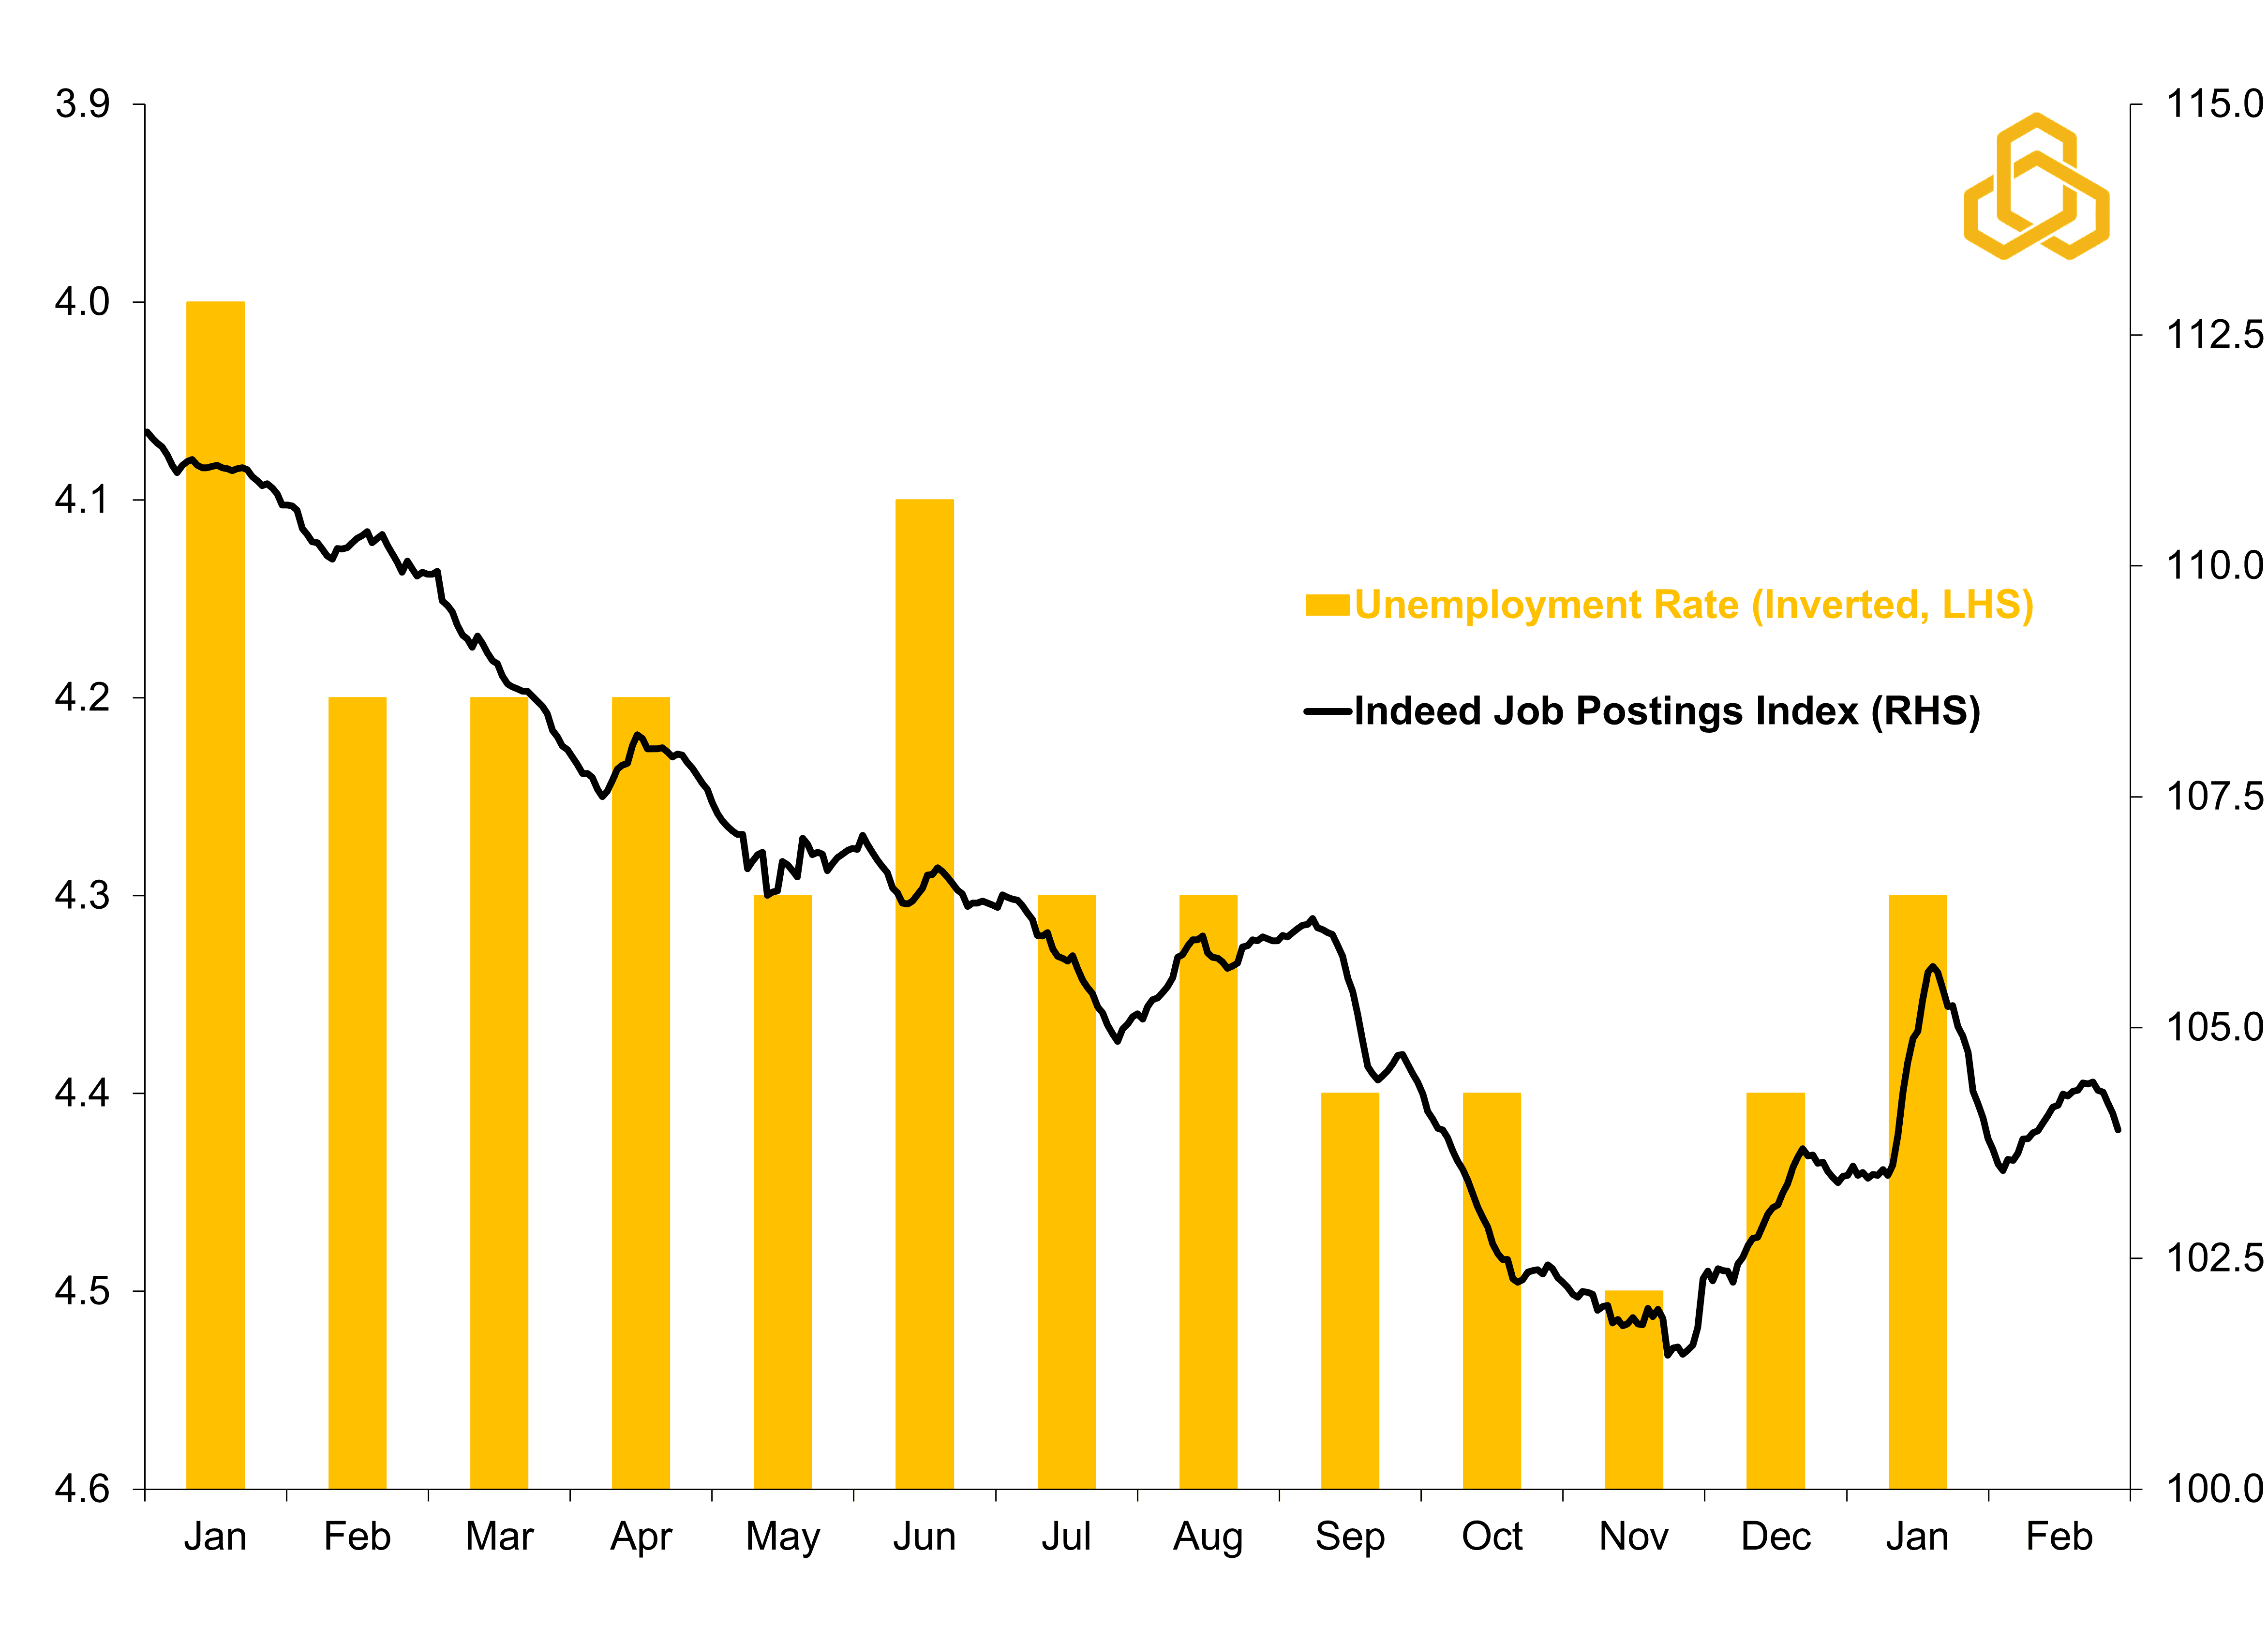
Sources: Bureau of Labor Statistics, Indeed.com, Bloomberg, L.P., and Potomac. Data as of January 2026 for the unemployment rate; January 31, 2026 for job postings.
The Bottom Line
The U.S. economy is entering 2026 on more solid footing than many anticipated. However, the critical question remains: Will this growth translate into a better labor market for most Americans?
If growth does not produce broad-based employment, it risks becoming a "tree falling in a forest" with no one around to hear it. This disconnect is evident in consumer sentiment with the percentage of workers expecting to lose their jobs in the next five years currently hovering just shy of its Global Financial Crisis peak (see figure 6). Driven by the rapid integration of Artificial Intelligence, worker anxiety remains extremely high. For the average American, the recovery will not feel “great” until the "Help Wanted" signs appear for everyone…not just a select few.
Figure 6. Probability of Losing Job During the Next 5 Years vs. Recession
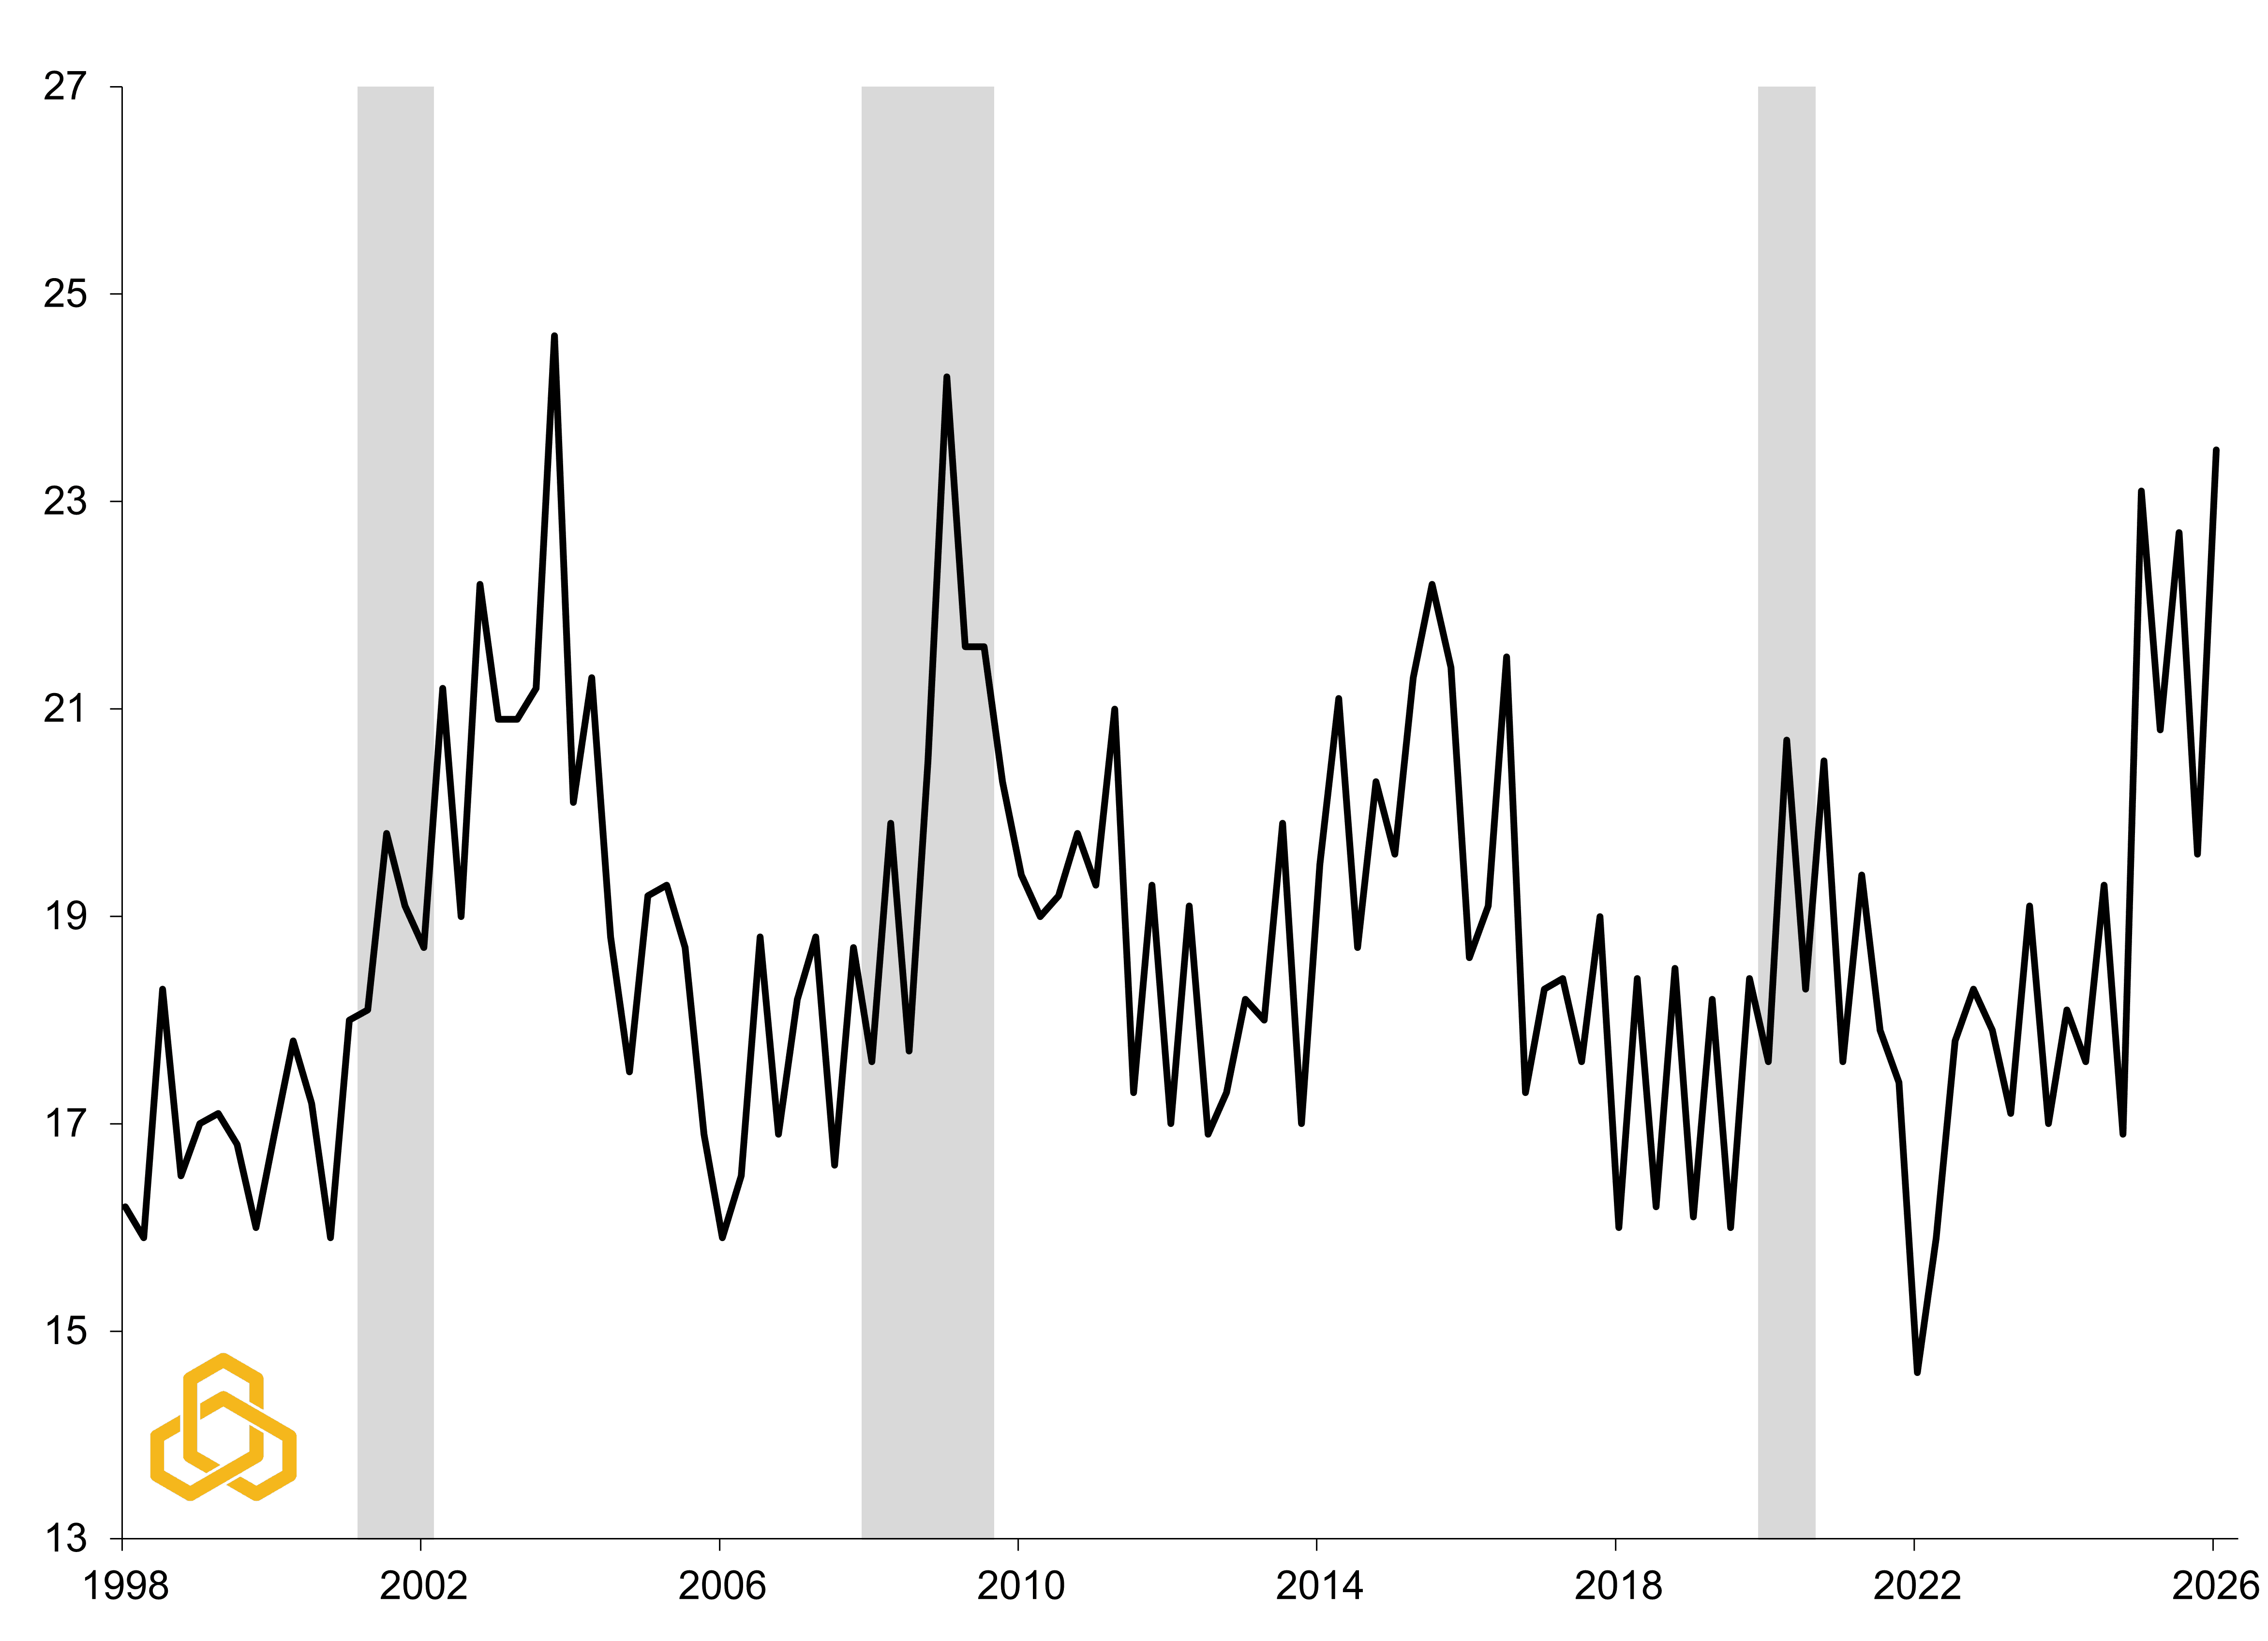
Sources: University of Michigan, Bloomberg, L.P., and Potomac. Note: Shaded bars represent periods of U.S. recession.
PFM-309-20260218


