
The Only Claims that Matter
Recession fears have become a constant feature of media headlines. Each new shock, whether geopolitical, inflationary, or policy-driven, quickly raises the same question: is the U.S. economy headed toward a downturn (see figure 1)?
It is a familiar pattern. This is now the fifth straight year that recession fears have spiked even though the U.S. economy has only been in a recession for 3 months out of the last 17 years.
Figure 1. Google Trends for U.S. Recession vs. Actual Periods of Recession
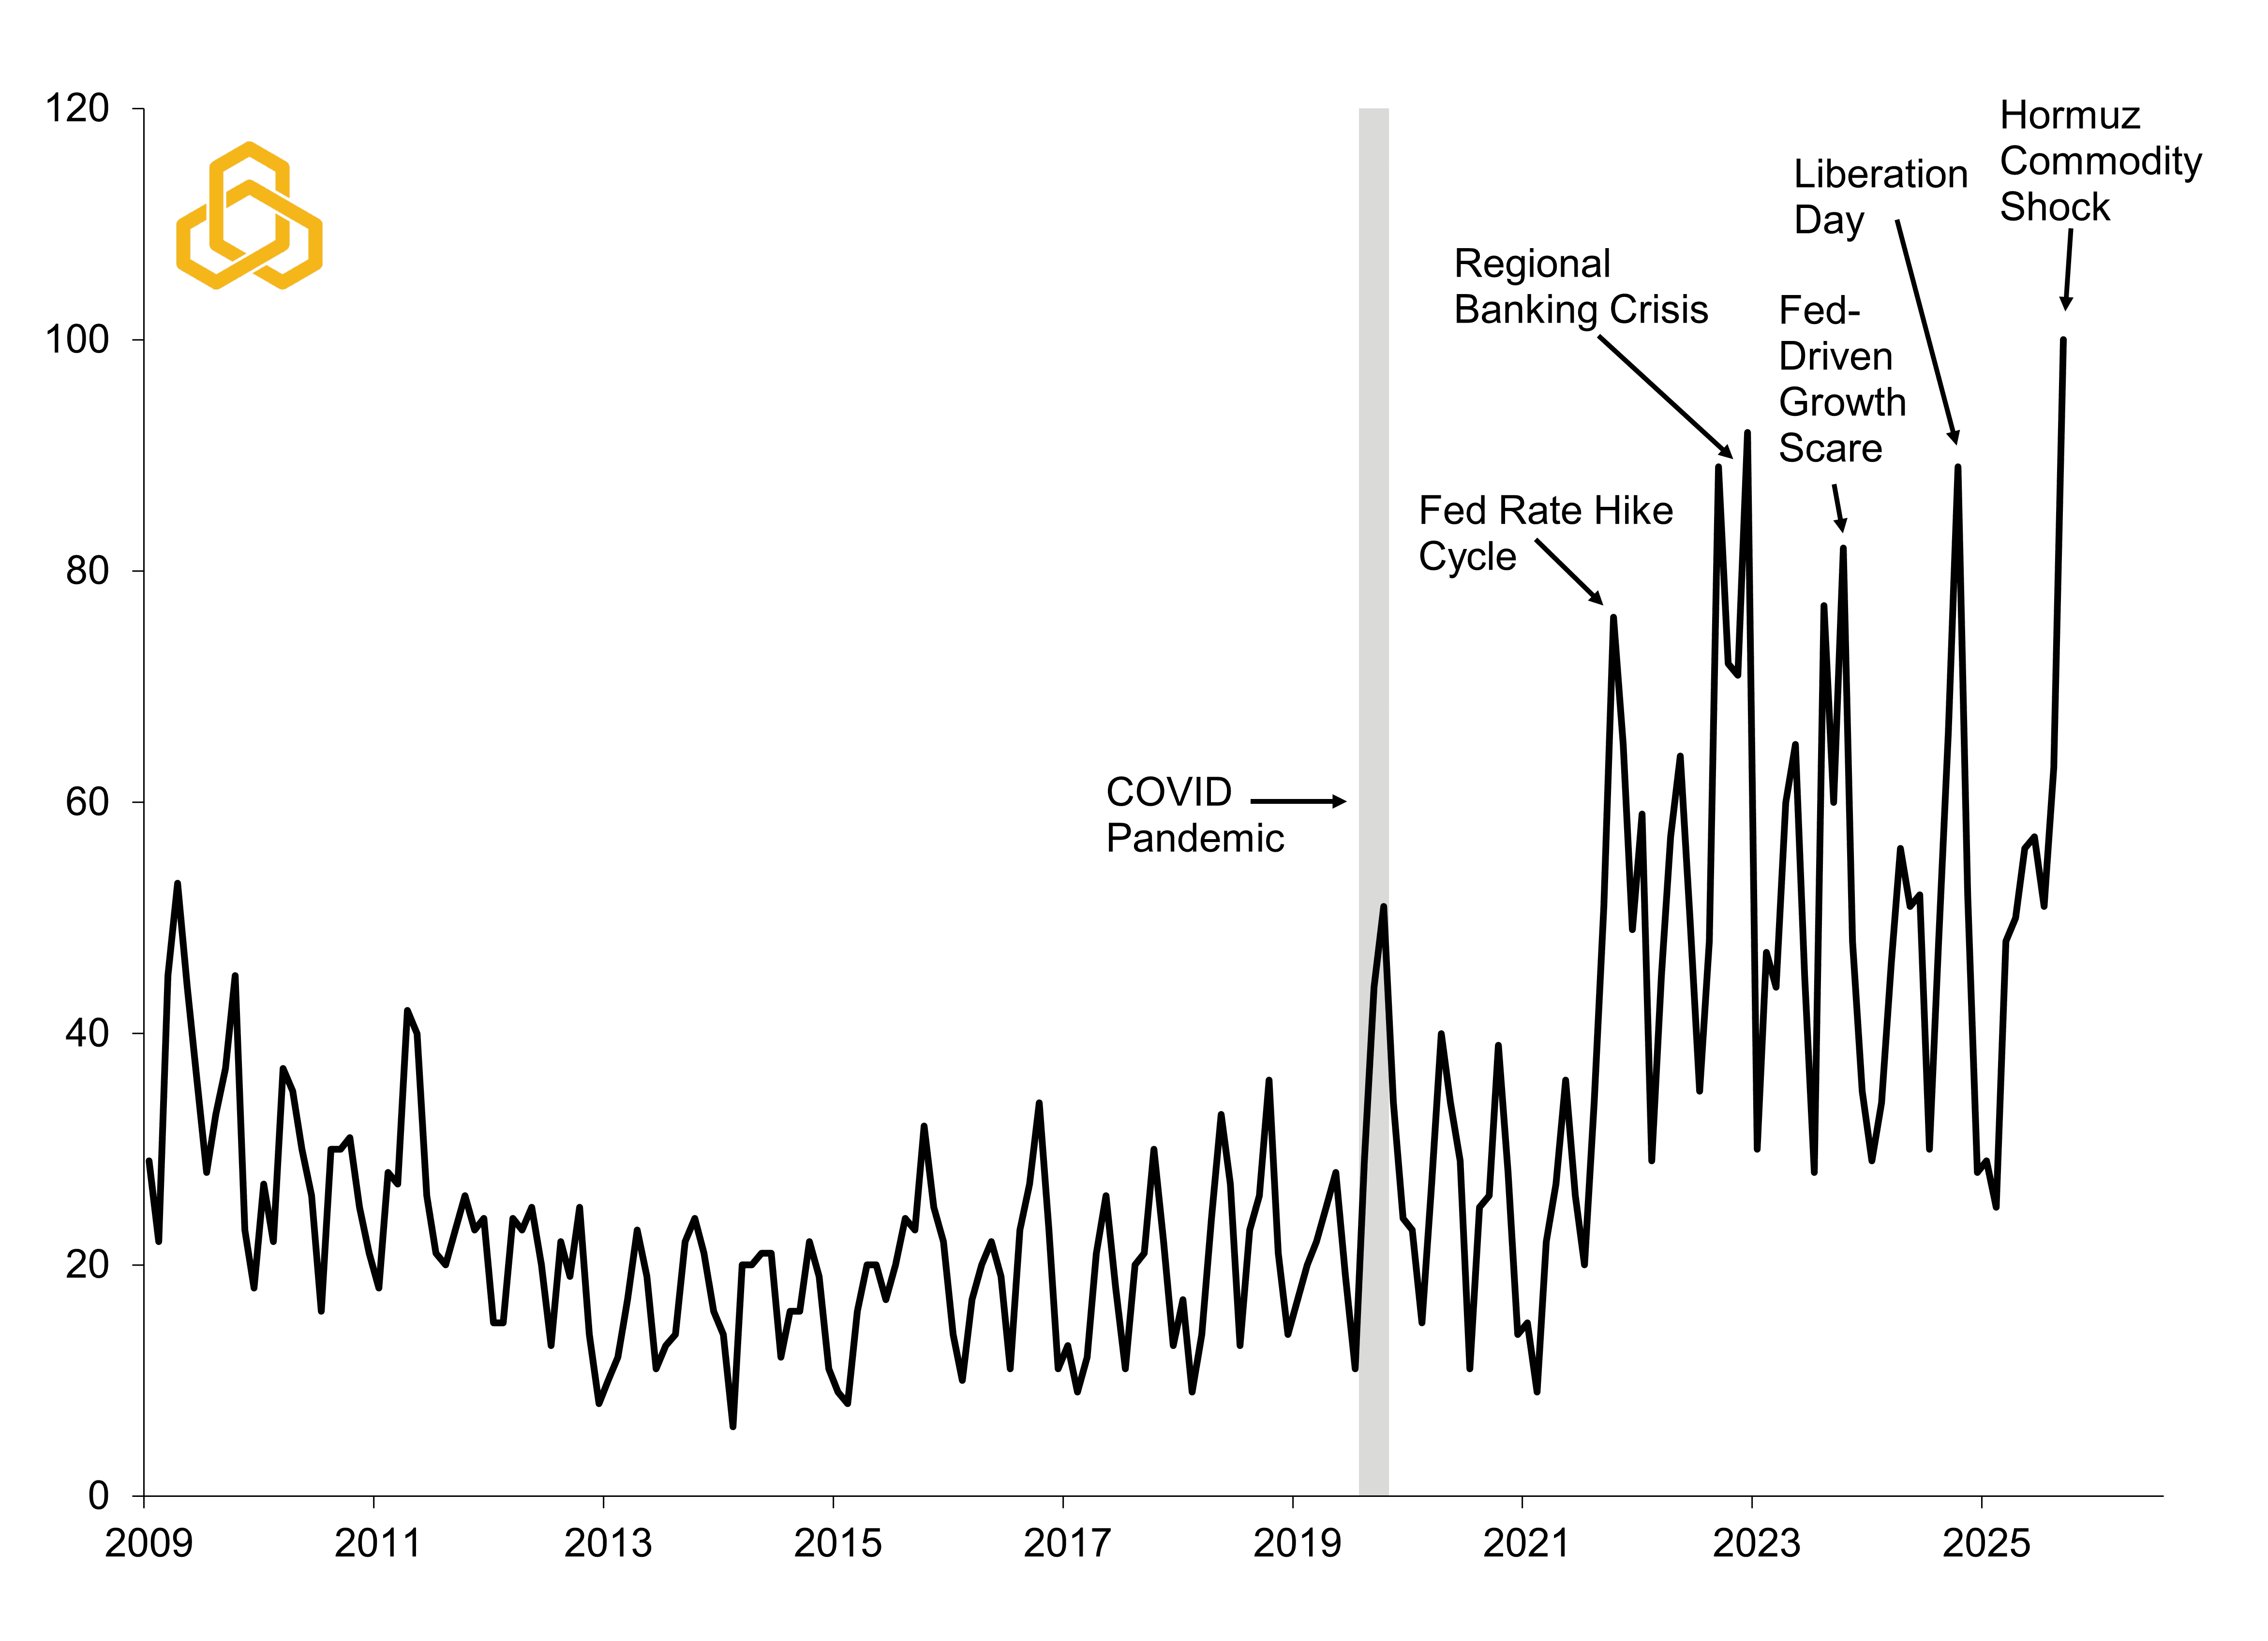
Sources: Google Trends and Potomac. Data as of April 14, 2026. Note 1: Data are indexed to 100, representing peak search interest over the selected time period. Values reflect relative search intensity, not absolute search volume. Note 2: Shaded regions denote periods of U.S. recession.
That does not mean investors or policymakers should stop trying to read the economic tea leaves. If anything, history suggests the opposite. Policymakers have gotten faster and more aggressive, with the Federal Reserve cutting rates sooner and the government often stepping in to keep slowdowns from turning into deeper recessions.
While the media tends to amplify recession fears, the data tell a very different story. The frequency of recessions has declined steadily over the past half century. Since 1970, the U.S. economy has gone from being in recession roughly 21% of the time between 1970 and 1990 to just 1.5% of the time following the Global Financial Crisis (see figure 2).
Figure 2. Time the U.S. Economy Has Been in Recession by Select Timeframe
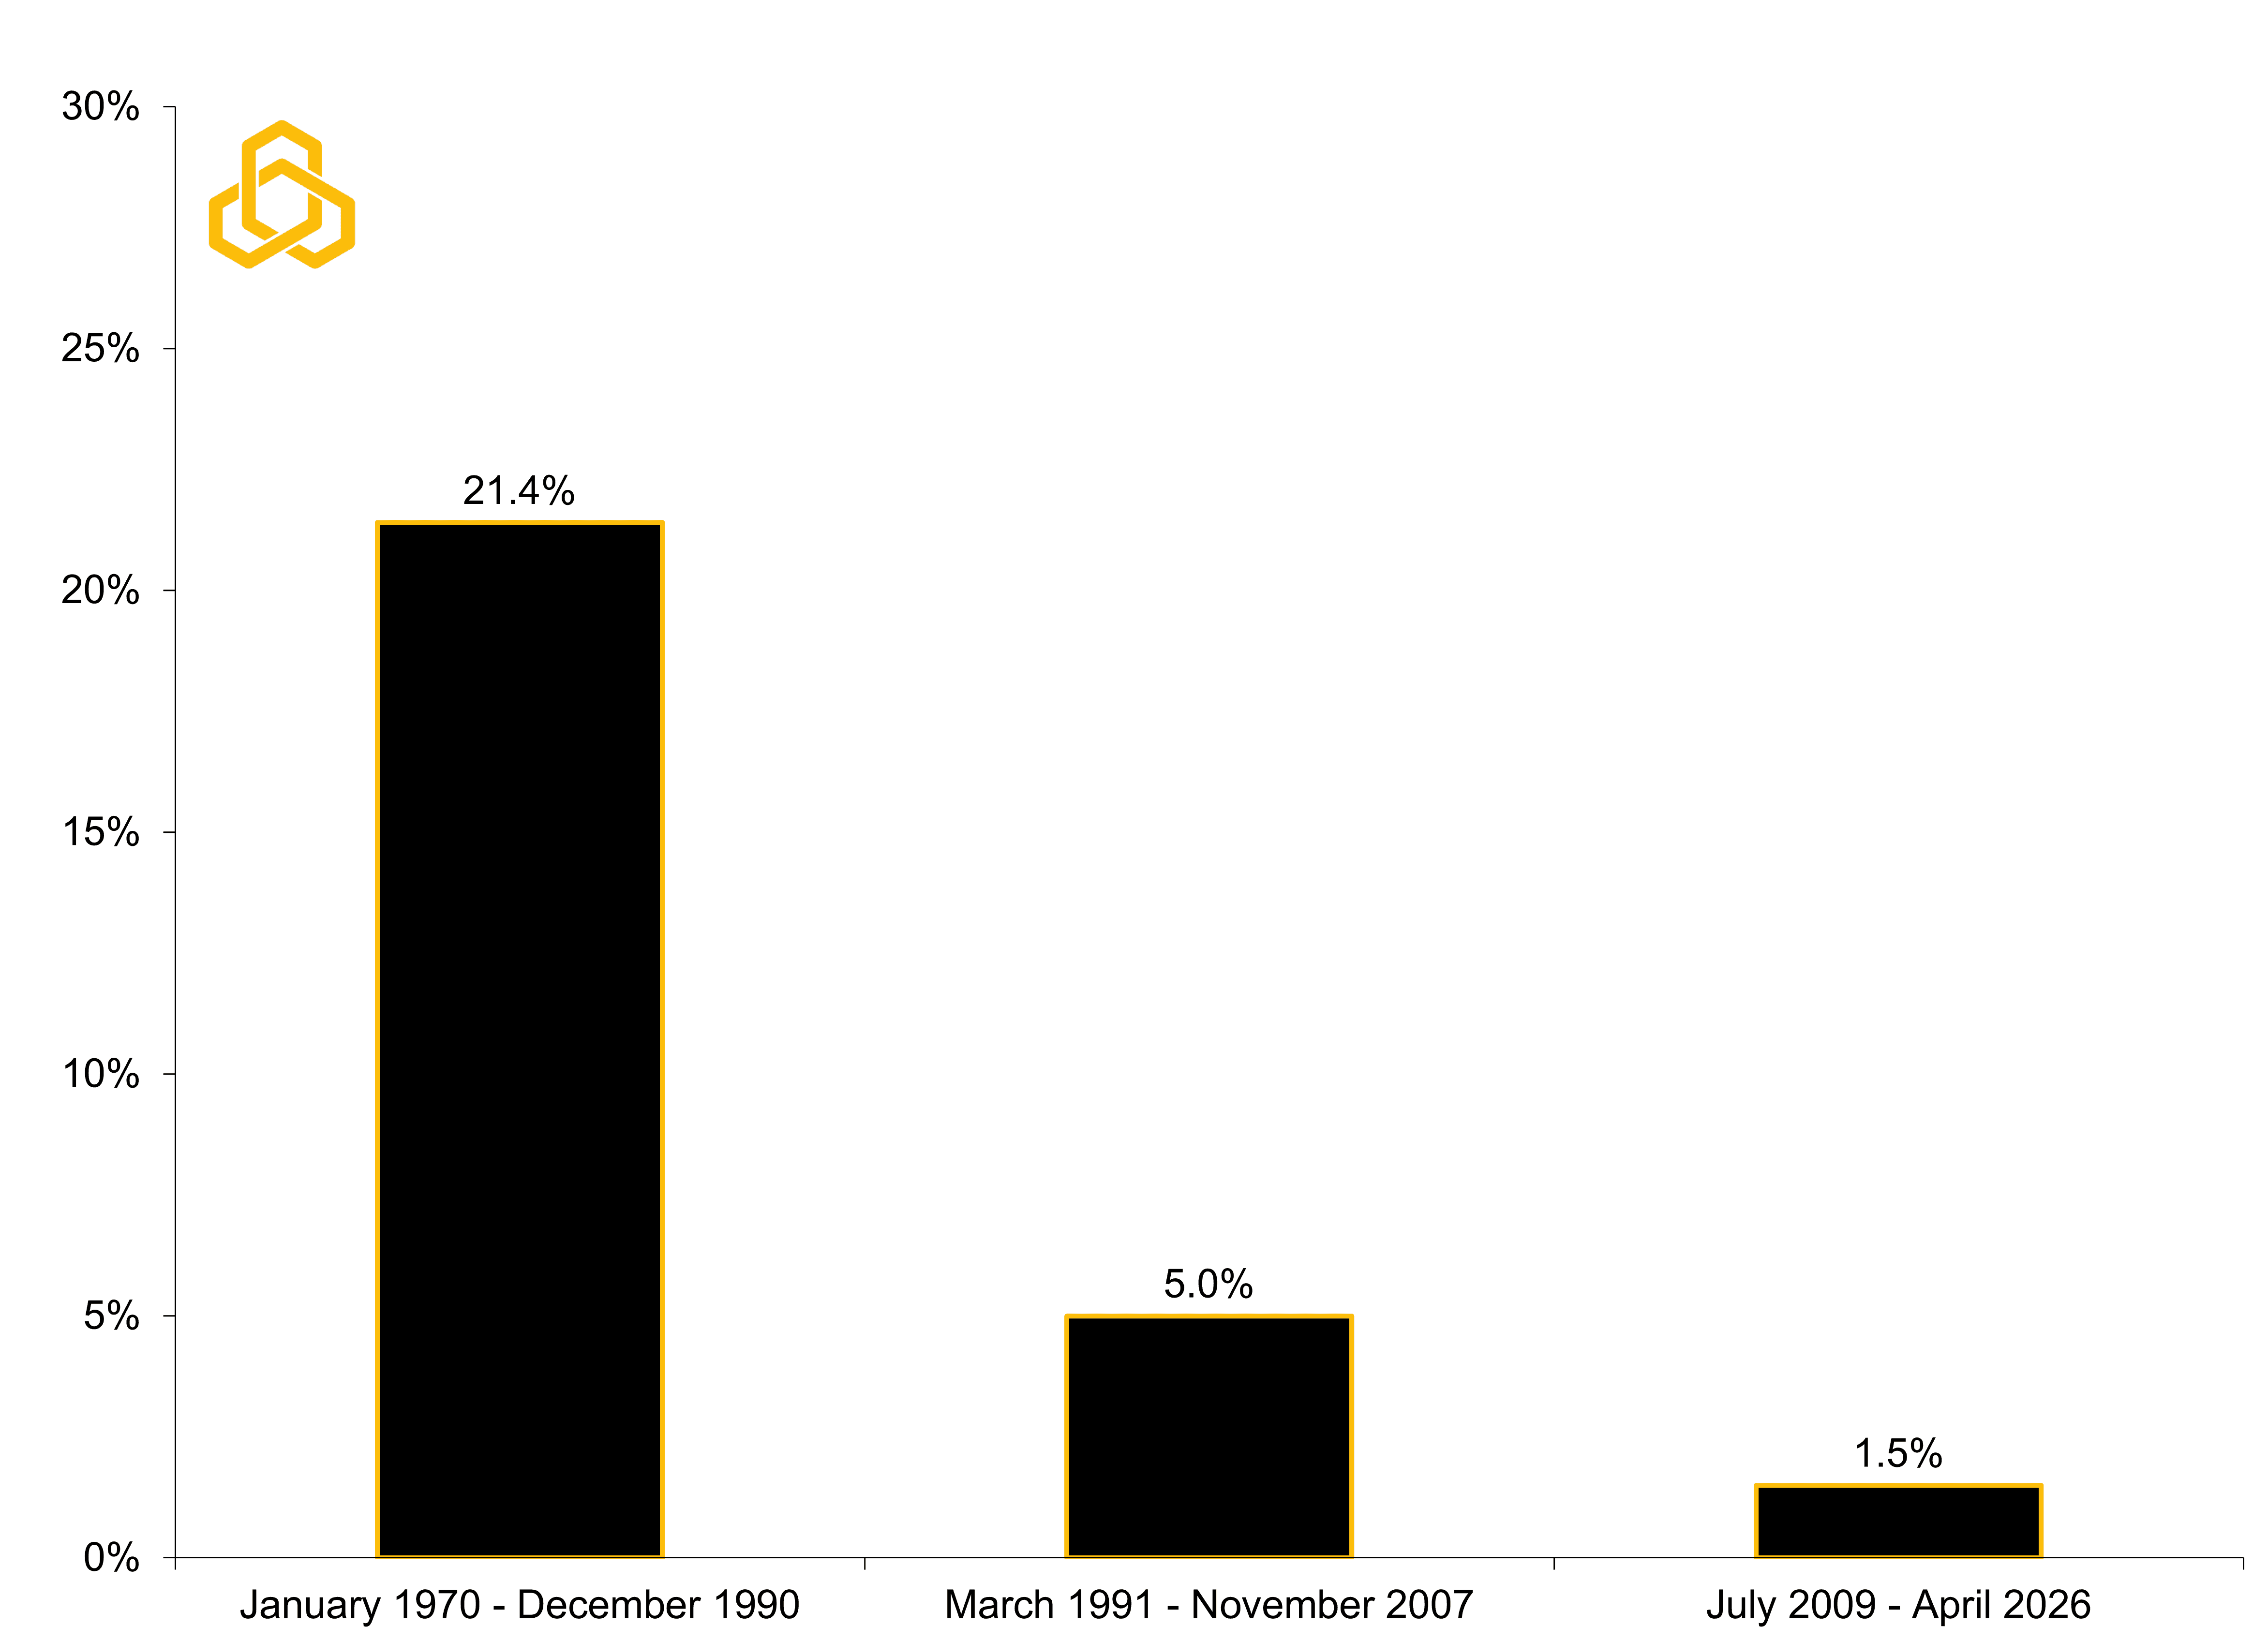
Sources: National Bureau of Economic Research and Potomac. Data as of April 14, 2026.
That said, another recession will happen. The question is not if, but when. So, how does one tell if the economy is actually on the brink of a recession?
Short answer: there is no surefire way to know.
However, our North Star remains initial jobless claims, which is what people file when they are seeking unemployment benefits after losing their job. The series is released weekly, based on actual filings, and is one of the highest quality indicators for directional signals and turning points.
Since 1985, initial claims have tended to bottom roughly 21 months before the onset of a recession (see figure 2). That is a long lead time, so it is not an immediate “sell” signal. But the pattern matters. A steady increase in claims has almost always occurred ahead of an official downturn. If you’re not seeing that pattern, you can feel reasonably comfortable that the noise you’re hearing is just that…noise.
Figure 3. Initial Jobless Claims (Thous.) vs Periods of Recession
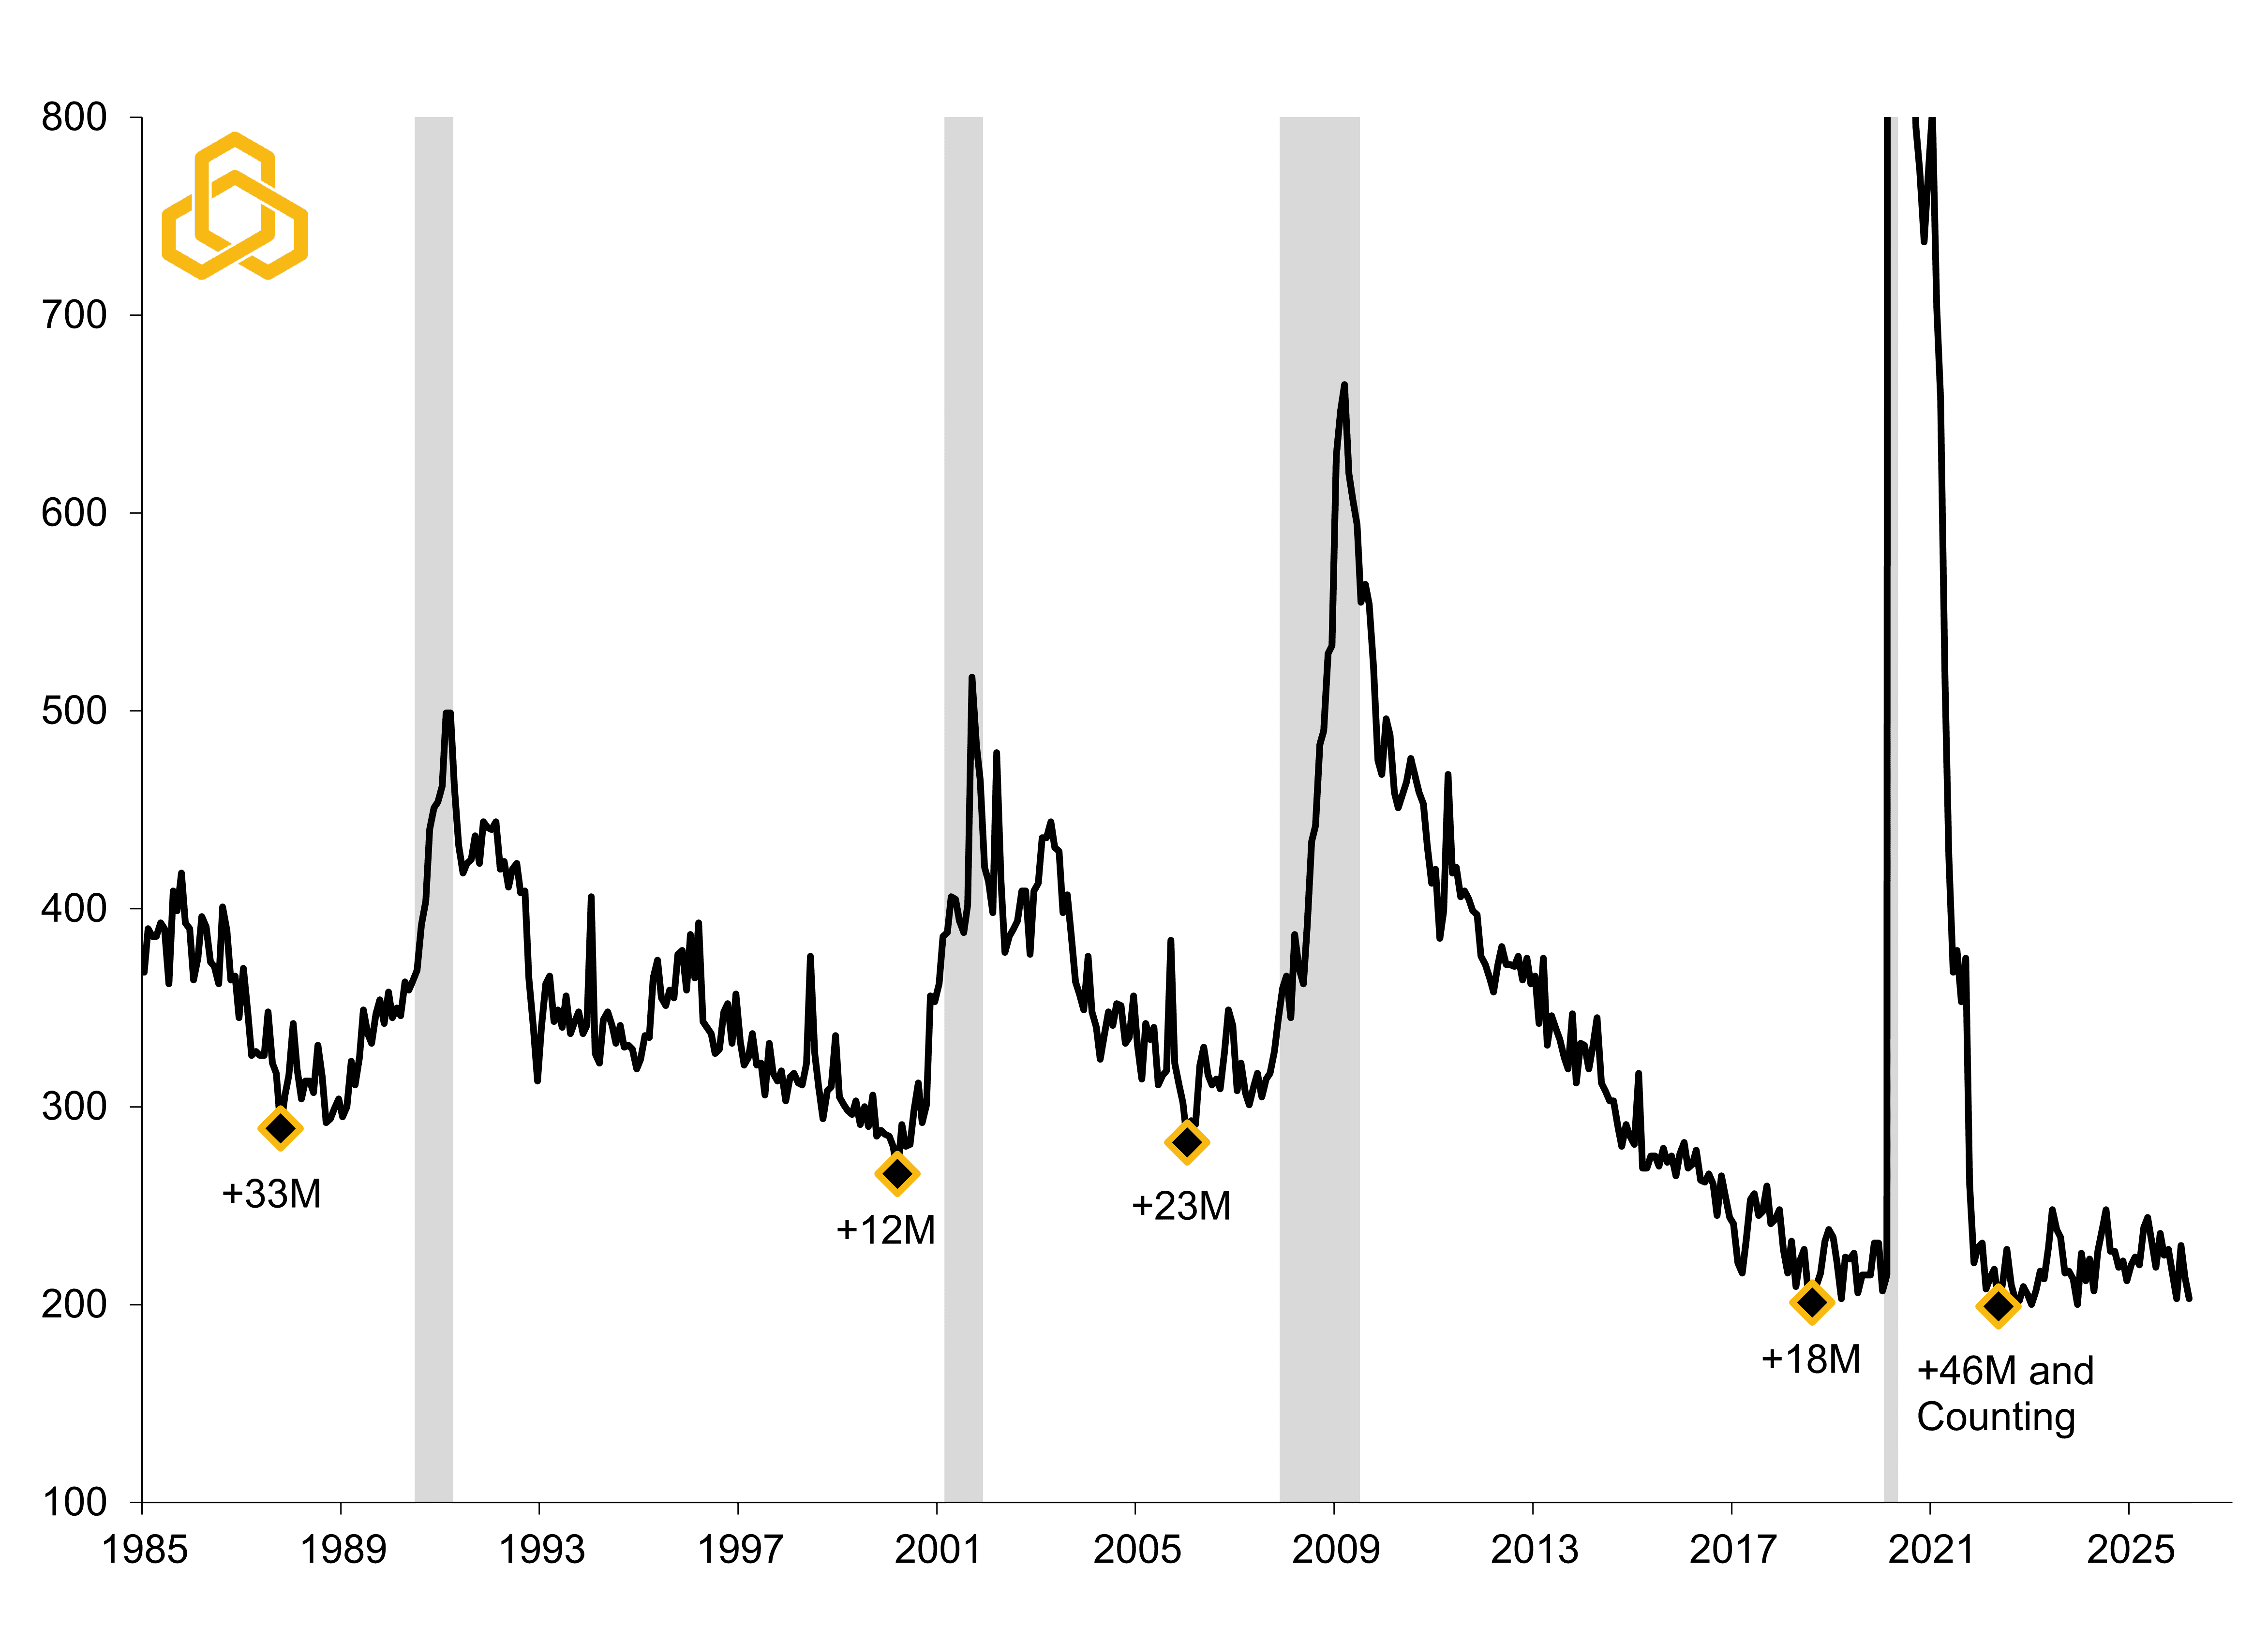
Sources: Department of Labor, National Bureau of Economic Research, and Potomac. Data as of April 14, 2026. Note 1: Shaded regions denote periods of U.S. recession. Note 2: During the pandemic, claims topped out at 5.9 million in March 2020, making the series rise above the chart axis.
Currently, claims appear to have bottomed roughly 46 months ago, which coincides with the start of the Fed’s 2022 rate hiking cycle. Yet despite tighter policy, layoffs remain limited. If corporate profitability holds up, this “low-hire, low-fire” environment will probably persist for some time.
As figure 4 shows, it is rare to see mass layoffs without a deterioration in corporate profits first. We would also point out that every time initial jobless claims rose above 20% on a year-on-year basis since 1985, the U.S. economy either slipped into a recession or was already in one. Right now, claims remain well below their levels one year ago.
Figure 4. U.S. Corporate Profits and Initial Jobless Claims vs. Recession
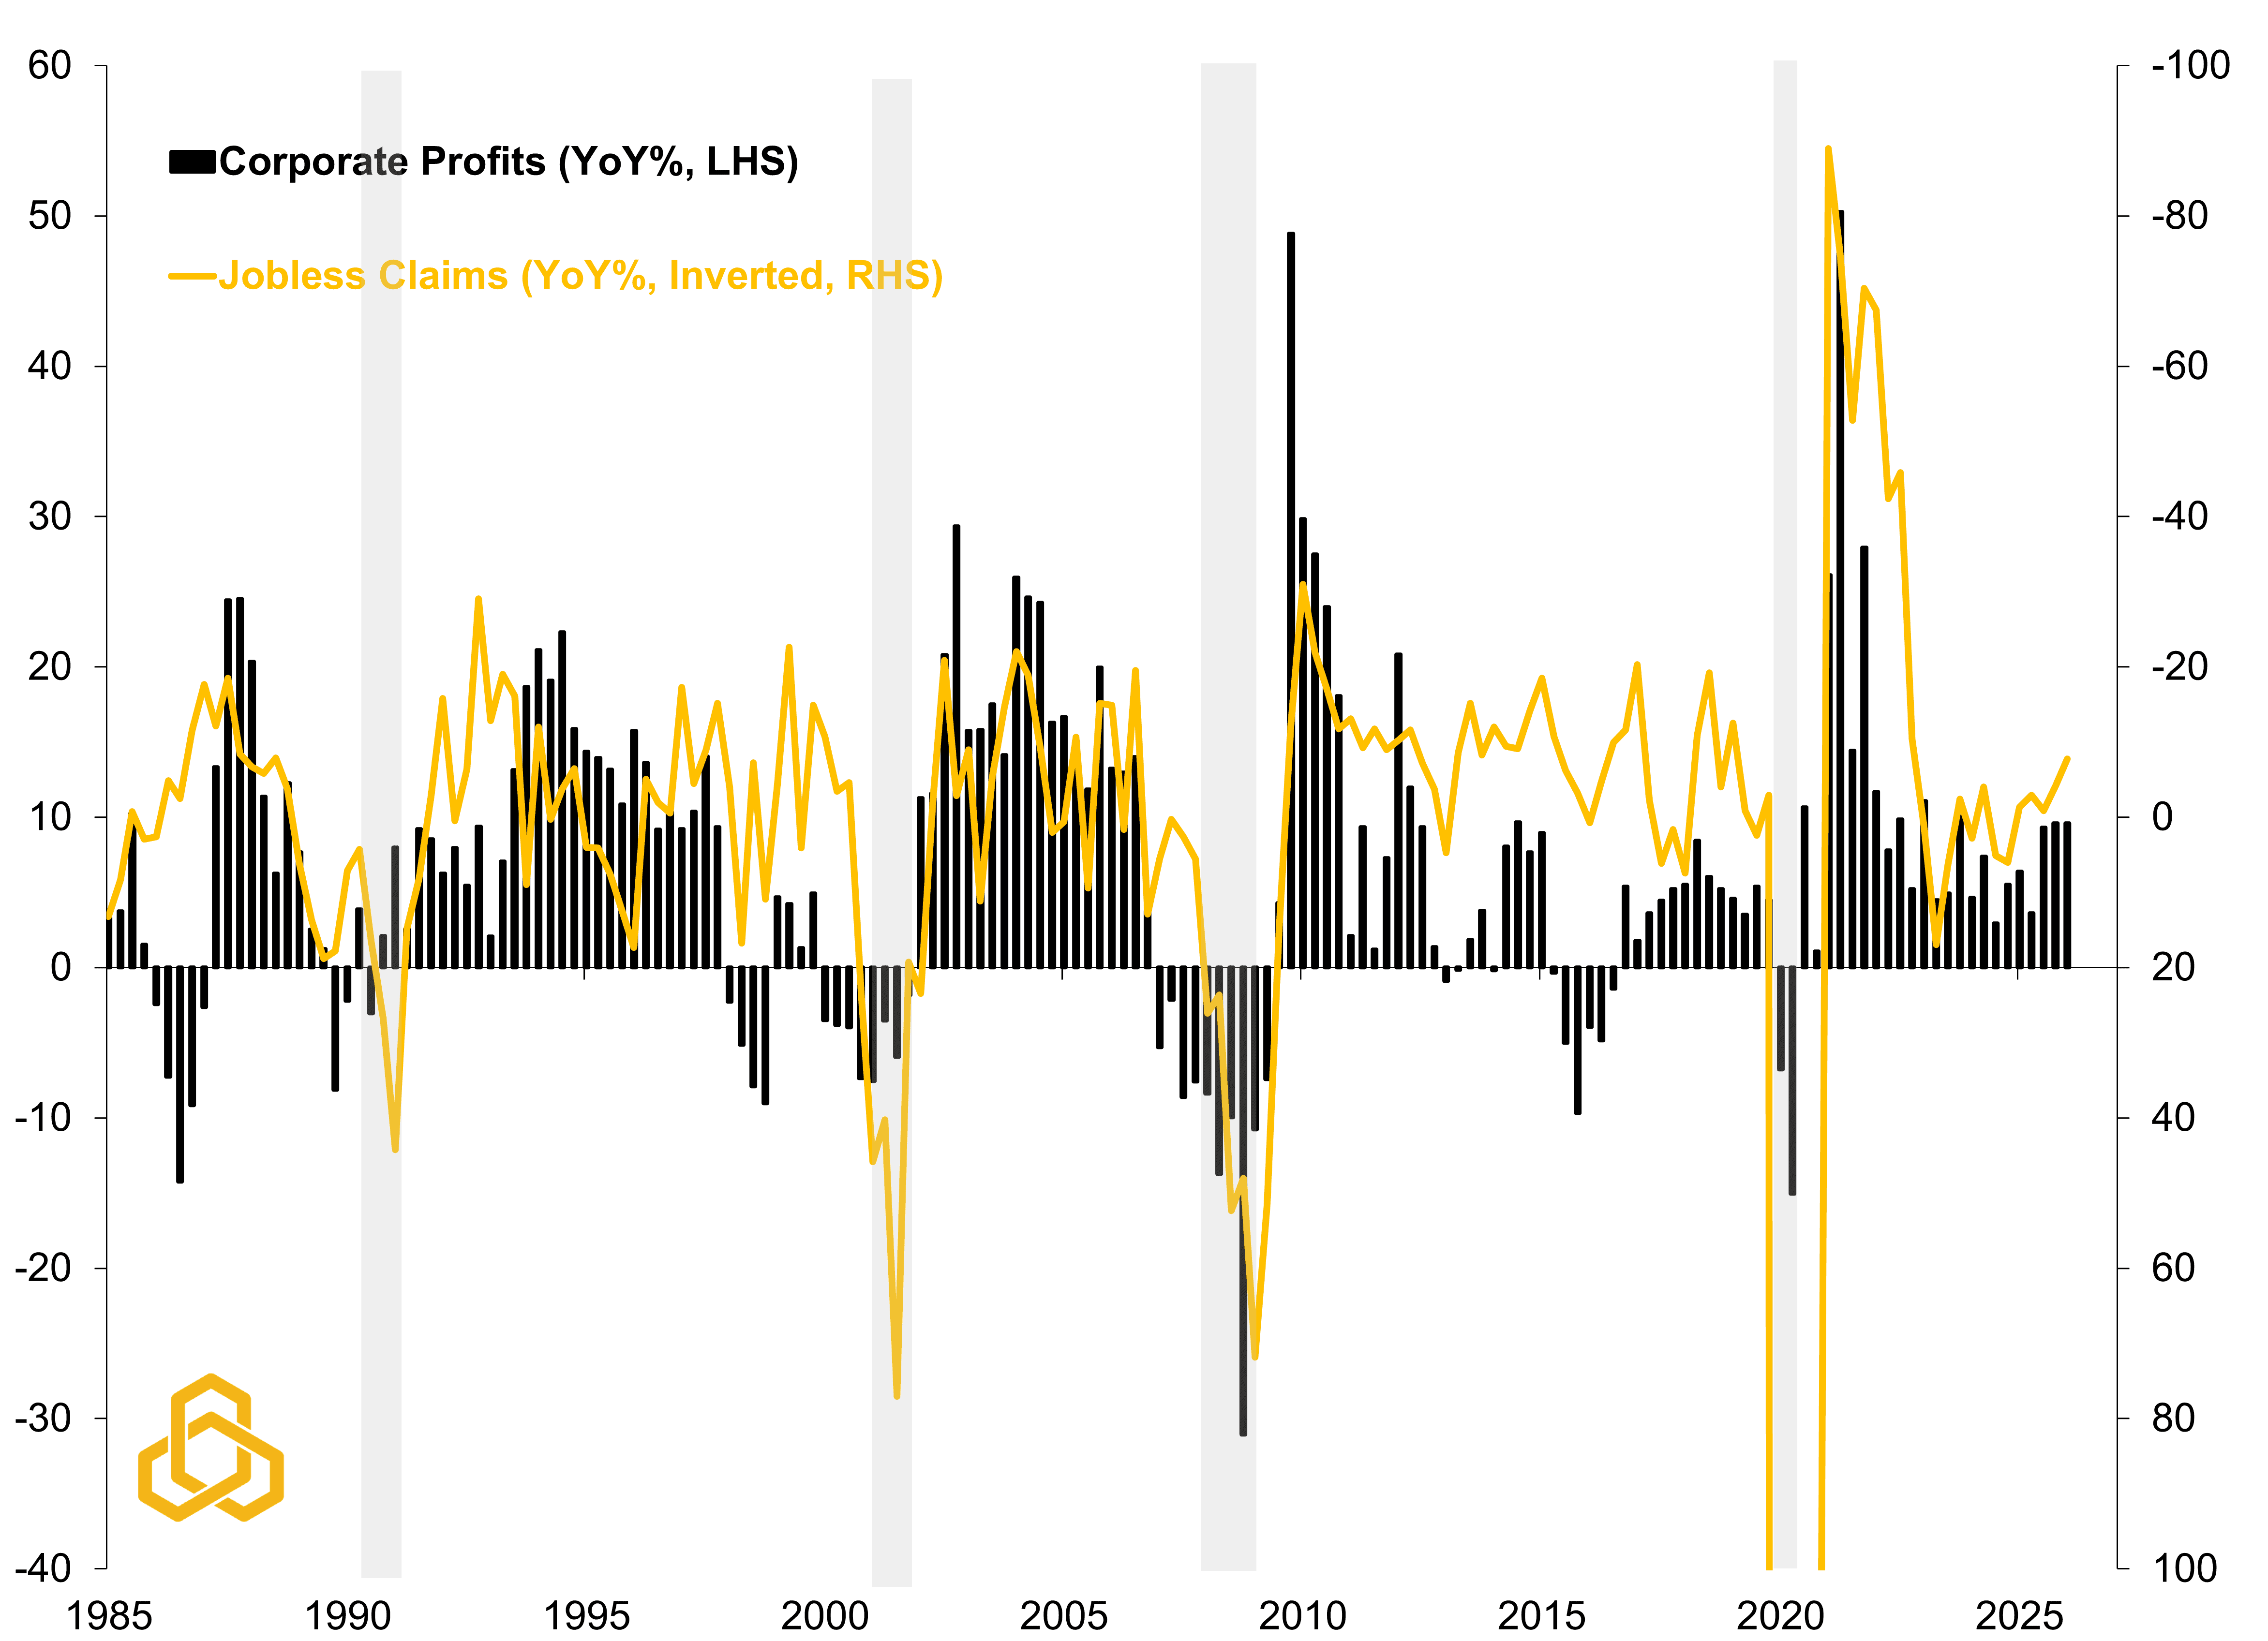
Sources: Bureau of Economic Analysis, Department of Labor, National Bureau of Economic Research, and Potomac. Data as of March 2026. Note 1: Shaded regions denote periods of U.S. recession. Note 2: During the pandemic, claims surged by 2,829% in March 2020, causing the series to fall below the chart axis.
That does not mean risk should be ignored even though virtually every call for a recession over the past 17 years has been wrong.
It means it should be managed properly with the roughly 25% drawdown in the S&P 500 and breakdown in asset class diversification in 2022 serving as a stark reminder of the importance of risk management.
At Potomac, we believe that prudent risk management is not about reacting to false claims or headlines but responding to actual trends.
In other words: data over feelings.
Weekly “Keeping it Strait” Highlights:
Tanker traffic through the Strait of Hormuz has improved a bit with some tankers making it through but overall traffic remains very low with blockades in place. Polymarket investors see a 67% chance of a permanent ceasefire by the end of June 2026.
West Texas Intermediate crude fell from $94.41 per barrel to $90.83 per barrel while Brent crude remained largely unchanged at $94.59 per barrel. Retail gas prices fell by $.06. Not a victory, but trending in the right direction.
One-year inflation expectations dropped from 5.0% to 3.5% after March consumer prices came in largely as expected.
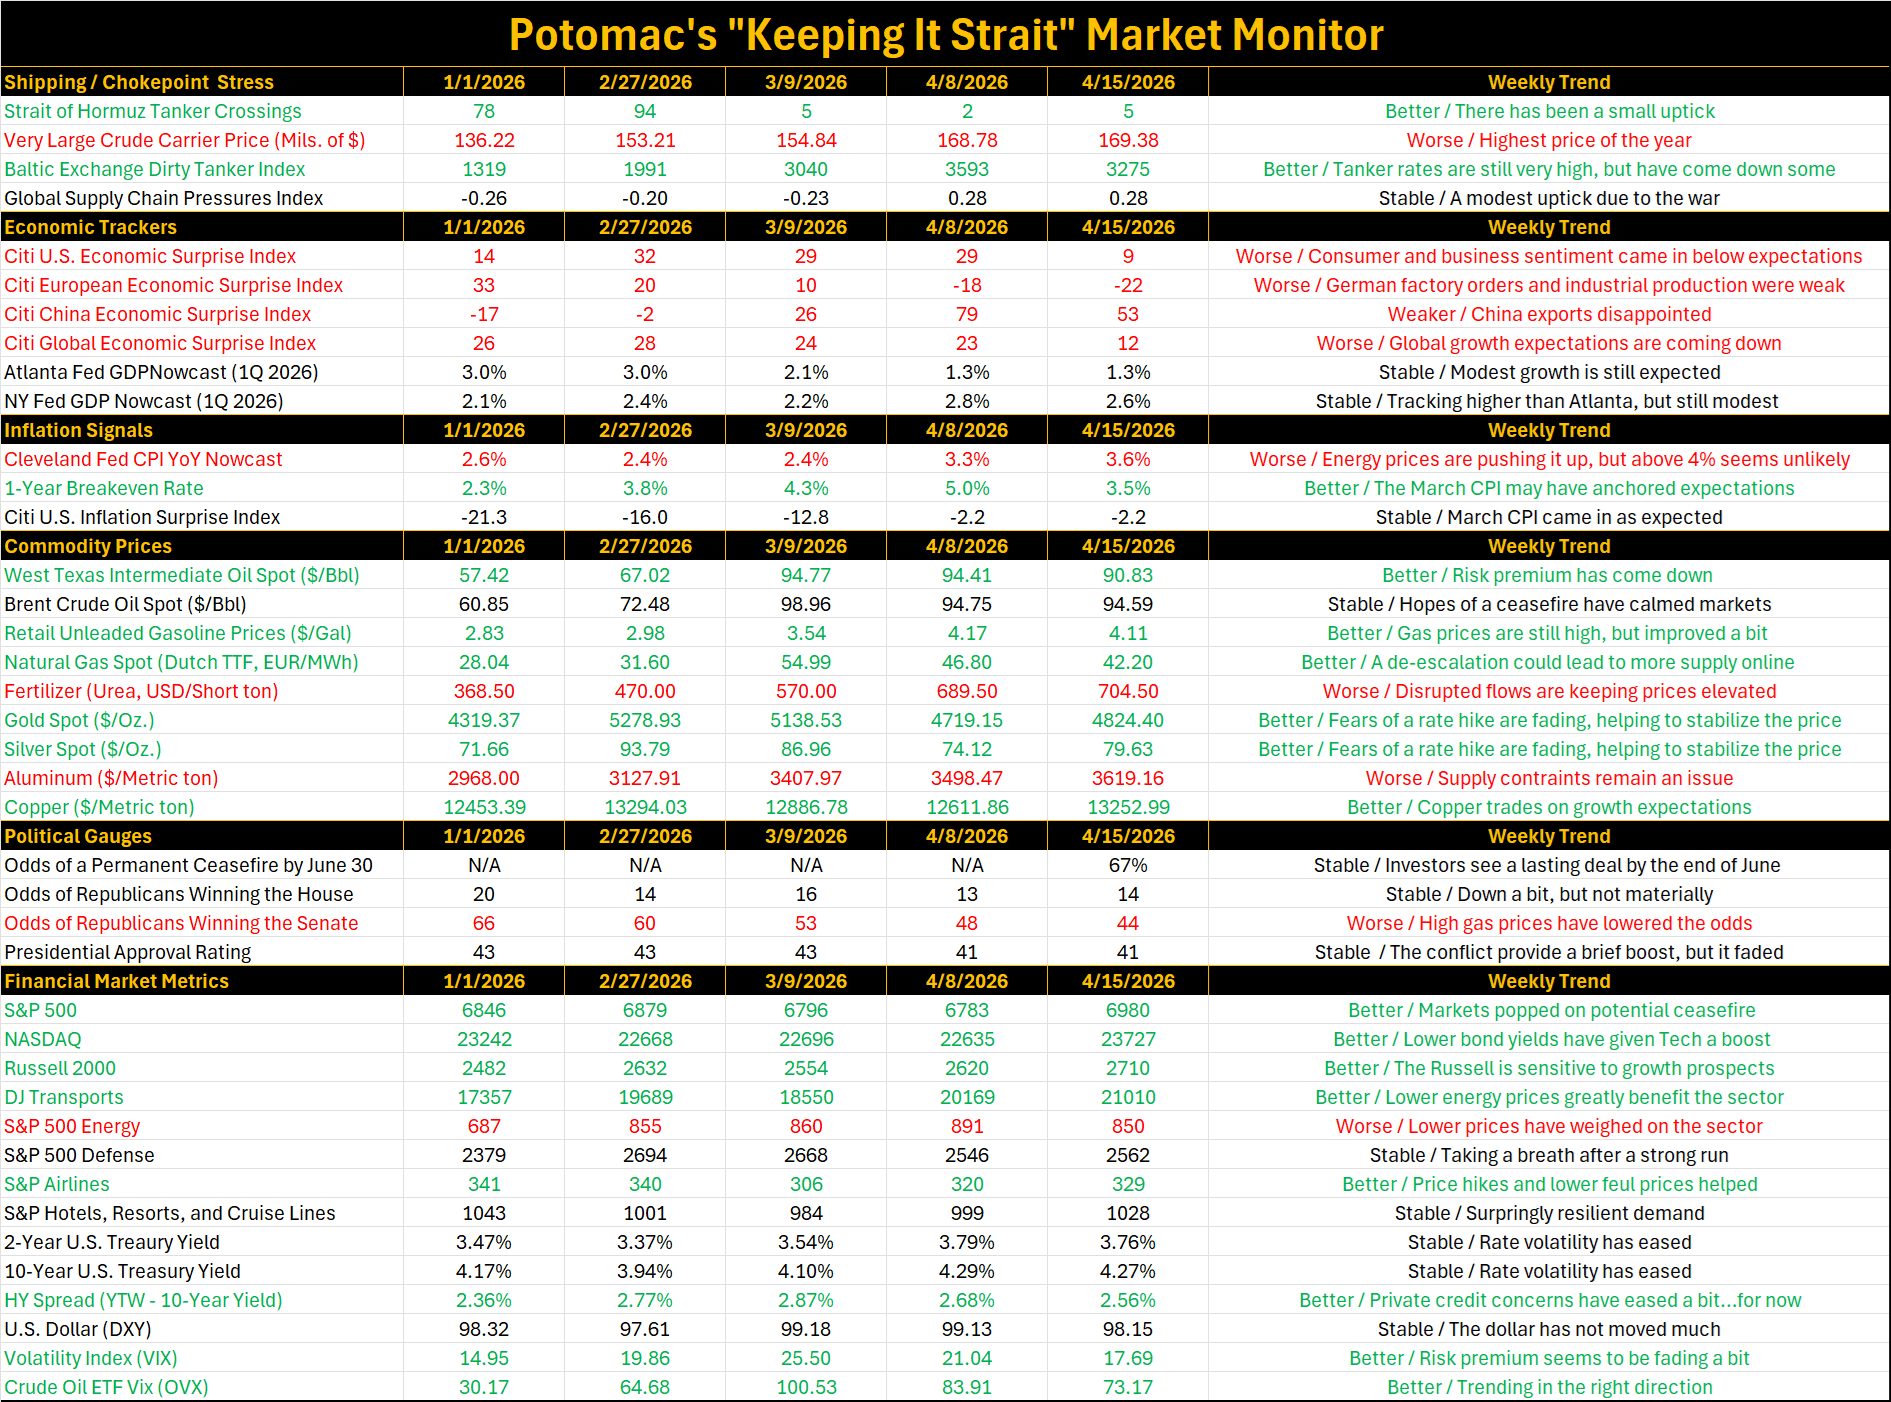
Source: Bloomberg L.P. and Potomac. Data as of April 15, 2026. Note 1: The dates selected are 2/27/2026 (start of the conflict), 3/9/2026 (initial oil surge/peak as the Strait closed), and the latest week and previous week to compare the weekly trend. Note 2: Economic and inflation surprise index readings about zero imply that data are beating the consensus on average, below zero means that data are missing expectations. Note 3: In commodity prices, we ranked higher oil, natural gas, retail gas, fertilizer, and aluminum prices as bad for the economy because it weighs on growth, we ranked rising gold and silver prices are good due to the investor perspective. Note 4: Political betting market odds are forecasts. All forecasts are expressions of opinions and are subject to change without notice and are not intended to be a guarantee.
PFM-326-20260416