Correlation is often a misunderstood descriptive statistic in financial markets.
A common mistake is accepting the average correlation without considering the variation around it. A second mistake is assuming that the average correlation will remain static over time.
As history has shown, during periods of market stress most assets tend to decline together, and prior correlations often fail to provide meaningful diversification for traditional portfolios.
Tactical strategies attempt to reduce reliance on historical correlations by acknowledging that correlations change—and by adapting to those changes rather than blindly accepting past averages.
Correlation Simplified
The Oxford Dictionary defines correlation as “a mutual relationship or connection between two or more things.”
More specifically, correlation measures the degree of co-movement between variables using a bounded statistic that ranges from +1 to -1. At the extremes, a correlation of +1 indicates perfect positive co-movement, while -1 reflects perfect inverse movement.
To illustrate, imagine two vehicles traveling on a highway. They may travel in the same direction, in opposite directions, or with no relationship at all.
Correlation works in much the same way. It measures direction, not speed.
There are three possible states: positive, negative, and zero.
Positive correlation refers to both vehicles consistently traveling in the same direction. In this case, correlation equals +1, or perfect positive correlation.
Negative correlation occurs when one vehicle travels north while the other travels south—exactly opposite directions, regardless of speed. This is reflected by a correlation of -1.
Zero correlation exists when the direction of the two vehicles has no relationship towith one another.
Correlation Is Not Static
The examples above describe correlation at the extremes. In reality, financial markets rarely operate in such clean, binary terms. Correlations are constantly evolving and are almost never perfect.
The correlation between any two assets is dynamic, and shifts should be expected.
For example, consider the rolling one-year and five-year correlation between stocks and bonds as represented by the S&P 500 and the 10-Year Treasury Note.
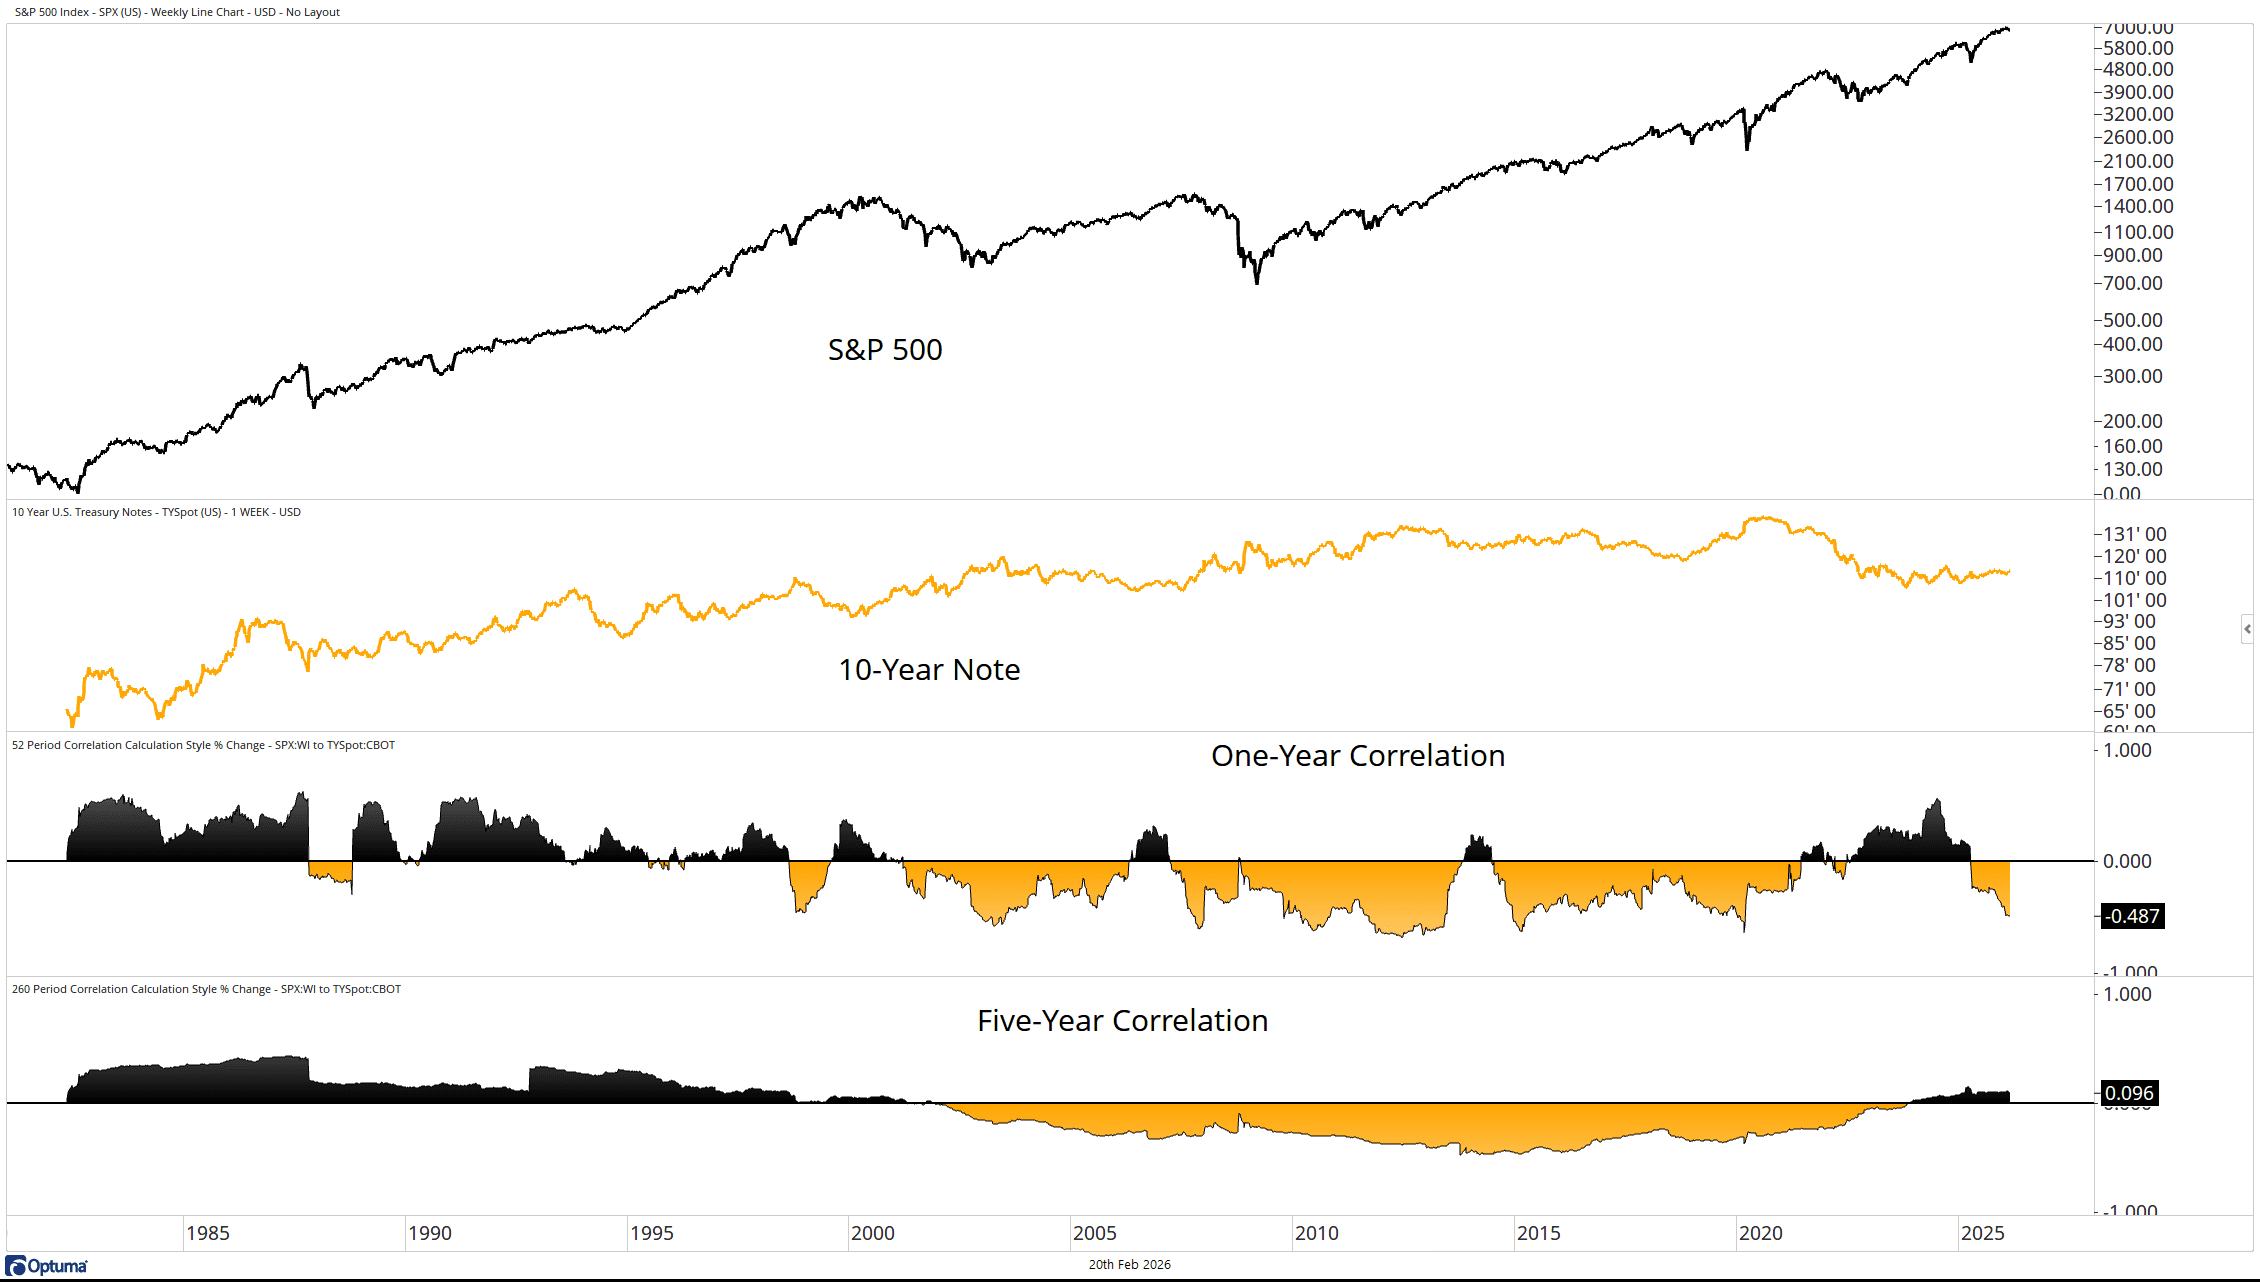
Source: Optuma
Notice how correlations change over time, especially in recent years. The correlations do not simply sit on a static mean.
Understanding this dynamic allows for a more accurate interpretation of the statistic and helps investors avoid being misled by a simple average.
Bull Bear Correlation
Since inception, Bull Bear has been only moderately correlated with the S&P 500. From 6/1/2002 through 12/31/2025, the correlation was 0.51.
As with the stock-and-bond example, there are meaningful swings over time. A tactical manager not only accepts this reality but actively seeks it.
The objective is to achieve low—or ideally negative—correlation with the S&P 500 during bear markets such as 2002, 2008, or 2022, when most assets decline together.
Coming out of those bear markets, the goal shifts toward becoming positively correlated to participate in bull market gains.
These dynamics are what produces the swings around the long-term average correlation of 0.51.
Bull Bear Rolling Correlation
To visualize the dynamic nature of Bull Bear’s correlation, consider the rolling one‑year correlation between Bull Bear and the S&P 500 Total Return Index.
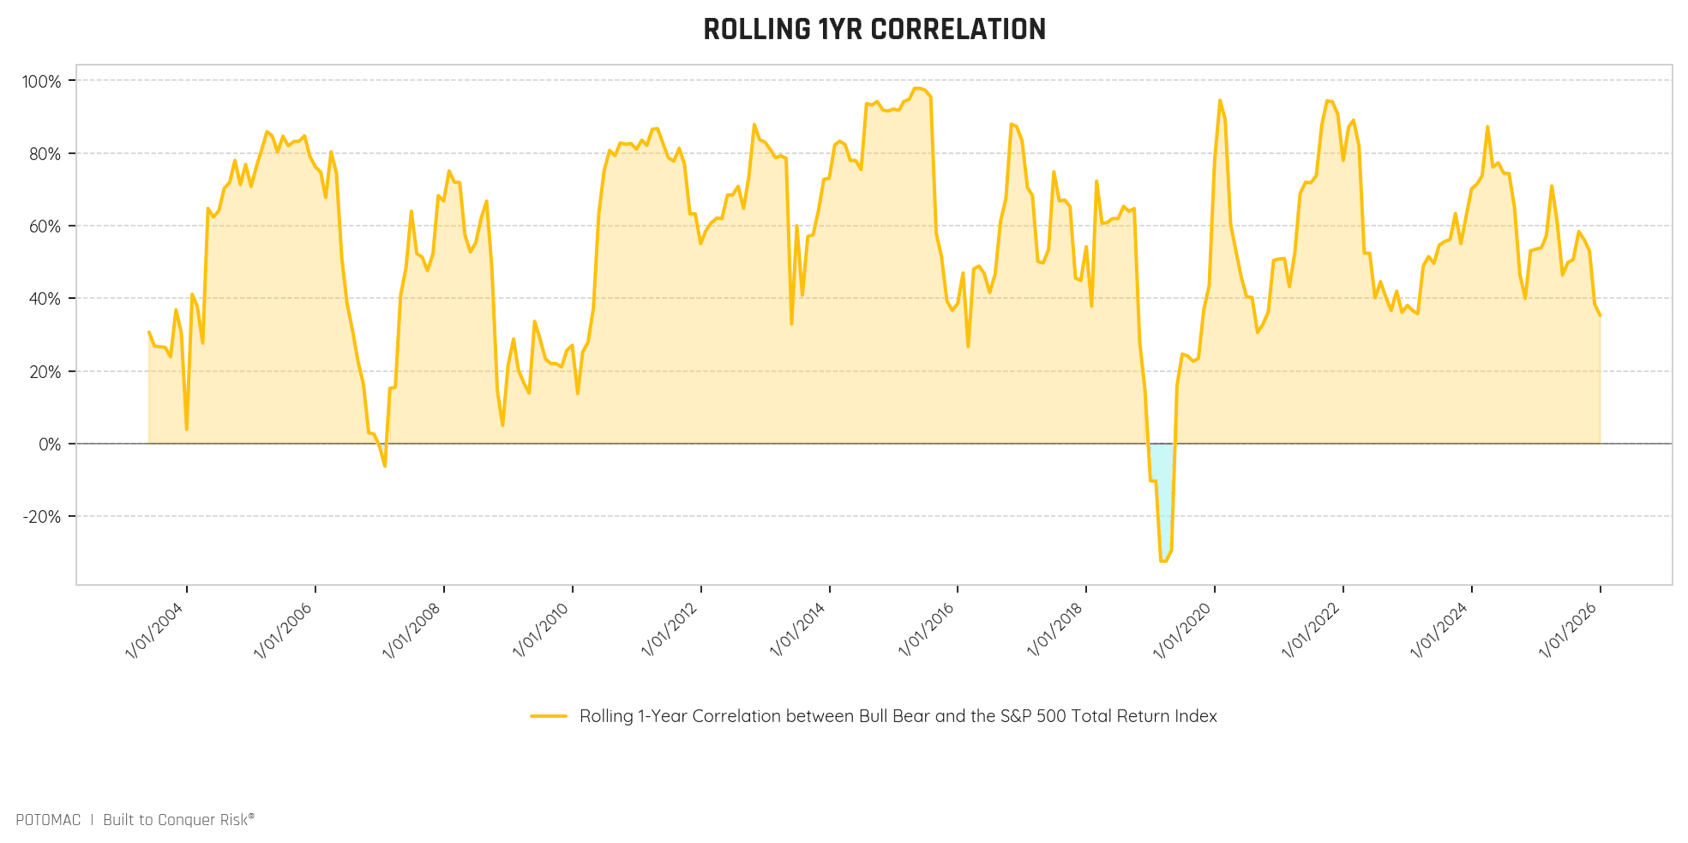
Two extremes highlight the benefits of this adaptive approach.
On 2/28/2019, the rolling one‑year correlation was -32.37%. During a period marked by multiple sharp market declines, Bull Bear became negatively correlated and defensive.
At the other extreme, on 4/30/2015, the rolling correlation reached 97.85%. Over that 12‑month period, stocks gained roughly 15%, and the strategy became nearly perfectly correlated to participate in the advance.
In both cases, the strategy behaved as designed—defensive during periods of equity weakness and fully engaged during sustained uptrends.
In traditional buy‑and‑hold portfolios, changing correlations are often viewed as a negative because they introduce uncertainty. However, incorporating a strategy like Bull Bear can reduce a portfolio’s reliance on historical correlations.
The willingness to move to cash allows the strategy to become uncorrelated precisely when diversification is needed most.
Correlation in Portfolios
Harry Markowitz, the Nobel Prize–winning economist, famously said, “Diversification is the only free lunch.” His point was that holding a wide range of assets should reduce risk at the portfolio level.
While this is true in theory, buy‑and‑hold diversification has often failed when investors needed it most.
The two examples below illustrate these failures. Both portfolios included a broad mix of assets, such as REITs, stocks, commodities, emerging markets, and bonds.
In 2008, the only asset class with a positive return was U.S. Treasury bonds, which gained roughly 30%.
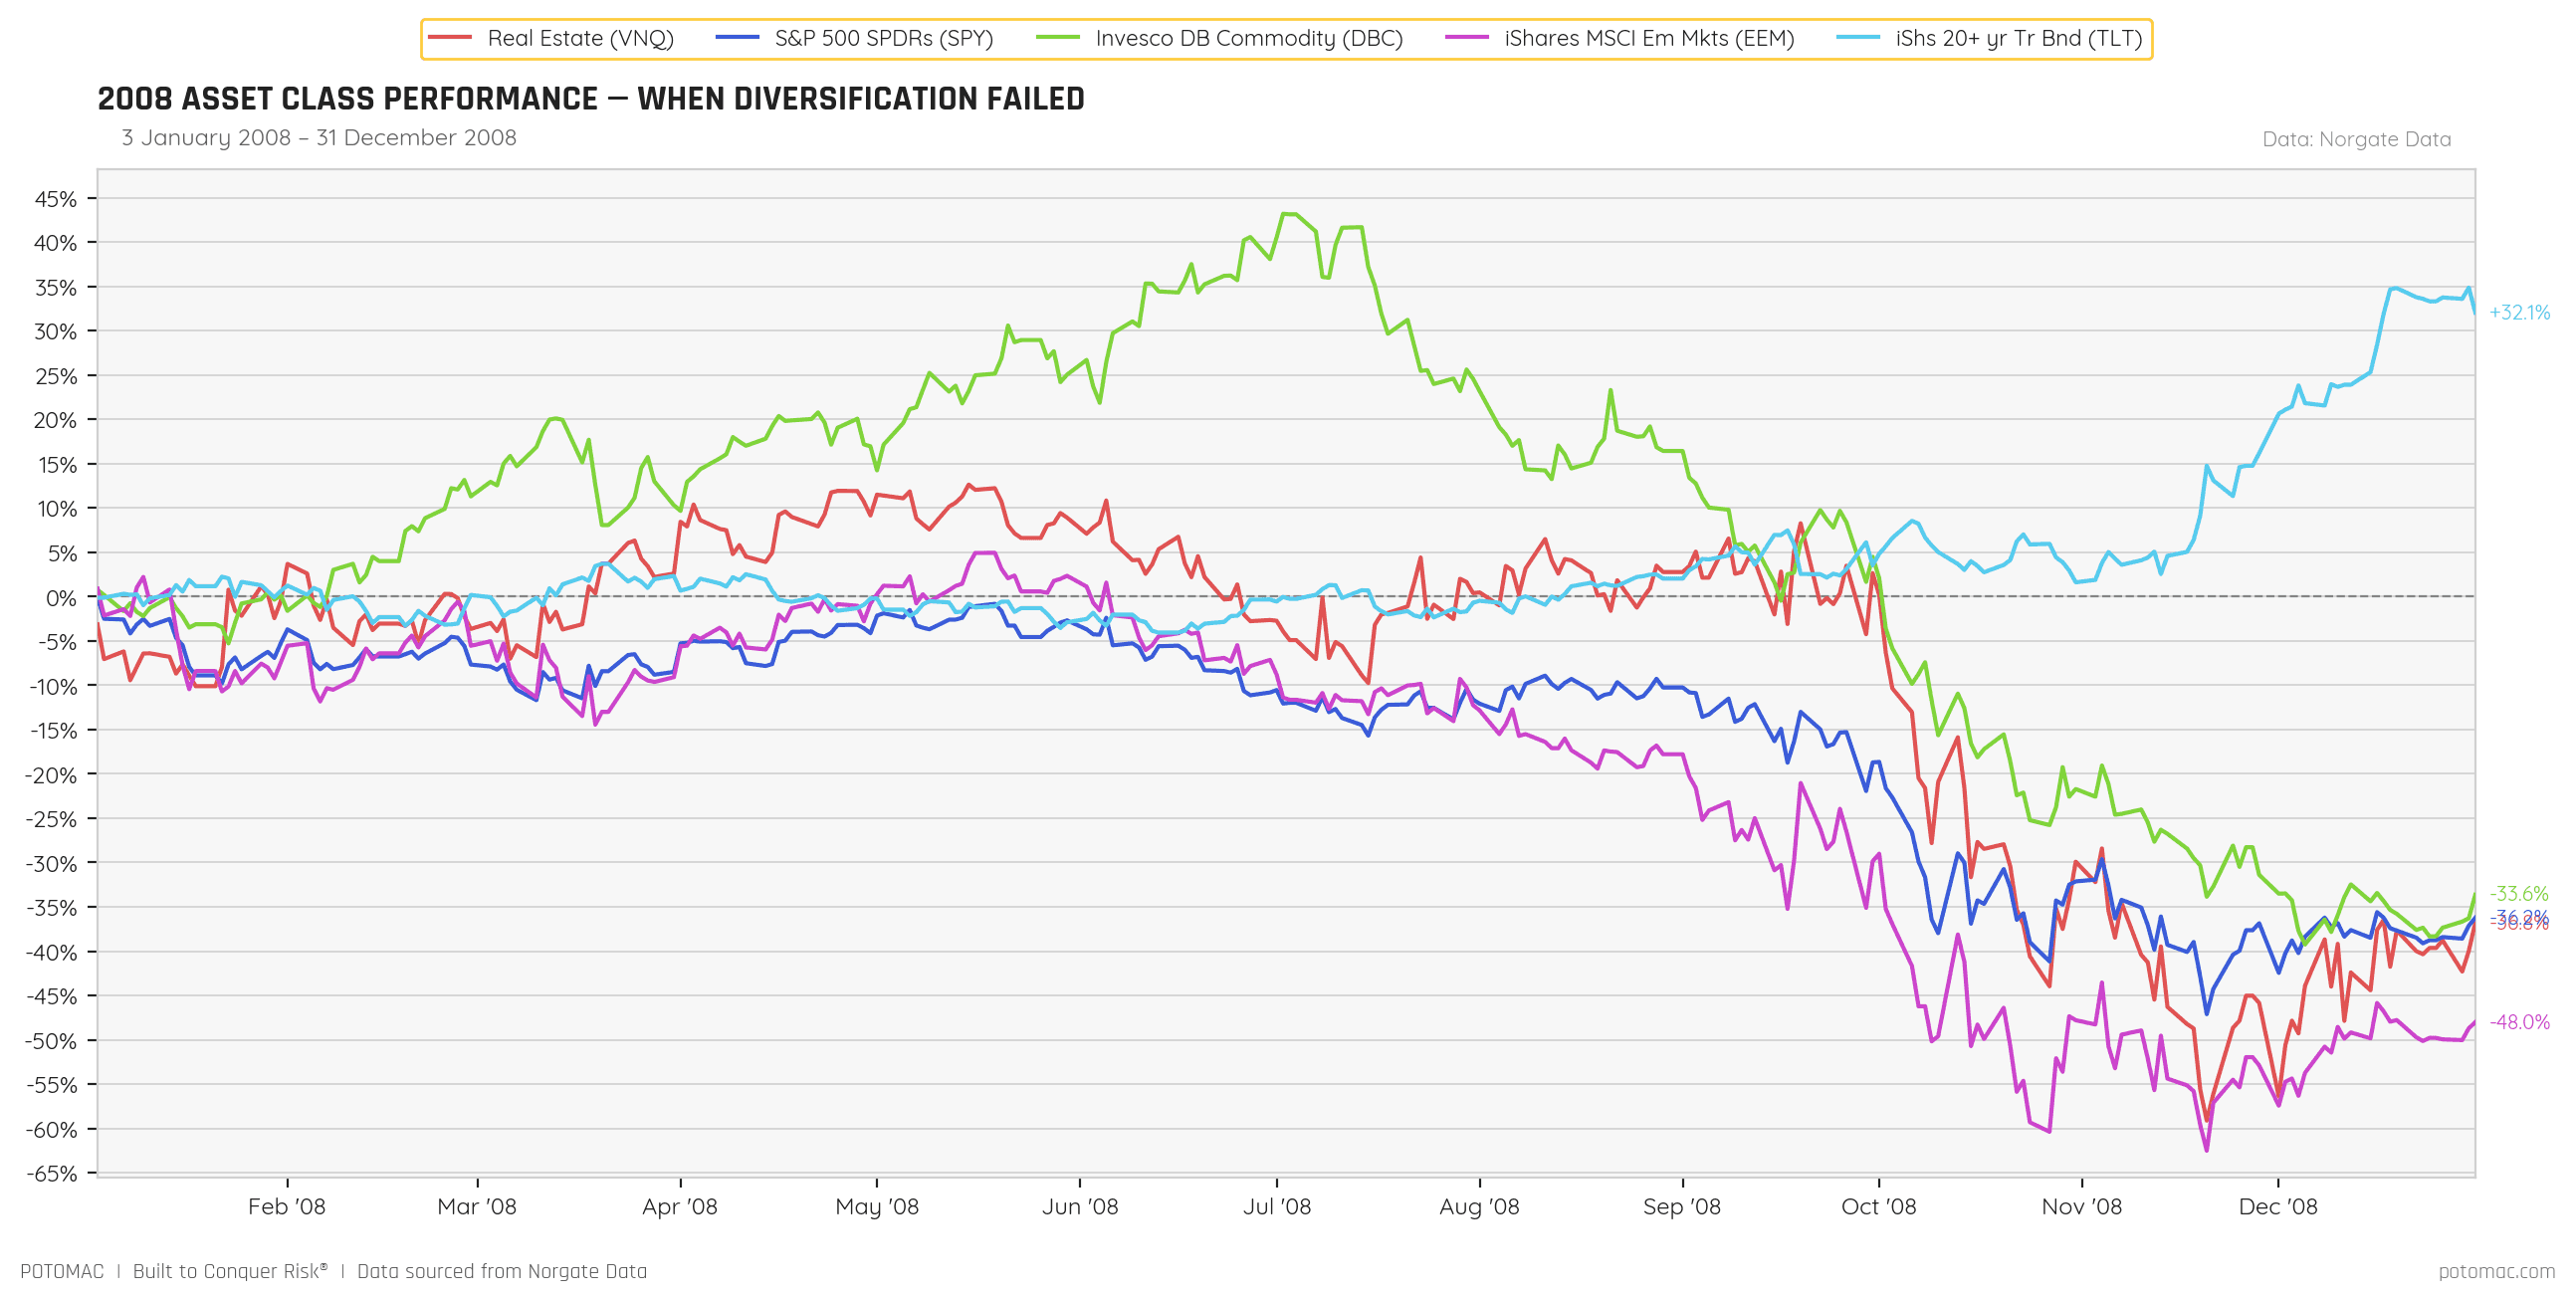
Source: Norgate Data
In 2022, correlations once again rose as most assets declined together. Commodities were the lone asset class to finish the year with positive returns.
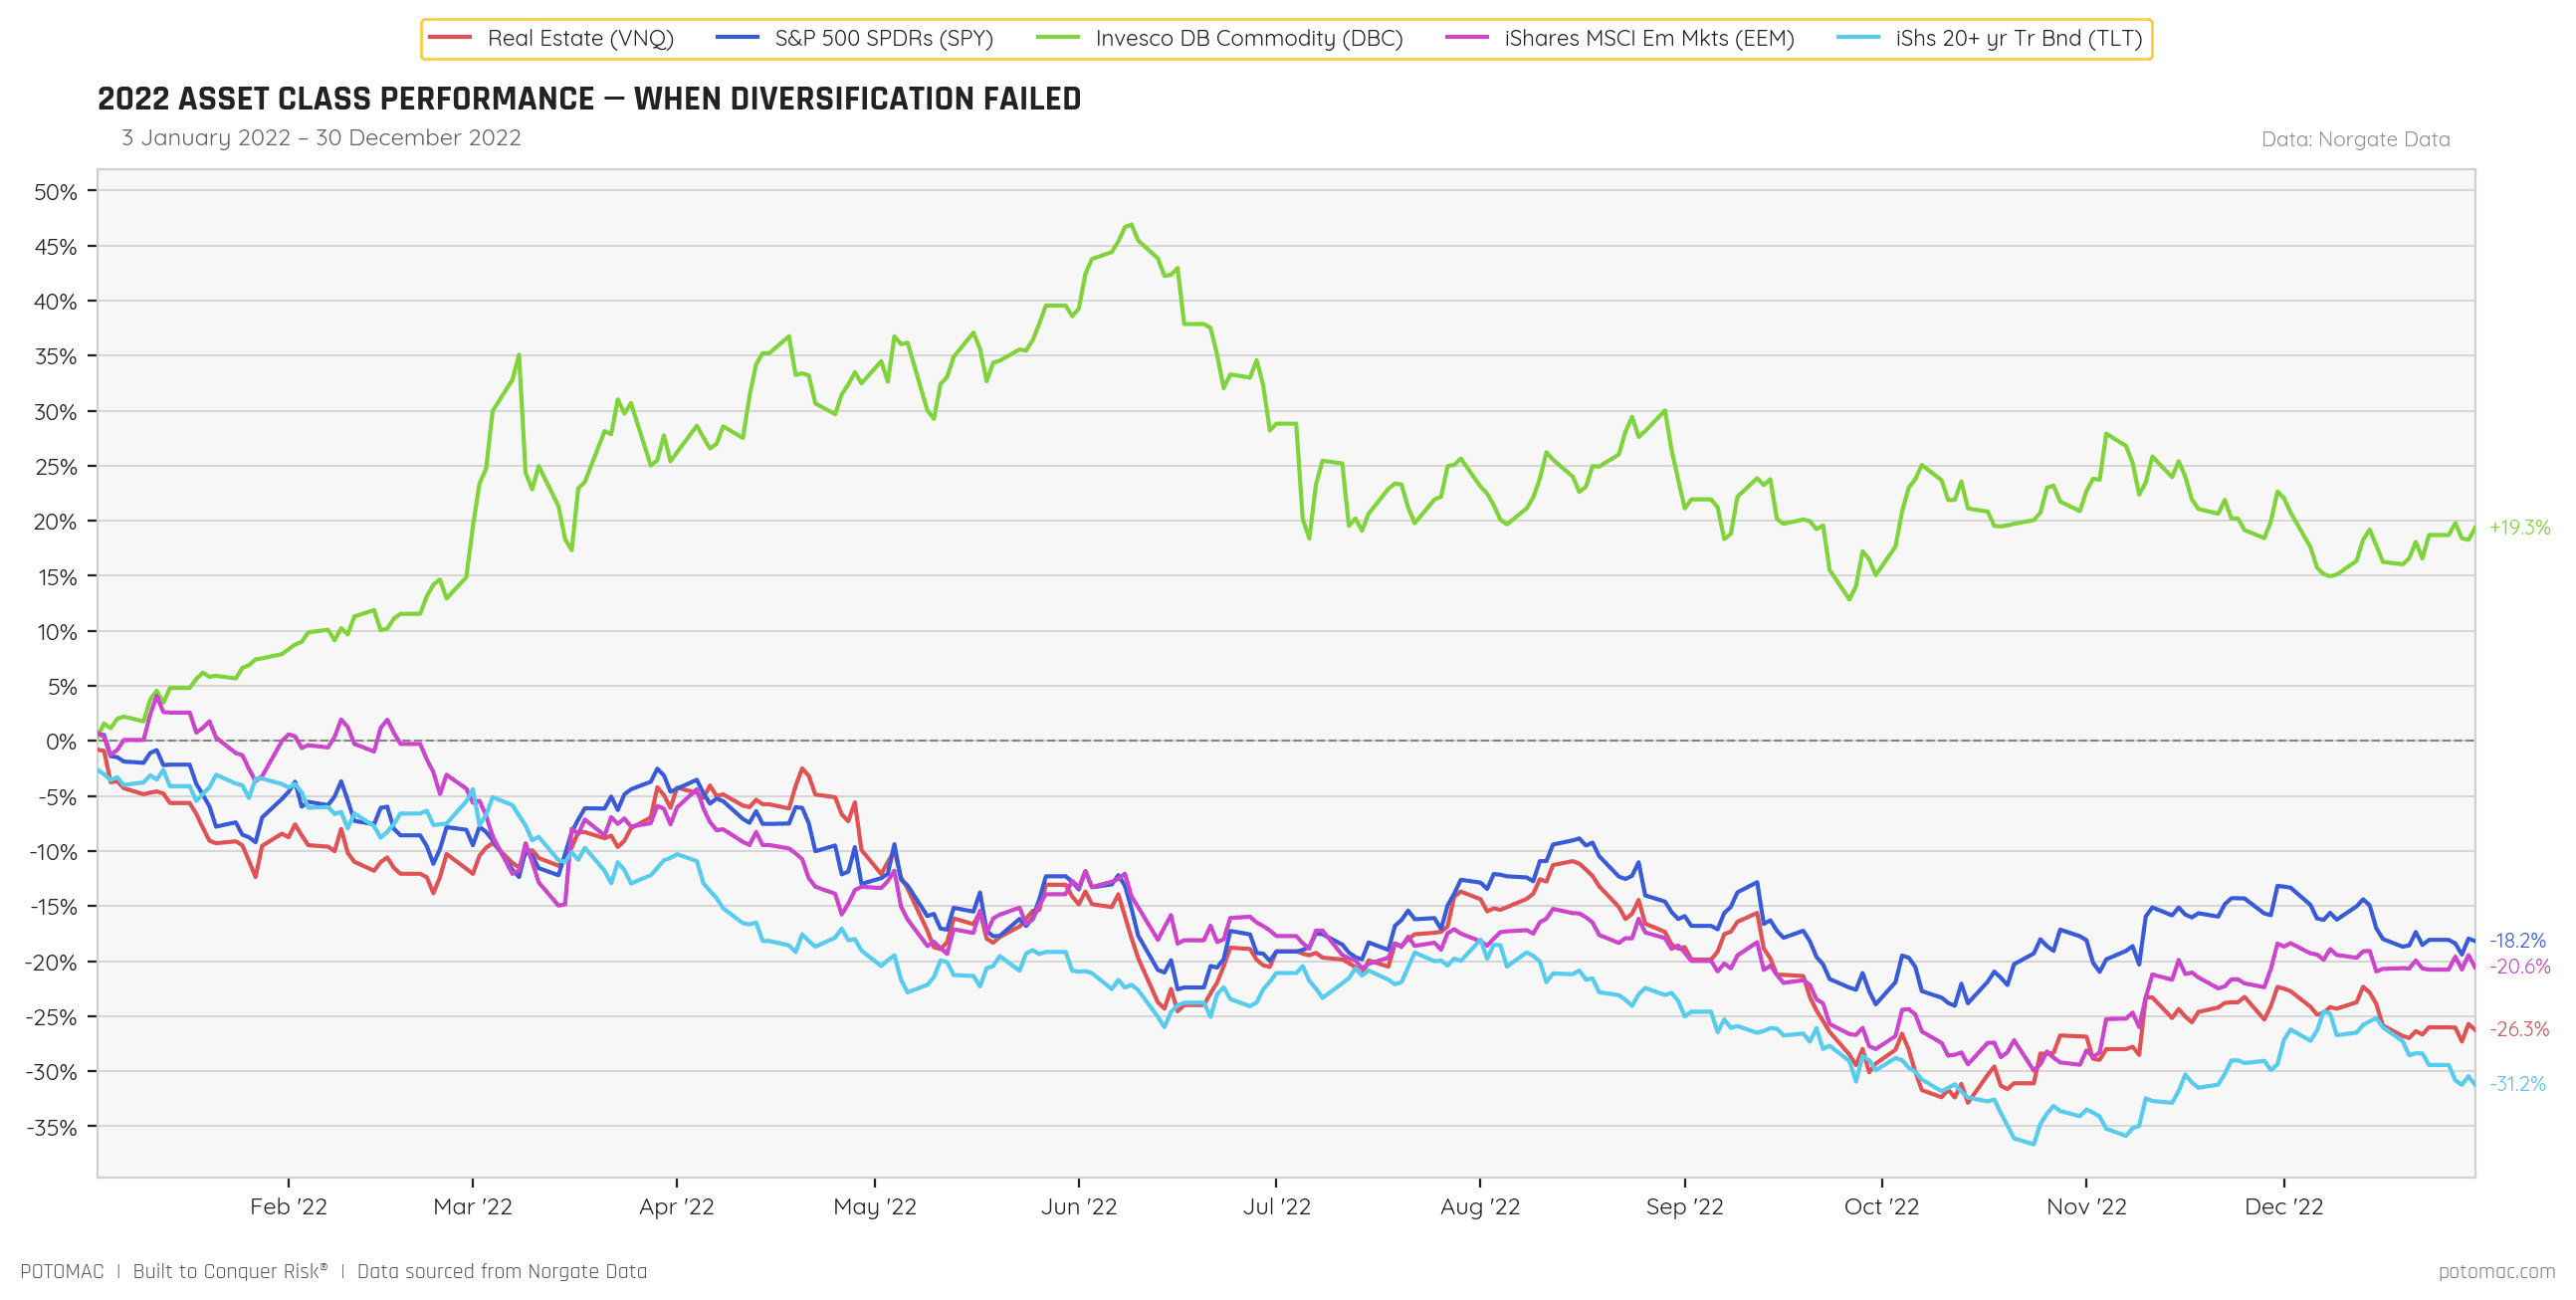
Source: Norgate Data
Why were bonds the “right” hedge in 2008 but the “wrong” hedge in 2022?
Is there a way to determine in advance when bonds may fail in the role for which they have been drafted into a portfolio?
We believe there is—but it requires an ability that few investors possess.
Can you reliably predict inflation? Probably not. Even the Federal Reserve, with far more timely information, often struggles to get the inflation call right.
Our research shows that when the Consumer Price Index rises above 3%, the correlation between stocks and bonds shifts. Below 3%, bonds tend to act as an effective hedge for equities. Above 3%, stocks and bonds are more likely to move together.
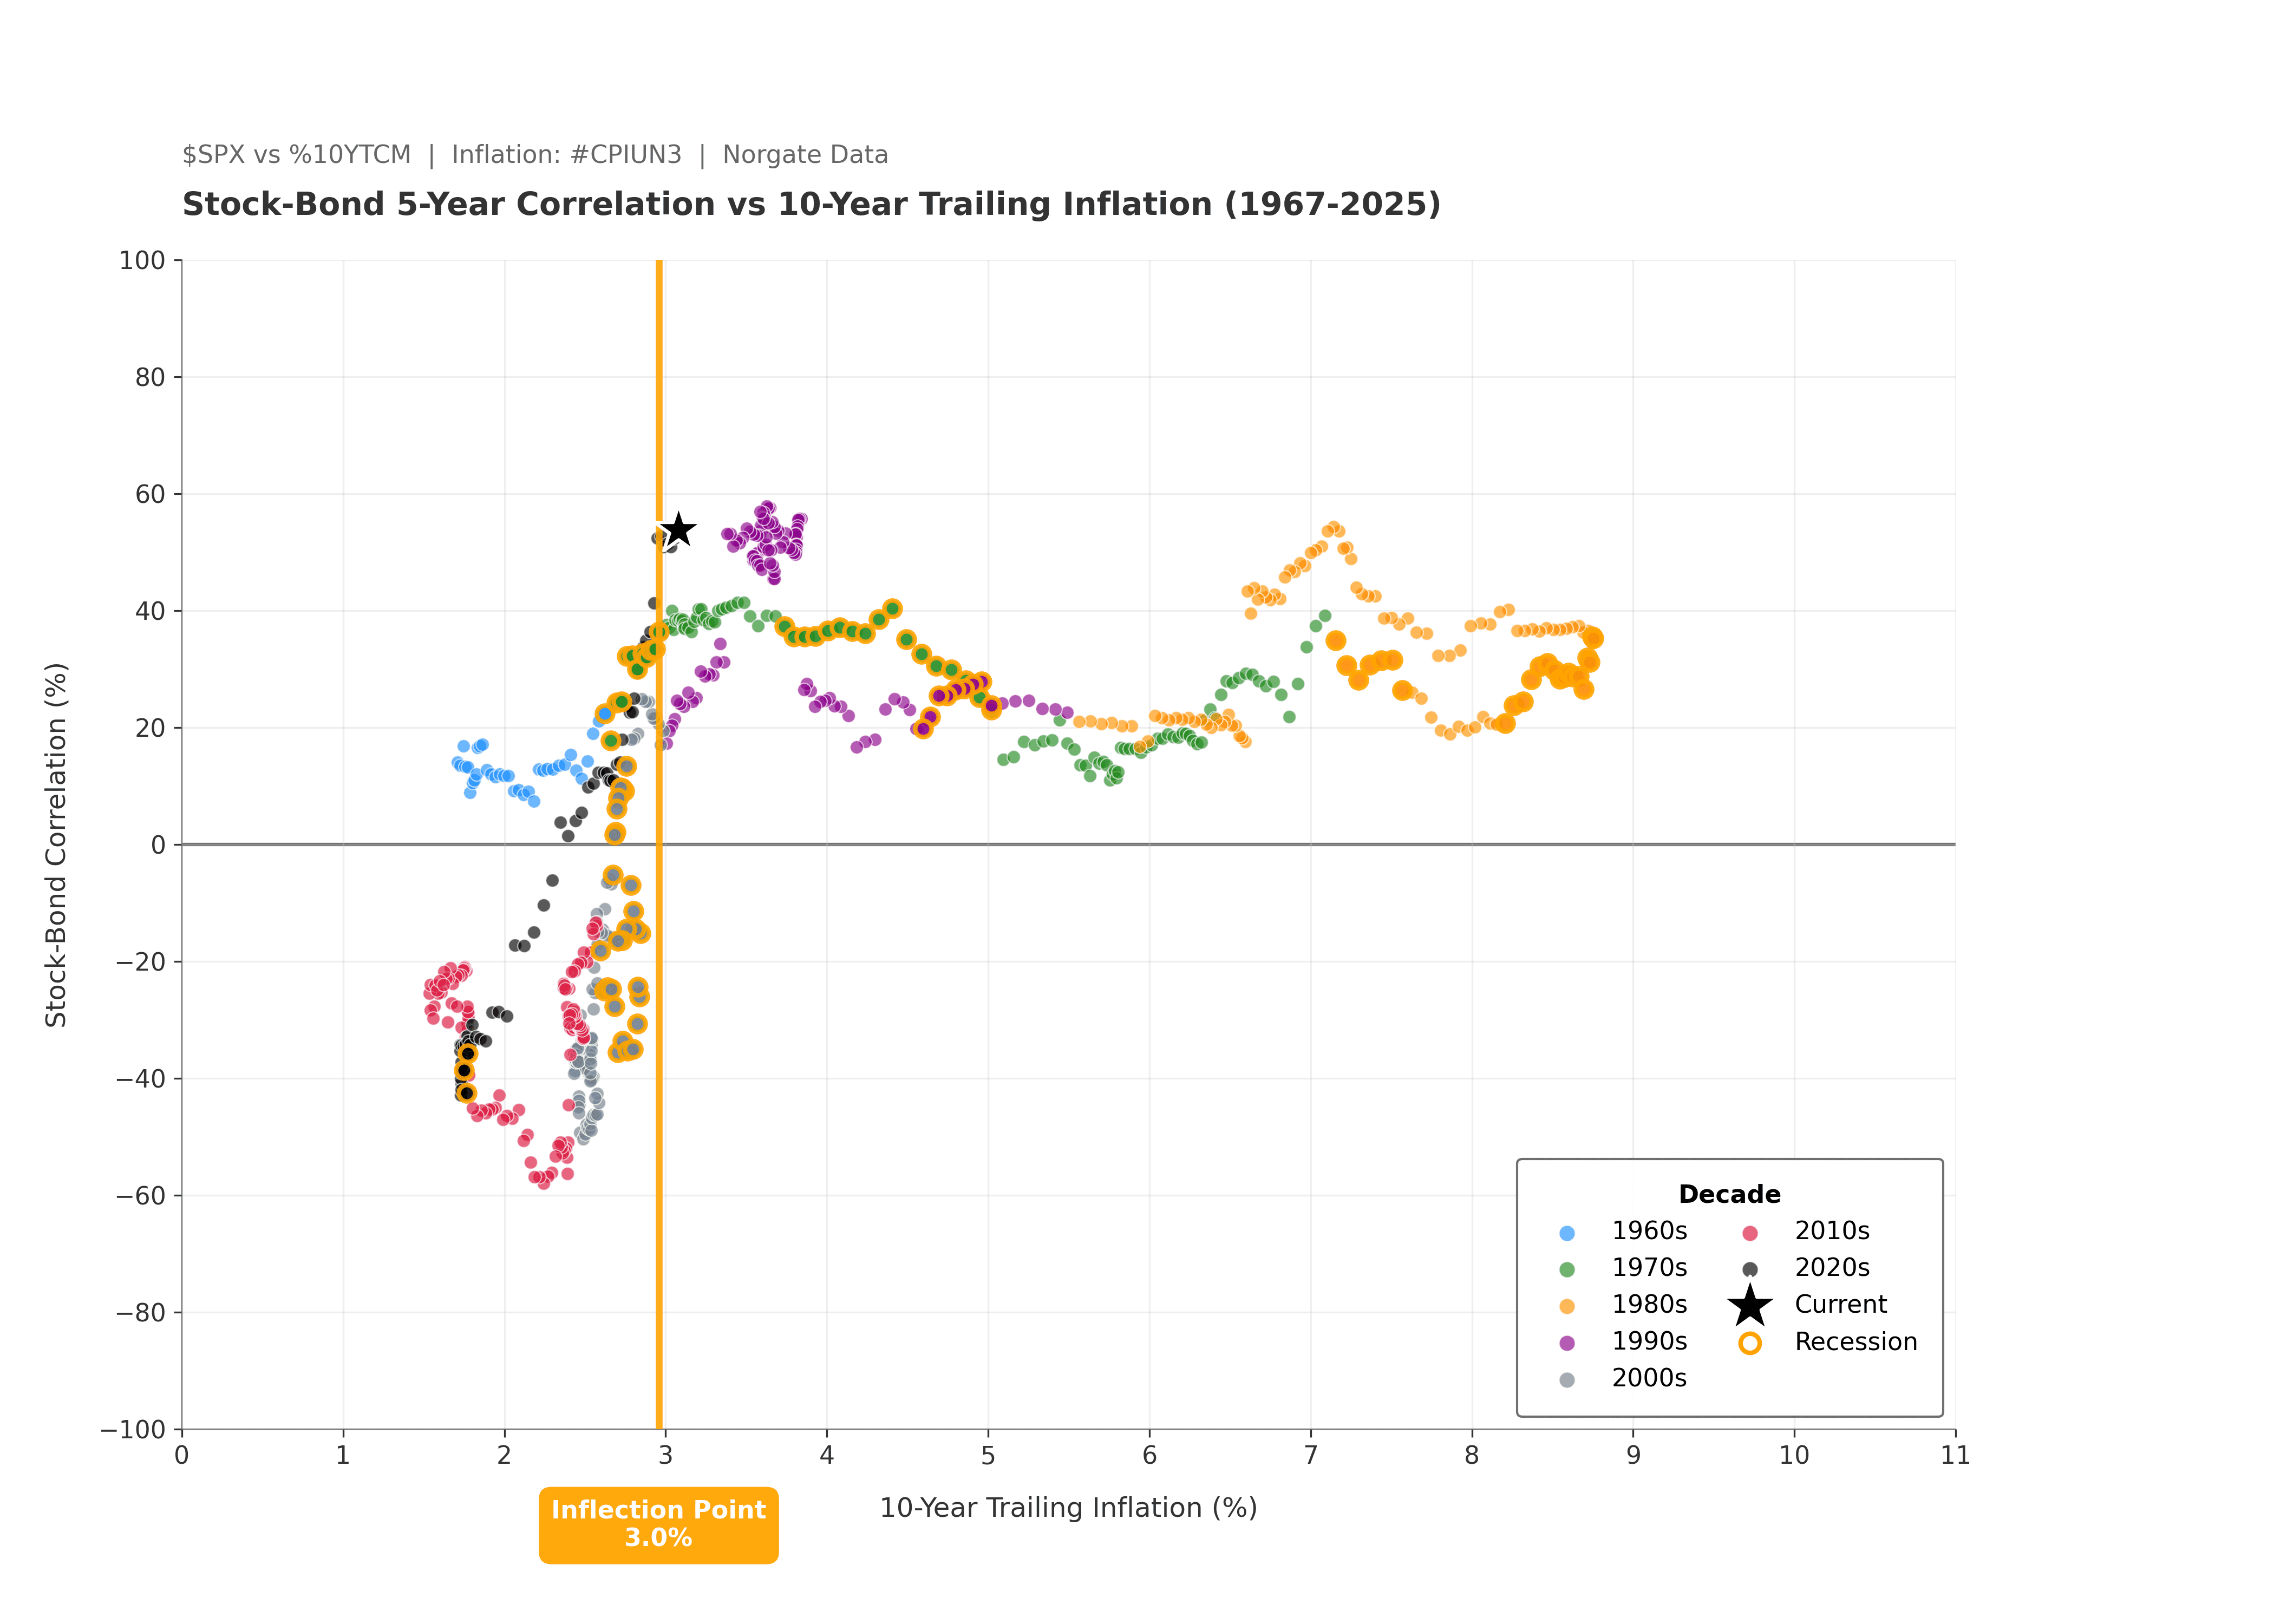
Source: Norgate Data
If you believe you can consistently predict inflation, more power to you. If you, like myself, know that you cannot, it may be time to rethink traditional diversifiers.
Final Note
Traditional diversification may be beneficial most of the time, but it has failed during the outlier years when investors needed risk management the most. Overreliance on historical correlations proved painful in 2008, when only bonds offset equity risk, and again in 2022, when stocks and bonds declined together.
Tactical risk management seeks to reduce reliance on historical correlations by incorporating cash as an explicit defensive option.
At Potomac, risk is always top of mind. All our strategies manage risk through quantitatively tested systems, not by hoping that a portfolio holding will suddenly become negatively correlated during a bear market.
Important Definitions Used in this Report:
S&P 500 Index TR: The S&P 500 TR index is a basket of 500 stocks that are considered to be widely held. The S&P 500 Index TR is weighted by market value, and its performance is thought to be representative of the stock market as a whole. The S&P 500 Index TR is one of the most commonly used benchmarks for the overall U.S. stock market. S&P 500 TR is a total return index adjusted for distributions (i.e., assuming that all distributions are reinvested).
Correlation: Correlation is a statistical measure that determines how assets move relative to one another.