
We often hear Wall Street analysts and media pundits bemoan that a certain stock or index is extended. Intuitively, we know what that means; usually, it is that the stock or the index has moved up or down, substantially, in a very short period. Ultimately anyone who classifies an investment as extended, to the upside, is simply trying to make the case not to chase returns in this kind of market environment.
Unfortunately, the word "extended" does not tell us all that much. Usually, the person who is calling out the extended position provides little to no context on what this actually means.
Extended relative to what?
How extended is it? A lot, a little, or something in between?
It is easy to say that something is extended so that you can garner a media sound bite, but without the proper context, the statement is essentially useless for investors.
How to Define Extended?
Let's dig back into your memory, to that statistics class that you took in freshman or sophomore year of college, and you will find that there is a way to define or quantify extended.
It's called the Z-score.
Do you have visions of that bell curve that you used to draw in your notebook popping into your head?
You should because that is exactly what I am talking about.
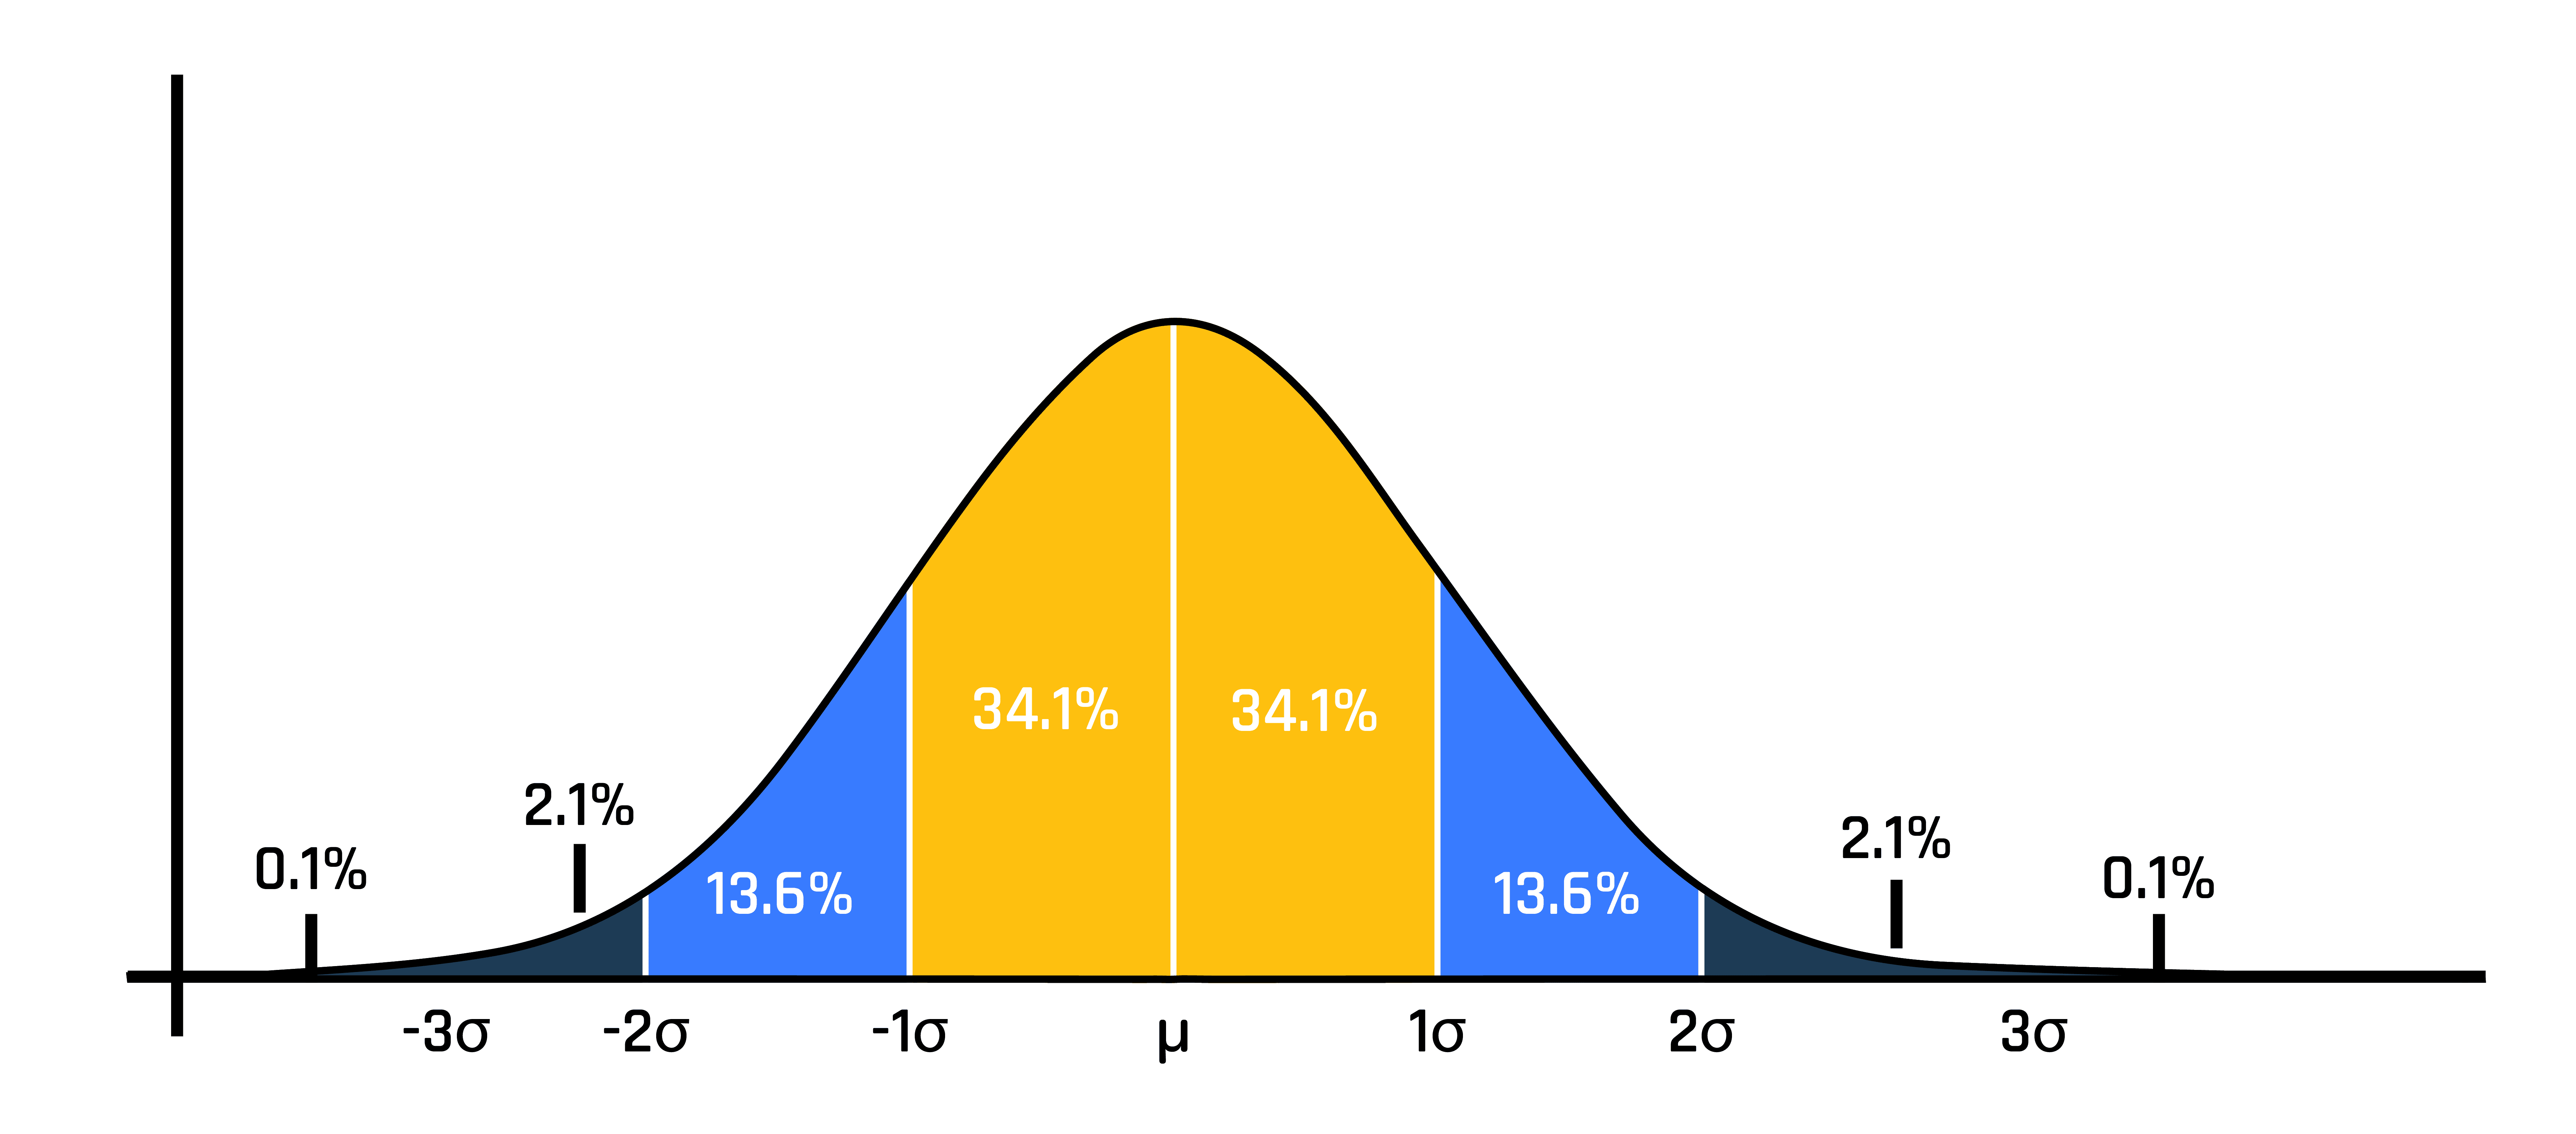
Here is a quick refresher:
The middle of the curve is the average of a population set and if we assume a normal distribution then,
68% of the data falls within one standard deviation of the mean.
95% of the data falls within two standard deviations of the mean.
7% of the data falls within three standard deviations of the mean.
Essentially, the Z-score gives us a sense of how far a data point is from the mean. It is a measure of how many standard deviations above or below the average that data point lies. For our purposes, the data point in question is the last price of a stock, index, ETF, or some other tradable.
Why should investors care?
Let's relate this back to the stock market. Here is a two-year, daily chart of the S&P 500 with a 200-day moving average (top panel) and the 200-period Z-score (bottom panel). I have used dashed lines to mark two standard deviations above and below the 200-day moving average.
We can see that in March 2020, the S&P 500 had a Z-score that was less than -4. The index was nearly four standard deviations below the 200-day day moving average...arguably extended to the downside.
As a counterpoint, more recently, in June and July, the S&P 500 was more than two standard deviations above the 200-day moving average. The high reading was 2.676.
Does that reading qualify as extended? In your stats class it probably does. In the market, it may not.
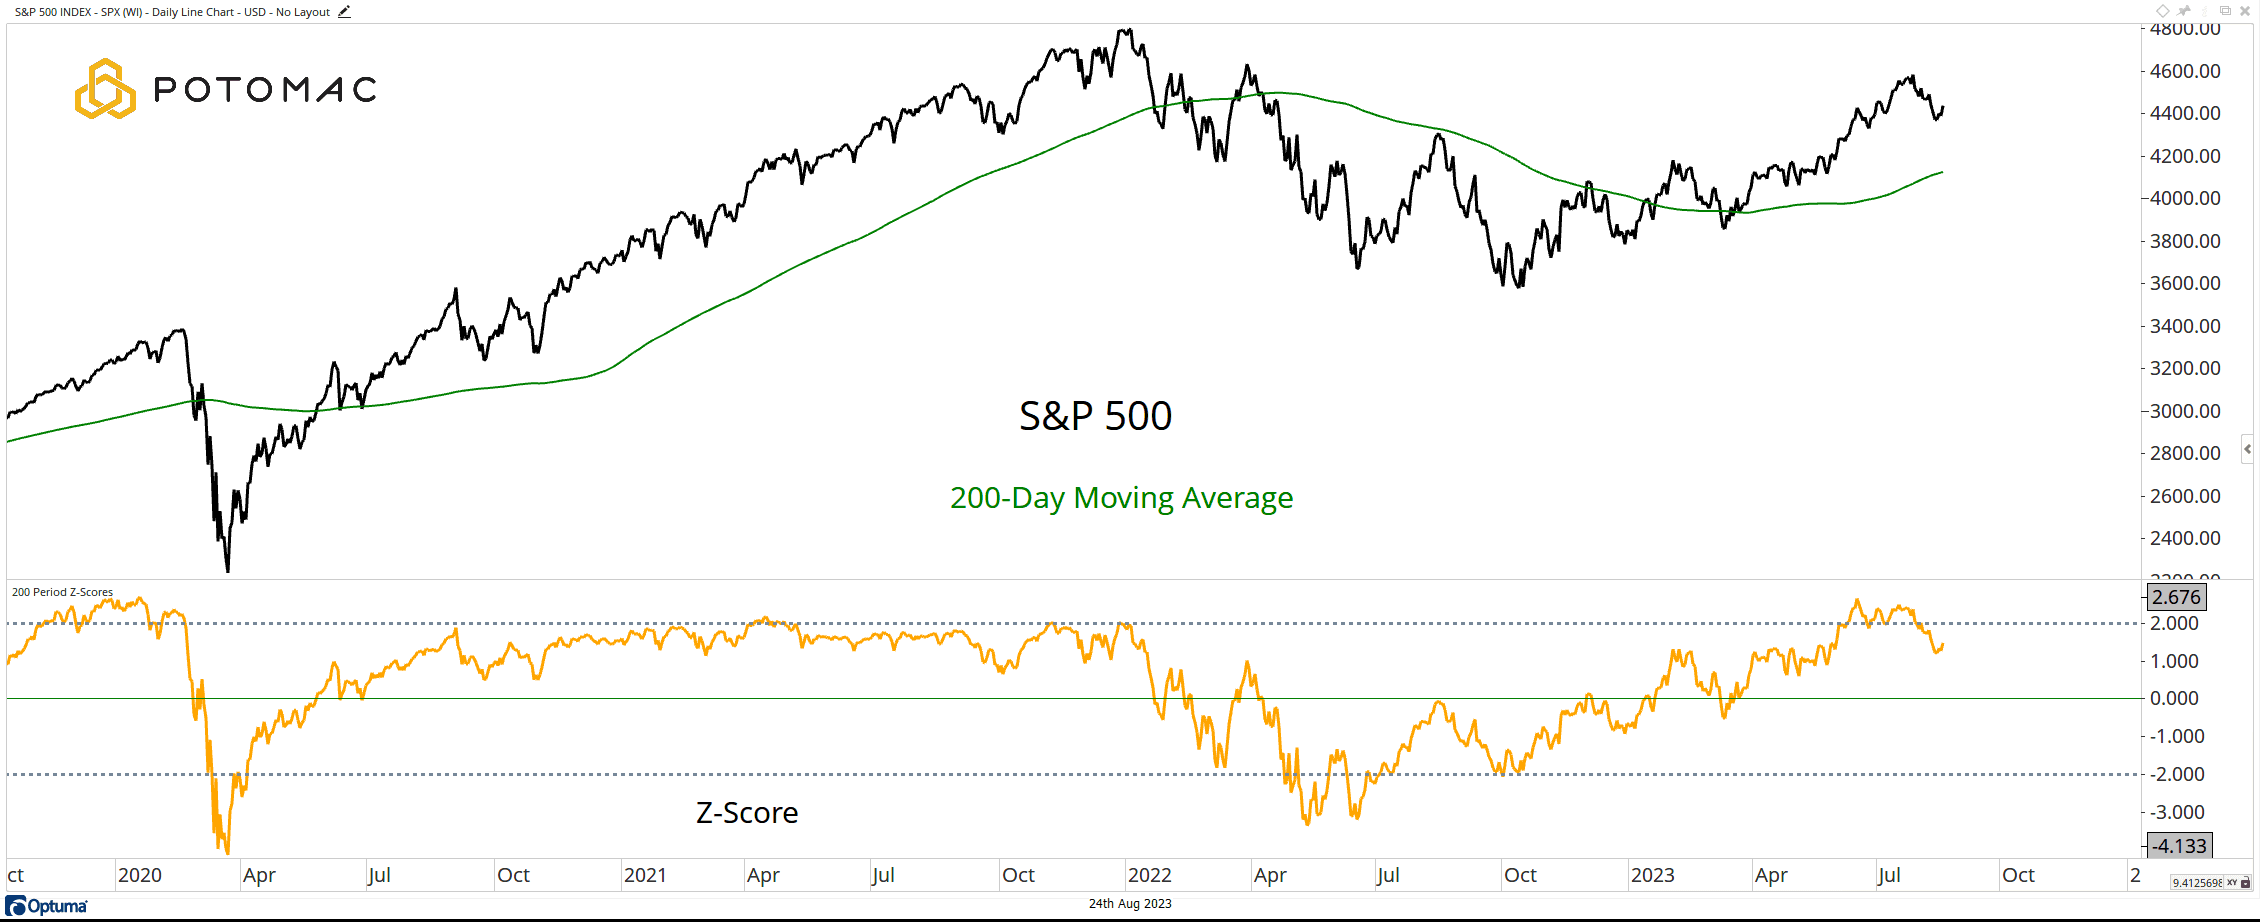
Chart as of August 24,2023
The question is, should investors become "defensive" simply because the S&P 500 is "extended" to the upside? Since January 1, 2000, there have been 96 instances of the 200-day Z-Score crossing above +2. Over the next 126 trading days (six-months) the index was higher 72% of the time for a median gain of 4.09%.
The chart below shows the median path of the index 30 days before the Z-Score crosses above +2 up to 126 days after the cross. A case can be made that blindly reducing exposure to the index simply because it is extended may not be in the best interest of the investor.
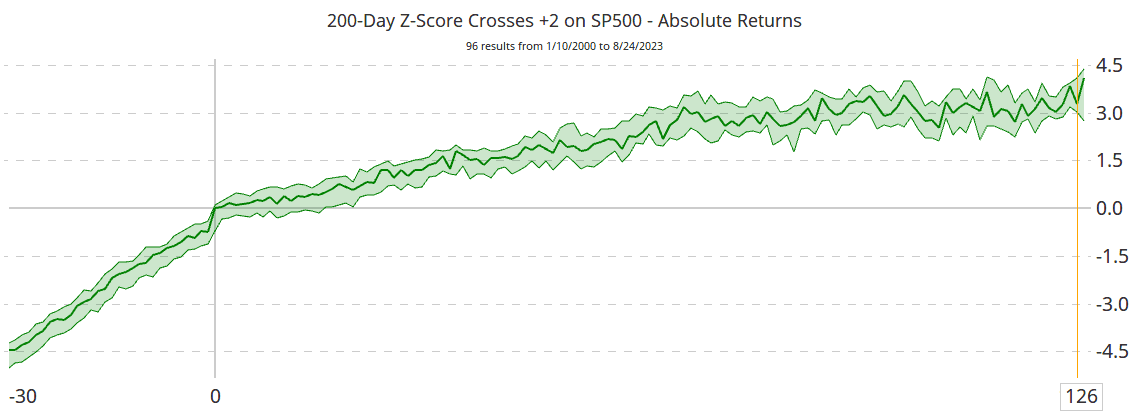
Data from Optuma
What about the downside? Since January 1, 2000, there have been 60 times when the 200-day Z-Score crossed below -2. The S&P 500 was higher 41.67% of the time 126 days later for a median loss of 3.72%.
Here is what the median path looks like. It seems that blindly buying extended downside reading is not a great idea either.
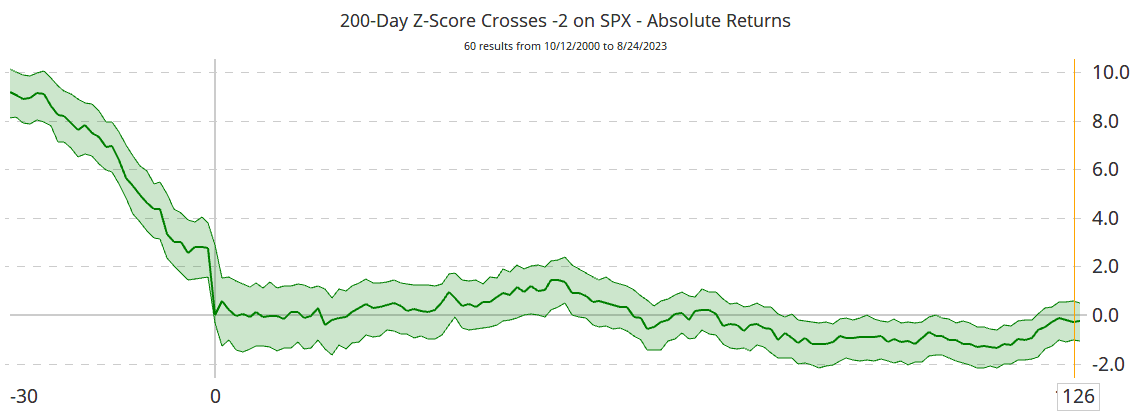
Data from Optuma
Assumptions Must be Made.
Unlike the normal distribution of the bell curve from class, where the average is fixed, in the market we are dealing with constant change.
In this case, the average is "moving", a 200-day moving average. In an upward trending market, it may not be uncommon to see the Z-score reach levels above + 2 quite often. In fact, it has happened a few times since the March 2020 low.
Likewise, strong downtrends are likely to produce extended readings to the downside. However, given the market's tendency to rise over time, more work can/should be done here. While -2 does not seem to be a good signal, perhaps -3 and -4 produce better results?
In addition, you could change the length of the moving average and come out with a completely different result. The choice of time frame is always up to the investor.
Finally, we must remember that stock prices are not normally distributed. The tails of the curve are "fat". The outliers happen more often than a normal distribution might predict. At face value, the concept of using the Z-Score to identify possible opportunities means that eventually a trade will be caught in a "fat tail" event.
Final Thoughts
The Z Score is a great tool but relies on the subjective interpretation of the end investor. As with any other technical indictor, it should be used within the context of the prevailing market trend and, ideally, there should be confirmation from other uncorrelated datapoints.


