The market is now pricing in one rate hike from the Federal Reserve at its March 2027 meeting. If that were to occur, it would come almost exactly 30 years after Fed Chair Alan Greenspan and the Federal Open Market Committee delivered a single rate hike in March 1997 as a “precautionary adjustment against potential future inflation pressures.” History does not always repeat itself, but it often rhymes.
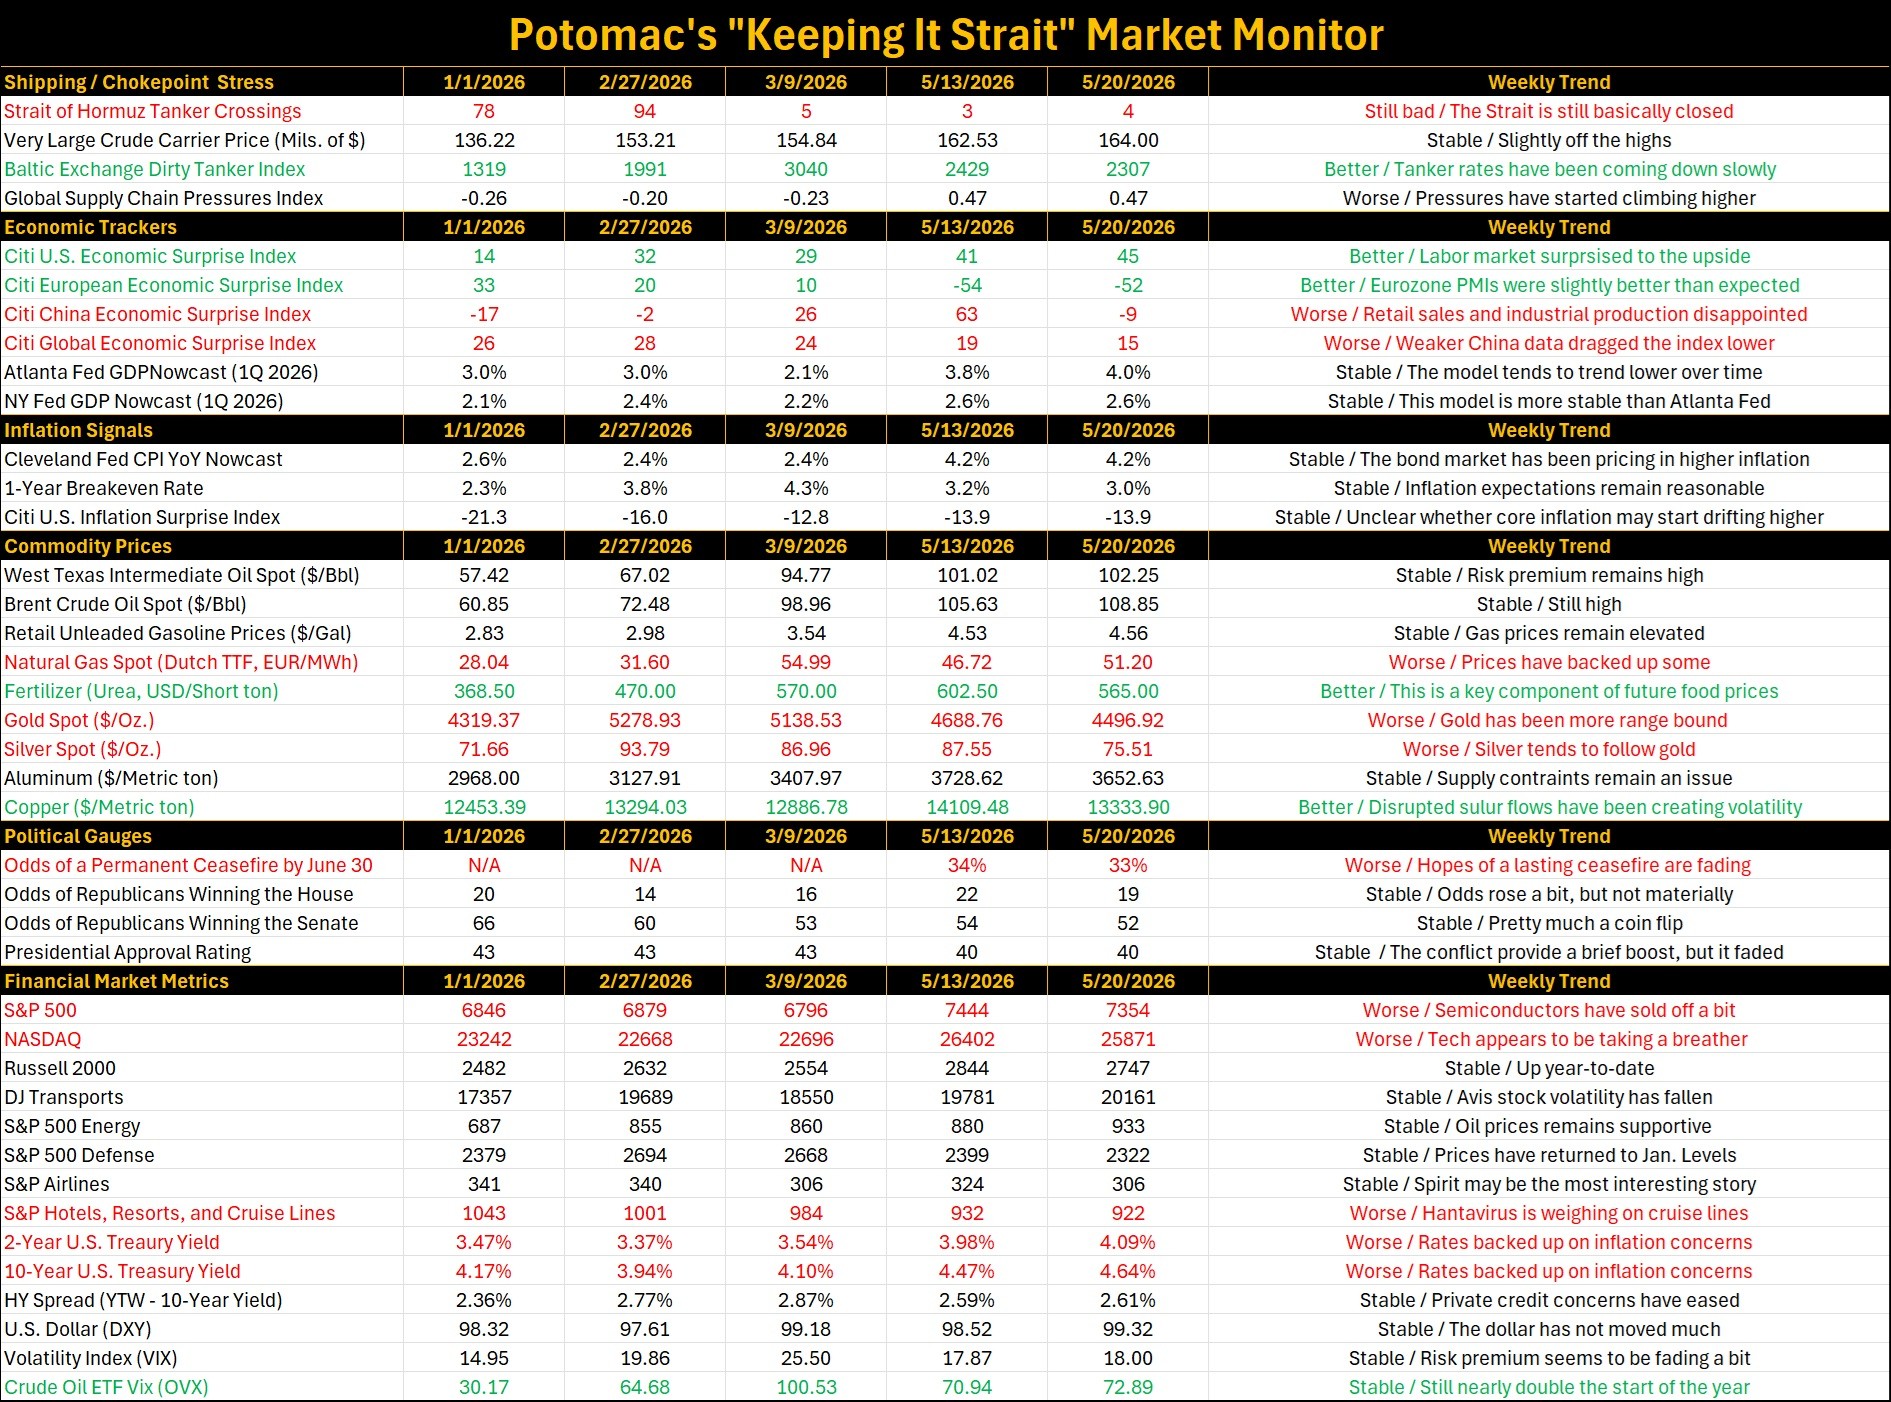
While not a formal policy framework, the Federal Reserve has historically tended to raise interest rates whenever nominal U.S. gross domestic product (GDP) growth approaches or exceeds 6%. In the first quarter of 2026, nominal GDP growth came in at exactly 6% year-on-year (see figure 1).
Figure 1. U.S. Nominal Gross Domestic Product vs. the Fed Funds Rate (%)
Sources: Bureau of Economic Analysis, Federal Reserve Board, and Potomac. Data as of 1Q 2026.
The reason this happens is simple. A nominal growth rate above 6%, meaning growth not adjusted for inflation, tends to signal that either economic demand is running too hot, inflation pressures are building beneath the surface, or both.
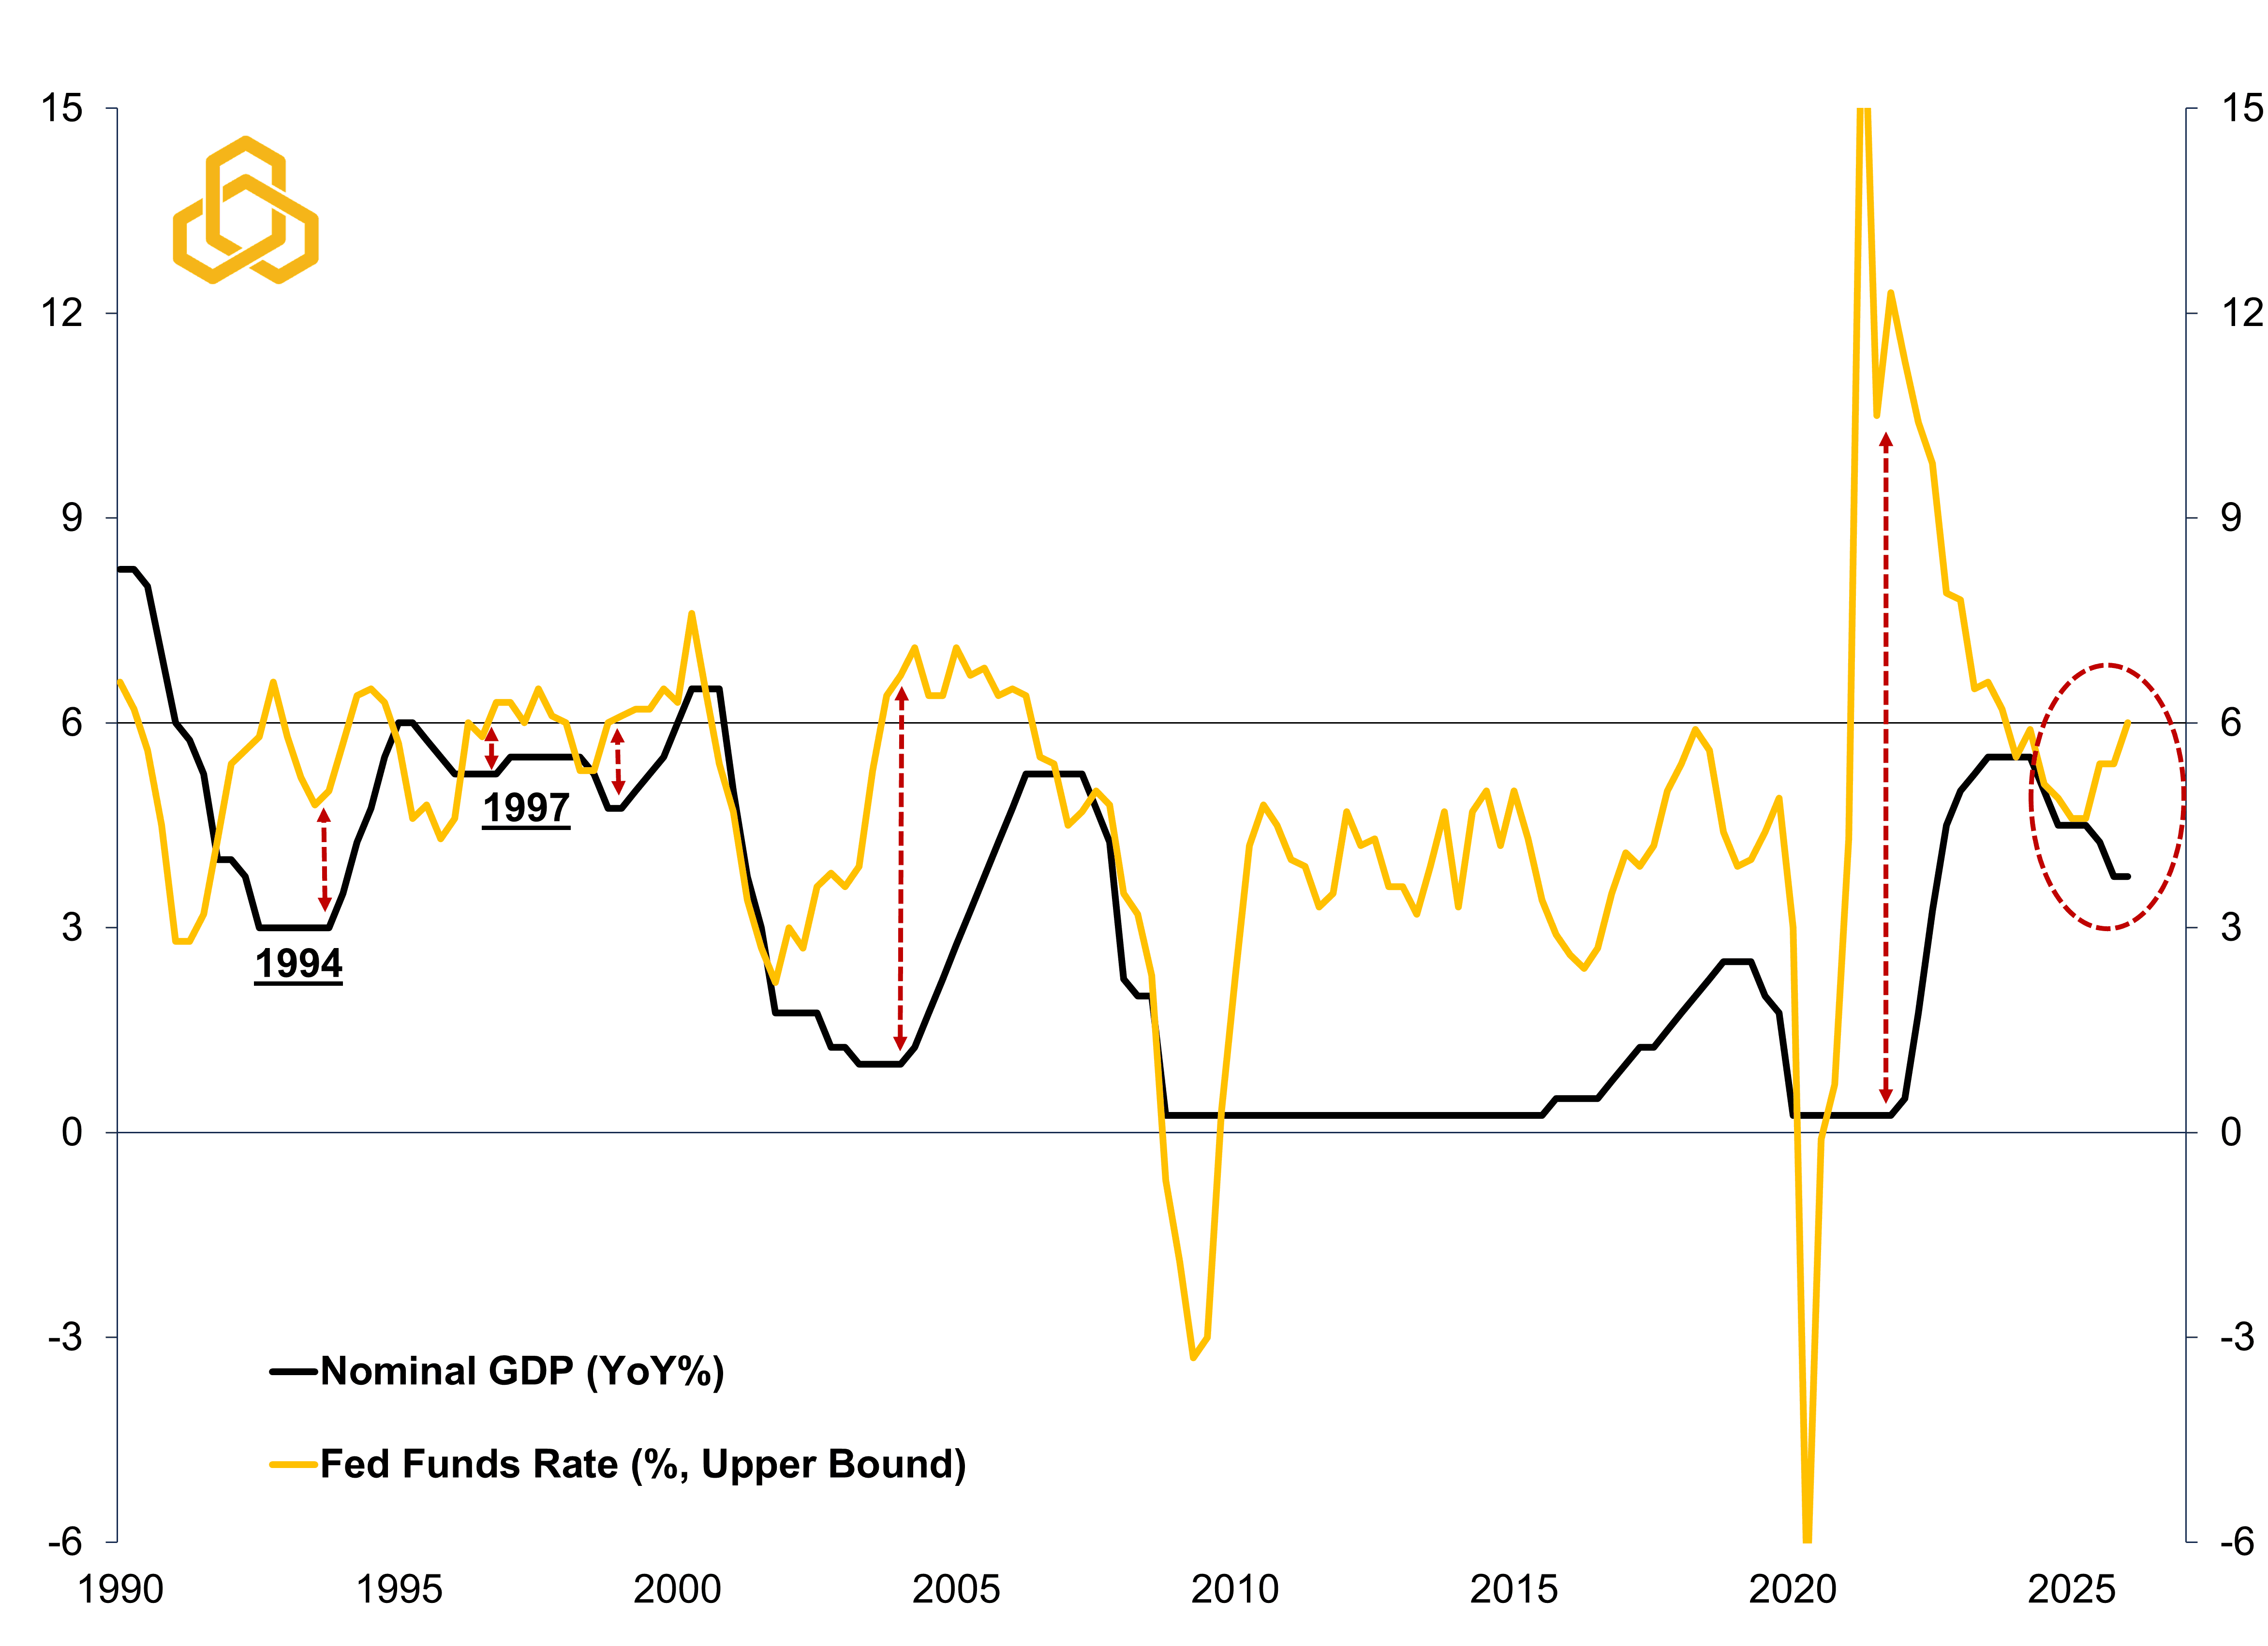
As things stand right now, the comparison to 1997 looks appropriate. The incoming Fed Chair Kevin Warsh seems likely to be wary of a series of rate hikes given President Trump’s wishes for lower rates and the spike in inflationary pressures appears to have more to do with temporary geopolitical disruptions than broad-based economic overheating. That should mean these pressures will fade over time, as they did in 1997 (see figure 2).
Figure 2. Fed Funds Rate vs. Crude Oil Prices (Jan. 1996 – Jan. 1998)
Sources: Federal Reserve Board of Governors, Wall Street Journal, and Potomac. Data as of December 31, 1998.
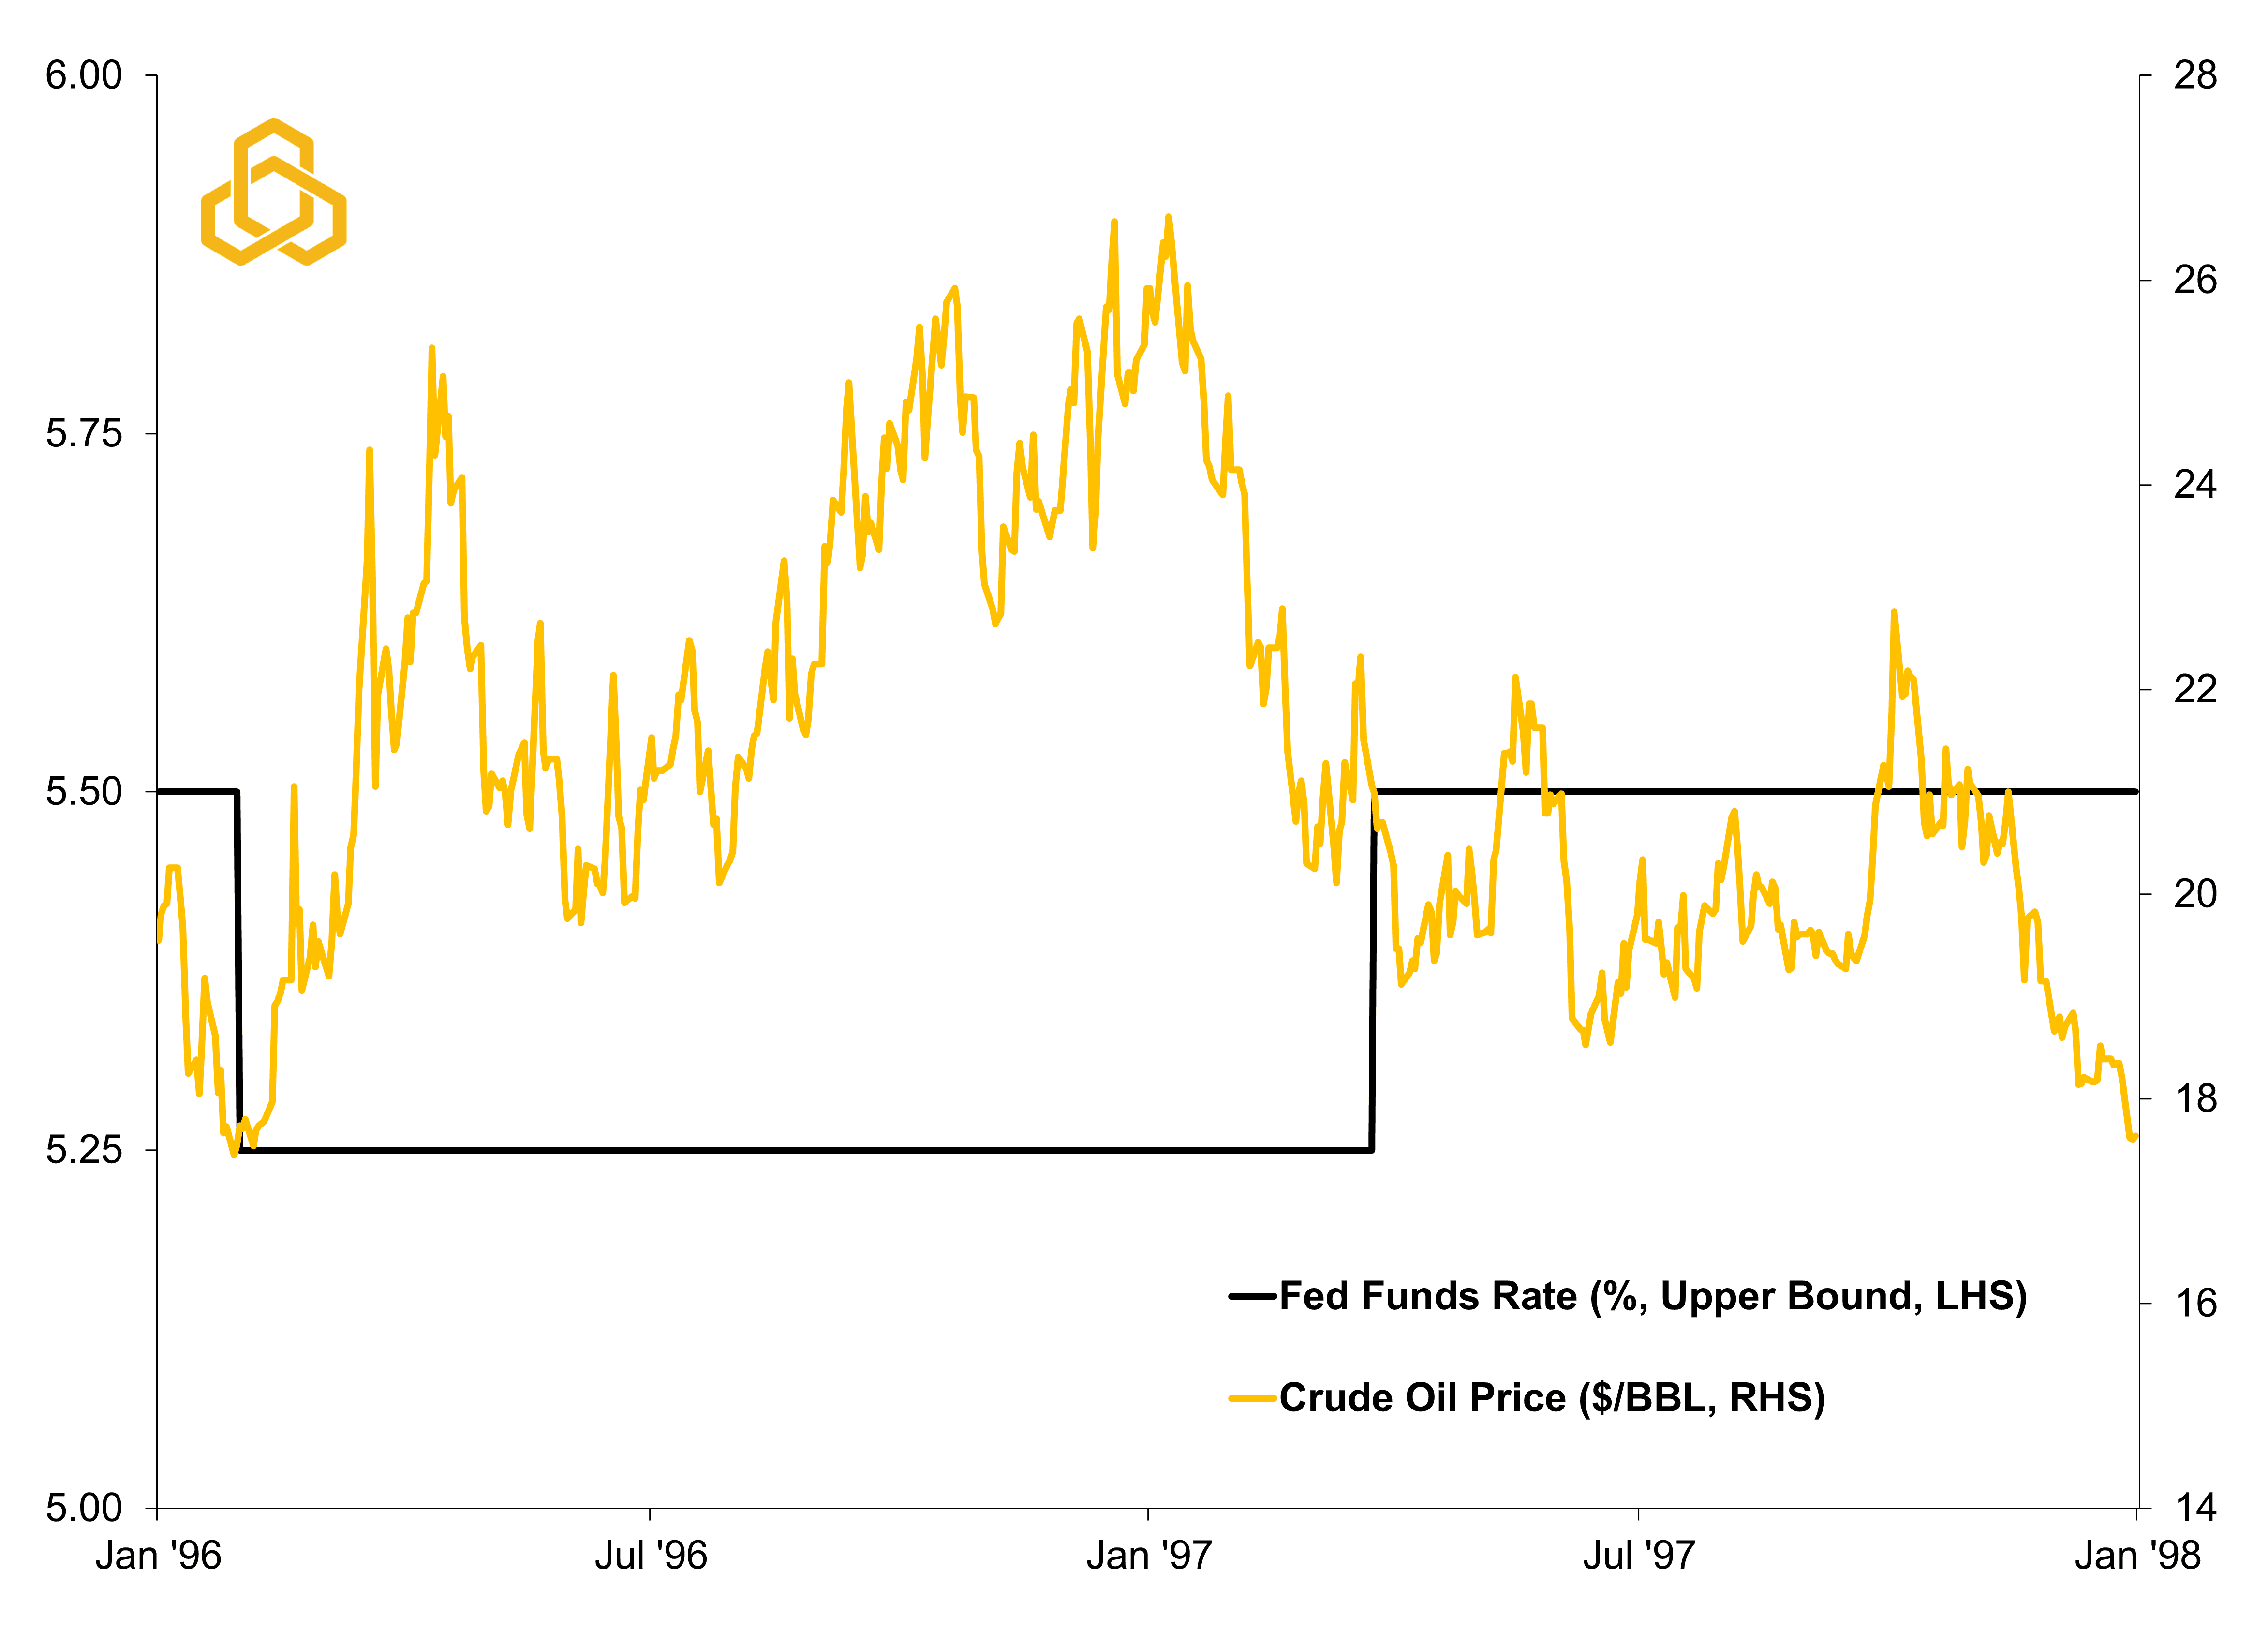
This would be consistent with our base case. It also aligns with long-term inflation expectations like the 5-year, 5-year forward inflation swap, the Fed’s preferred market-based long-term inflation expectations gauge, which has shown little movement when compared to 2020 (see figure 3). As a reminder, the 5-year, 5-year is the bond market’s estimate of what average inflation will be over a 5-year period that begins 5 years from today.
Figure 3. 5-Year, 5-Year Forward Inflation Expectation Rate (%)
Sources: Bloomberg L.P. and Potomac. Data as of May 15, 2026.
We would also highlight that 1997 was a lot like today’s backdrop. The Fed was more data-dependent than pre-emptive and the late 1990s technology boom was seen as an avenue to generate productivity gains that would allow the economy to grow at a faster rate without generating persistently higher inflation. Sound familiar?
This historical example may be one of the reasons that investors seem to believe that any rate hike would more likely resemble a one-time “insurance hike” than the beginning of a sustained tightening cycle (see figure 4).
Figure 4. Fed Funds Target Rate Probabilities for March 17, 2027 FOMC Meeting
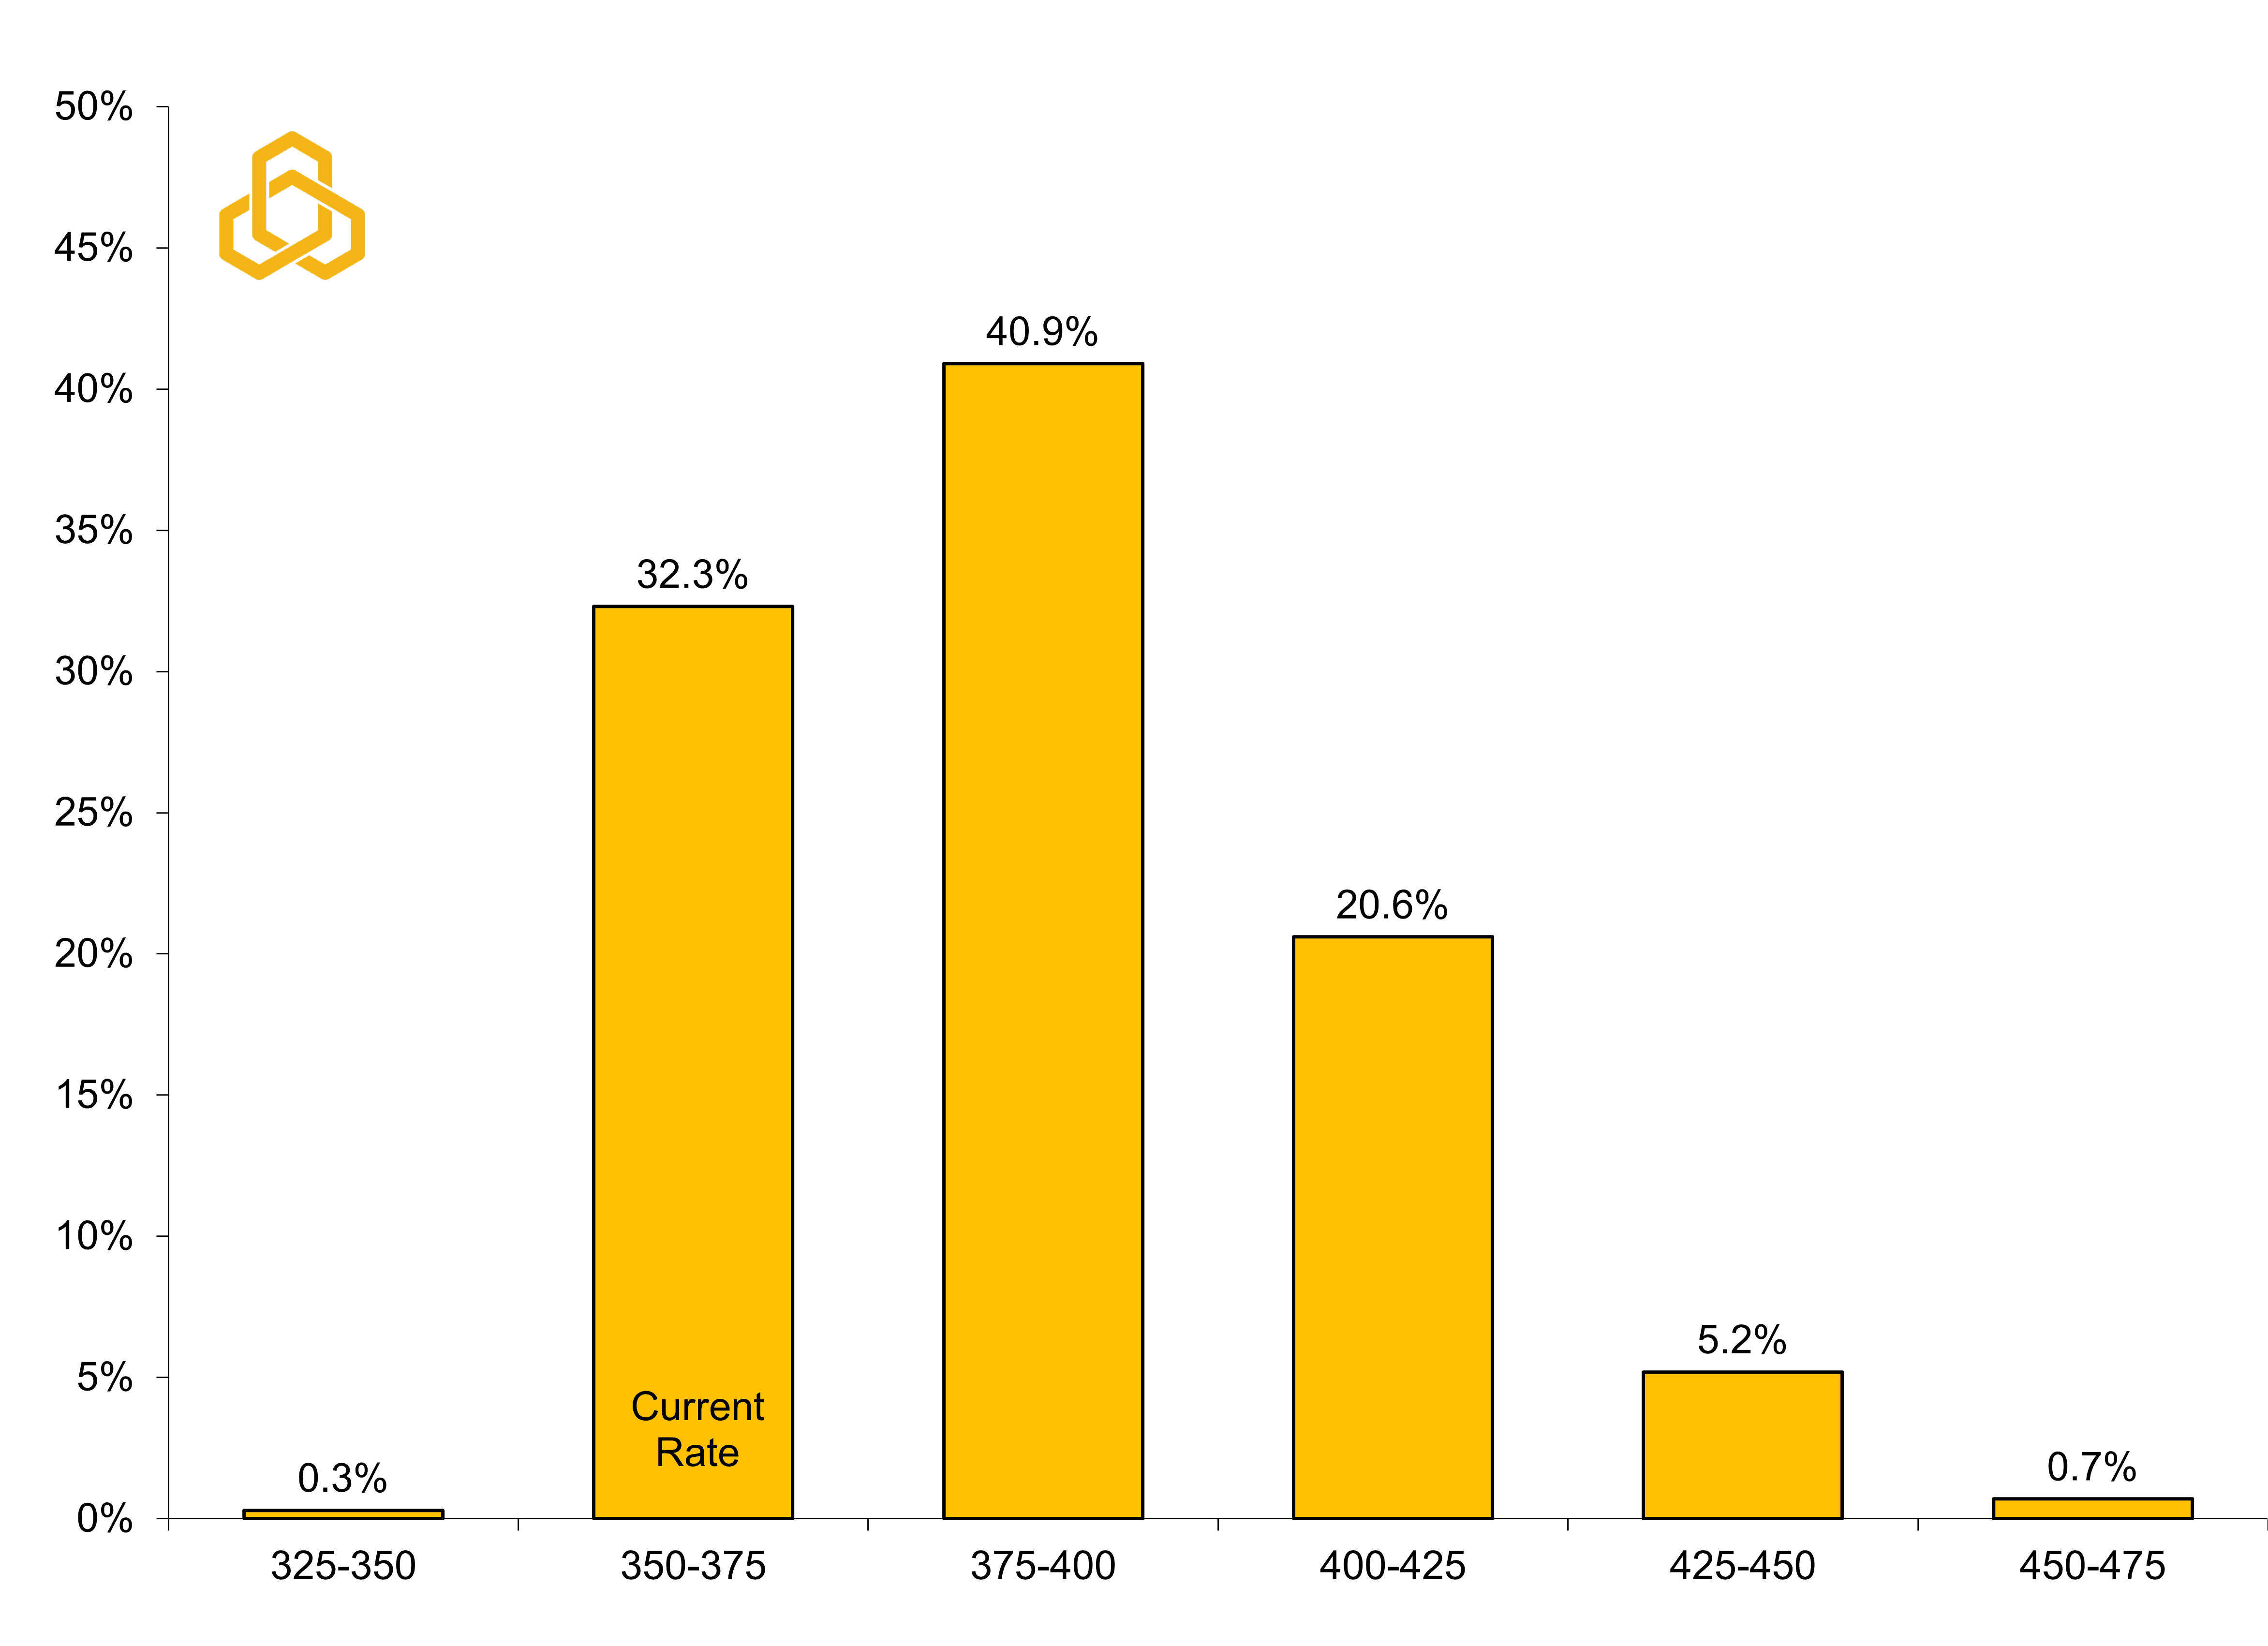
Sources: CME Group and Potomac. Data as of May 15, 2026. All forecasts are expressions of opinions and are subject to change without notice and are not intended to be a guarantee.
Still, it would be naïve to ignore what happened just a few years prior to 1997. In 1994, nominal GDP also headed north of 6% on the back of rapid GDP growth and the central bank shocked markets with seven rate hikes for a total of 300 basis points (3%) to ward off potential inflationary pressures. In response, bond yields rose sharply as the “bond vigilantes” demanded a higher term premium to compensate for long-term inflation risk (see figure 5).
Figure 5. Fed Funds Rate vs. 10-Year U.S. Treasury Yield (Jan. 1994 – Jan. 1995)
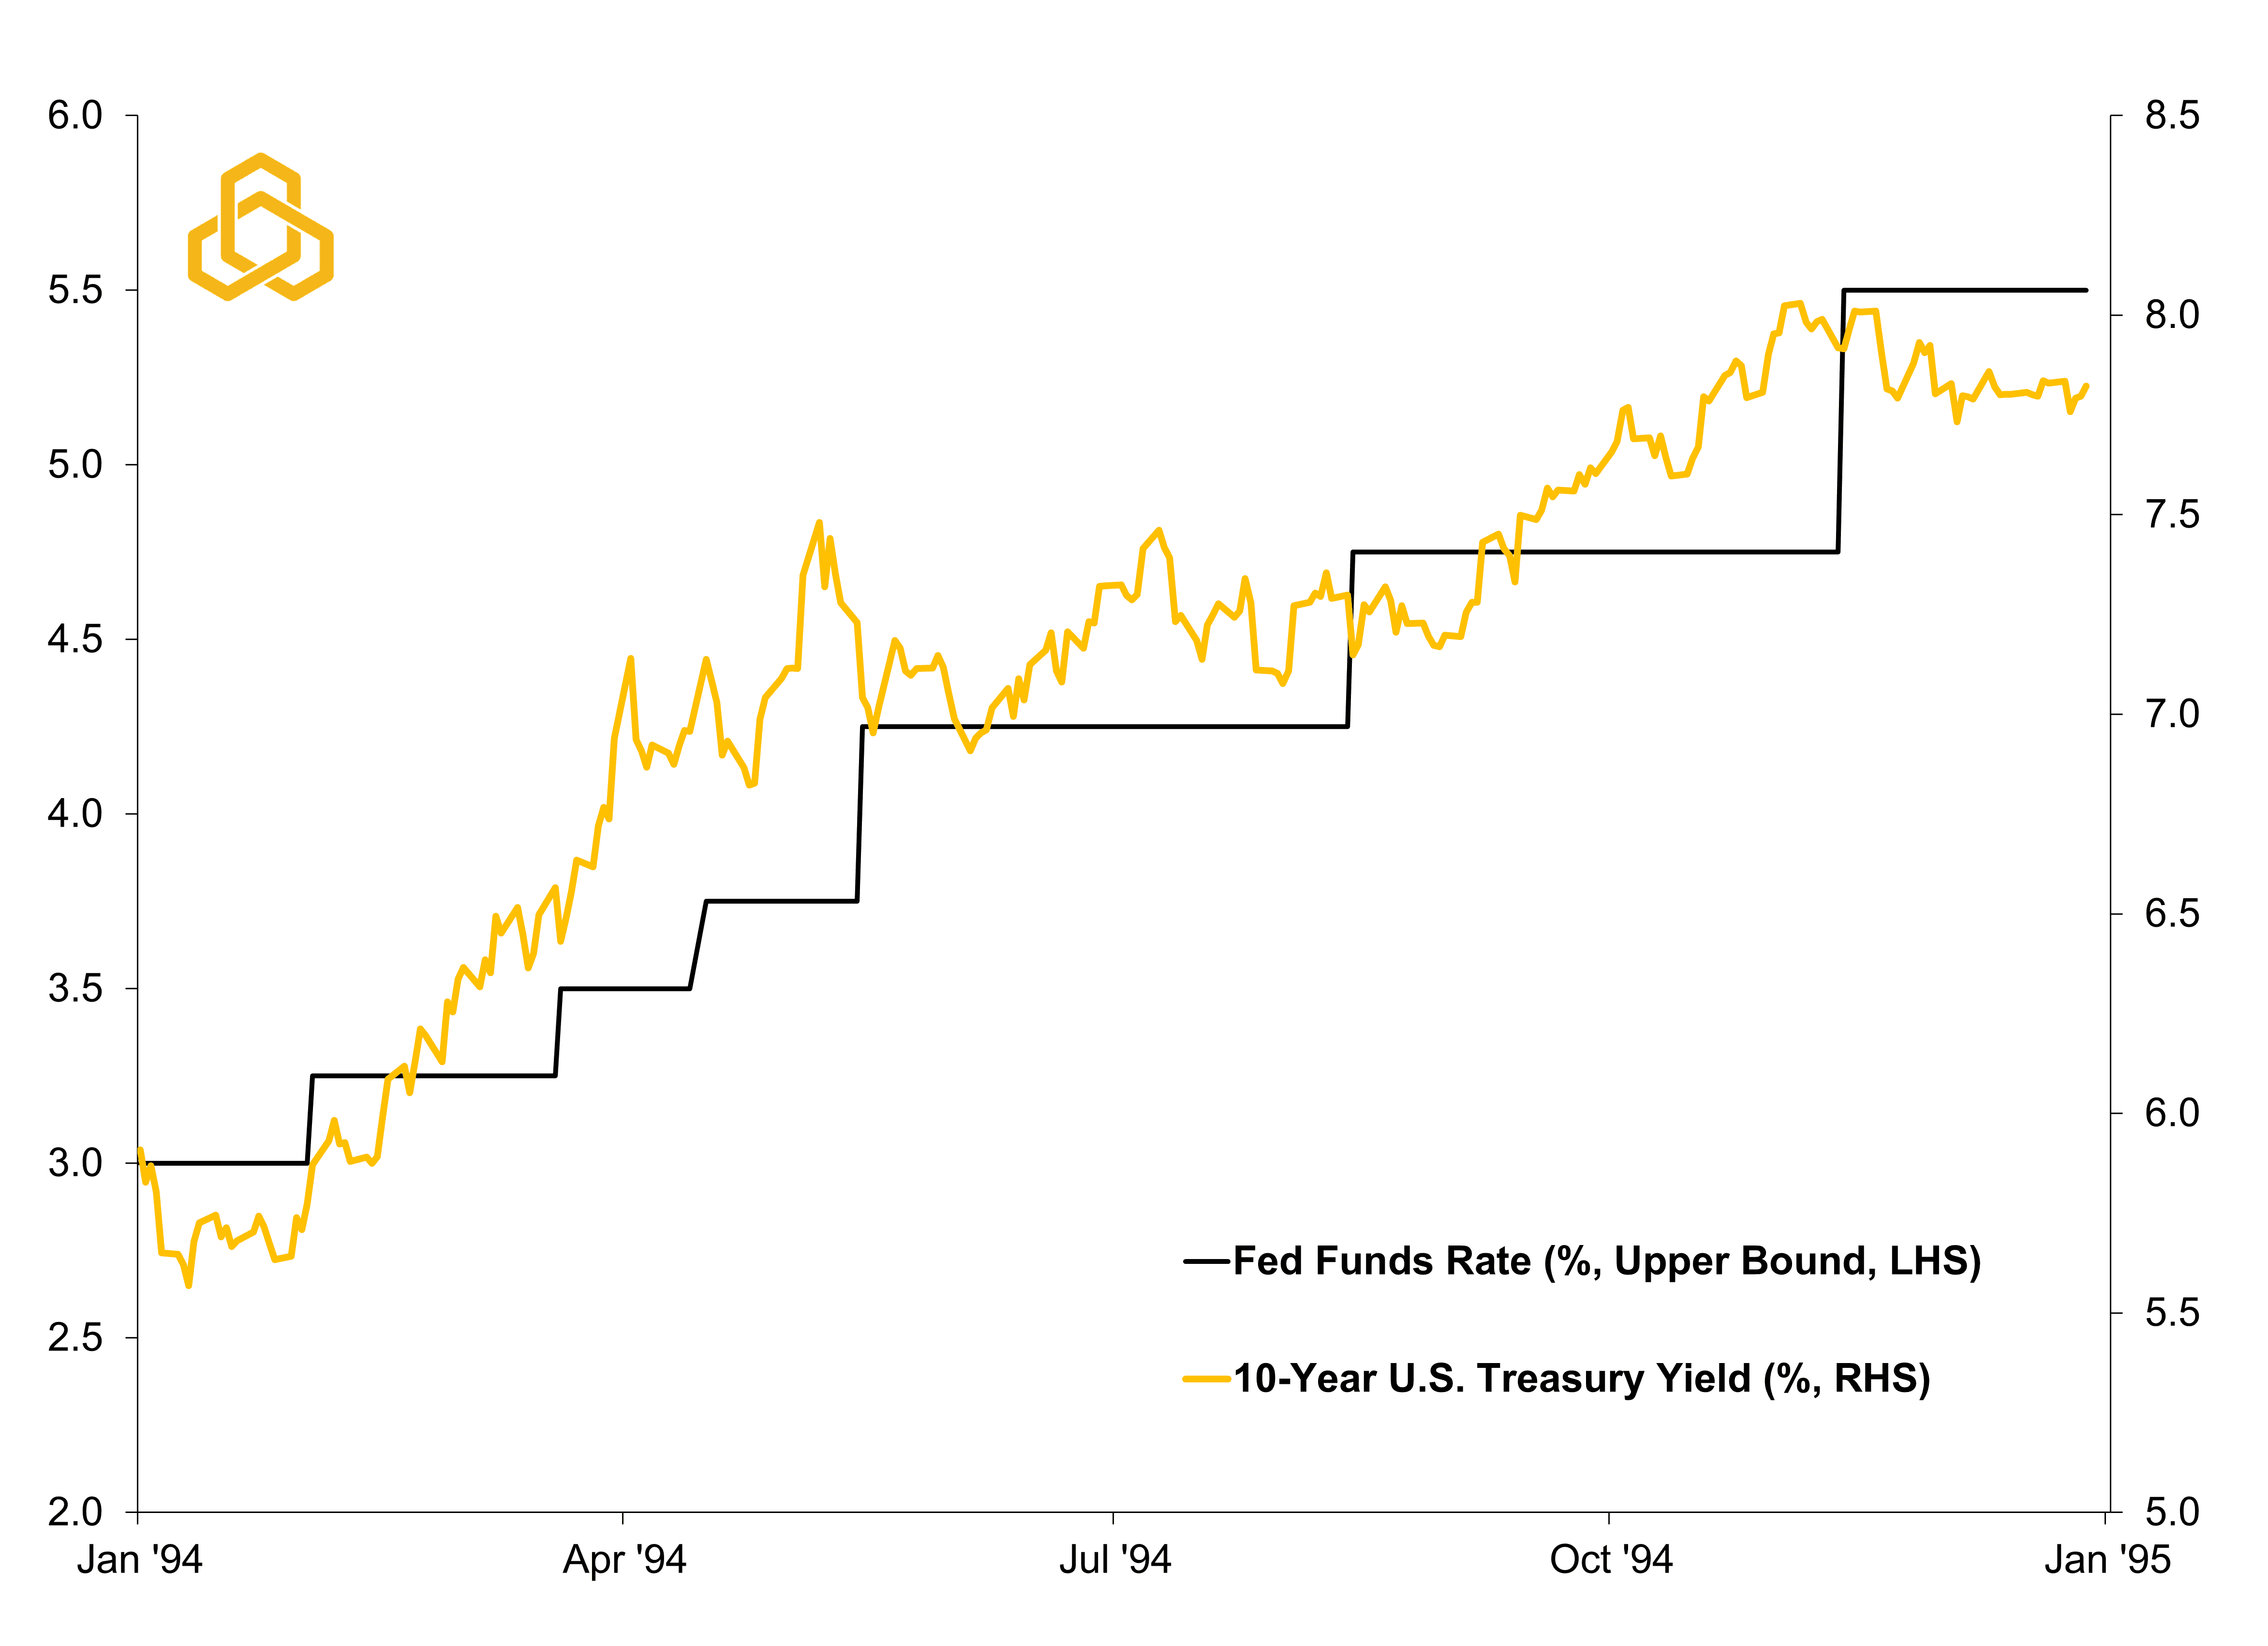
Sources: CME Group and Potomac. Data as of May 15, 2026. All forecasts are expressions of opinions and are subject to change without notice and are not intended to be a guarantee.
If history is any guide, the distinction between 1994 and 1997 will likely come down to whether inflation expectations remain anchored. In 1997, productivity gains and fading commodity pressures allowed the economy to continue expanding without generating persistently higher inflation. In 1994, strong nominal growth and rising bond yields created fears that inflationary pressures were becoming more embedded beneath the surface.
That distinction matters for investors because inflation-driven tightening cycles tend to create a very different market environment than traditional growth slowdowns. During inflation scares, stocks and bonds often become positively correlated as both asset classes come under pressure from rising yields and higher term premia simultaneously. This dynamic is what made 2022 such a difficult year for investors in a typical 60% stocks / 40% bonds portfolio as both sides experienced negative returns.
In other words, the traditional diversification benefits of fixed income can become less reliable precisely when investors expect them to provide protection. Please see our “Bear Market in Diversification” piece for additional insights.
For now, markets still appear to believe the economy is following something closer to the 1997 path. However, the same technology-driven investment boom supporting corporate earnings may also be contributing to the stronger nominal growth that is increasingly making bond markets uncomfortable. If nominal growth remains elevated as the recent industrial production data suggest (see figure 6) and inflation expectations begin drifting even higher, markets may increasingly find themselves confronting a backdrop that looks less like 1997 and more like the 1994 scenario where the bond market begins testing the credibility of the new Fed chair. Welcome back to the Fed Mr. Warsh.
Figure 6. Industrial Production vs U.S. Nominal Gross Domestic Product (YoY%)
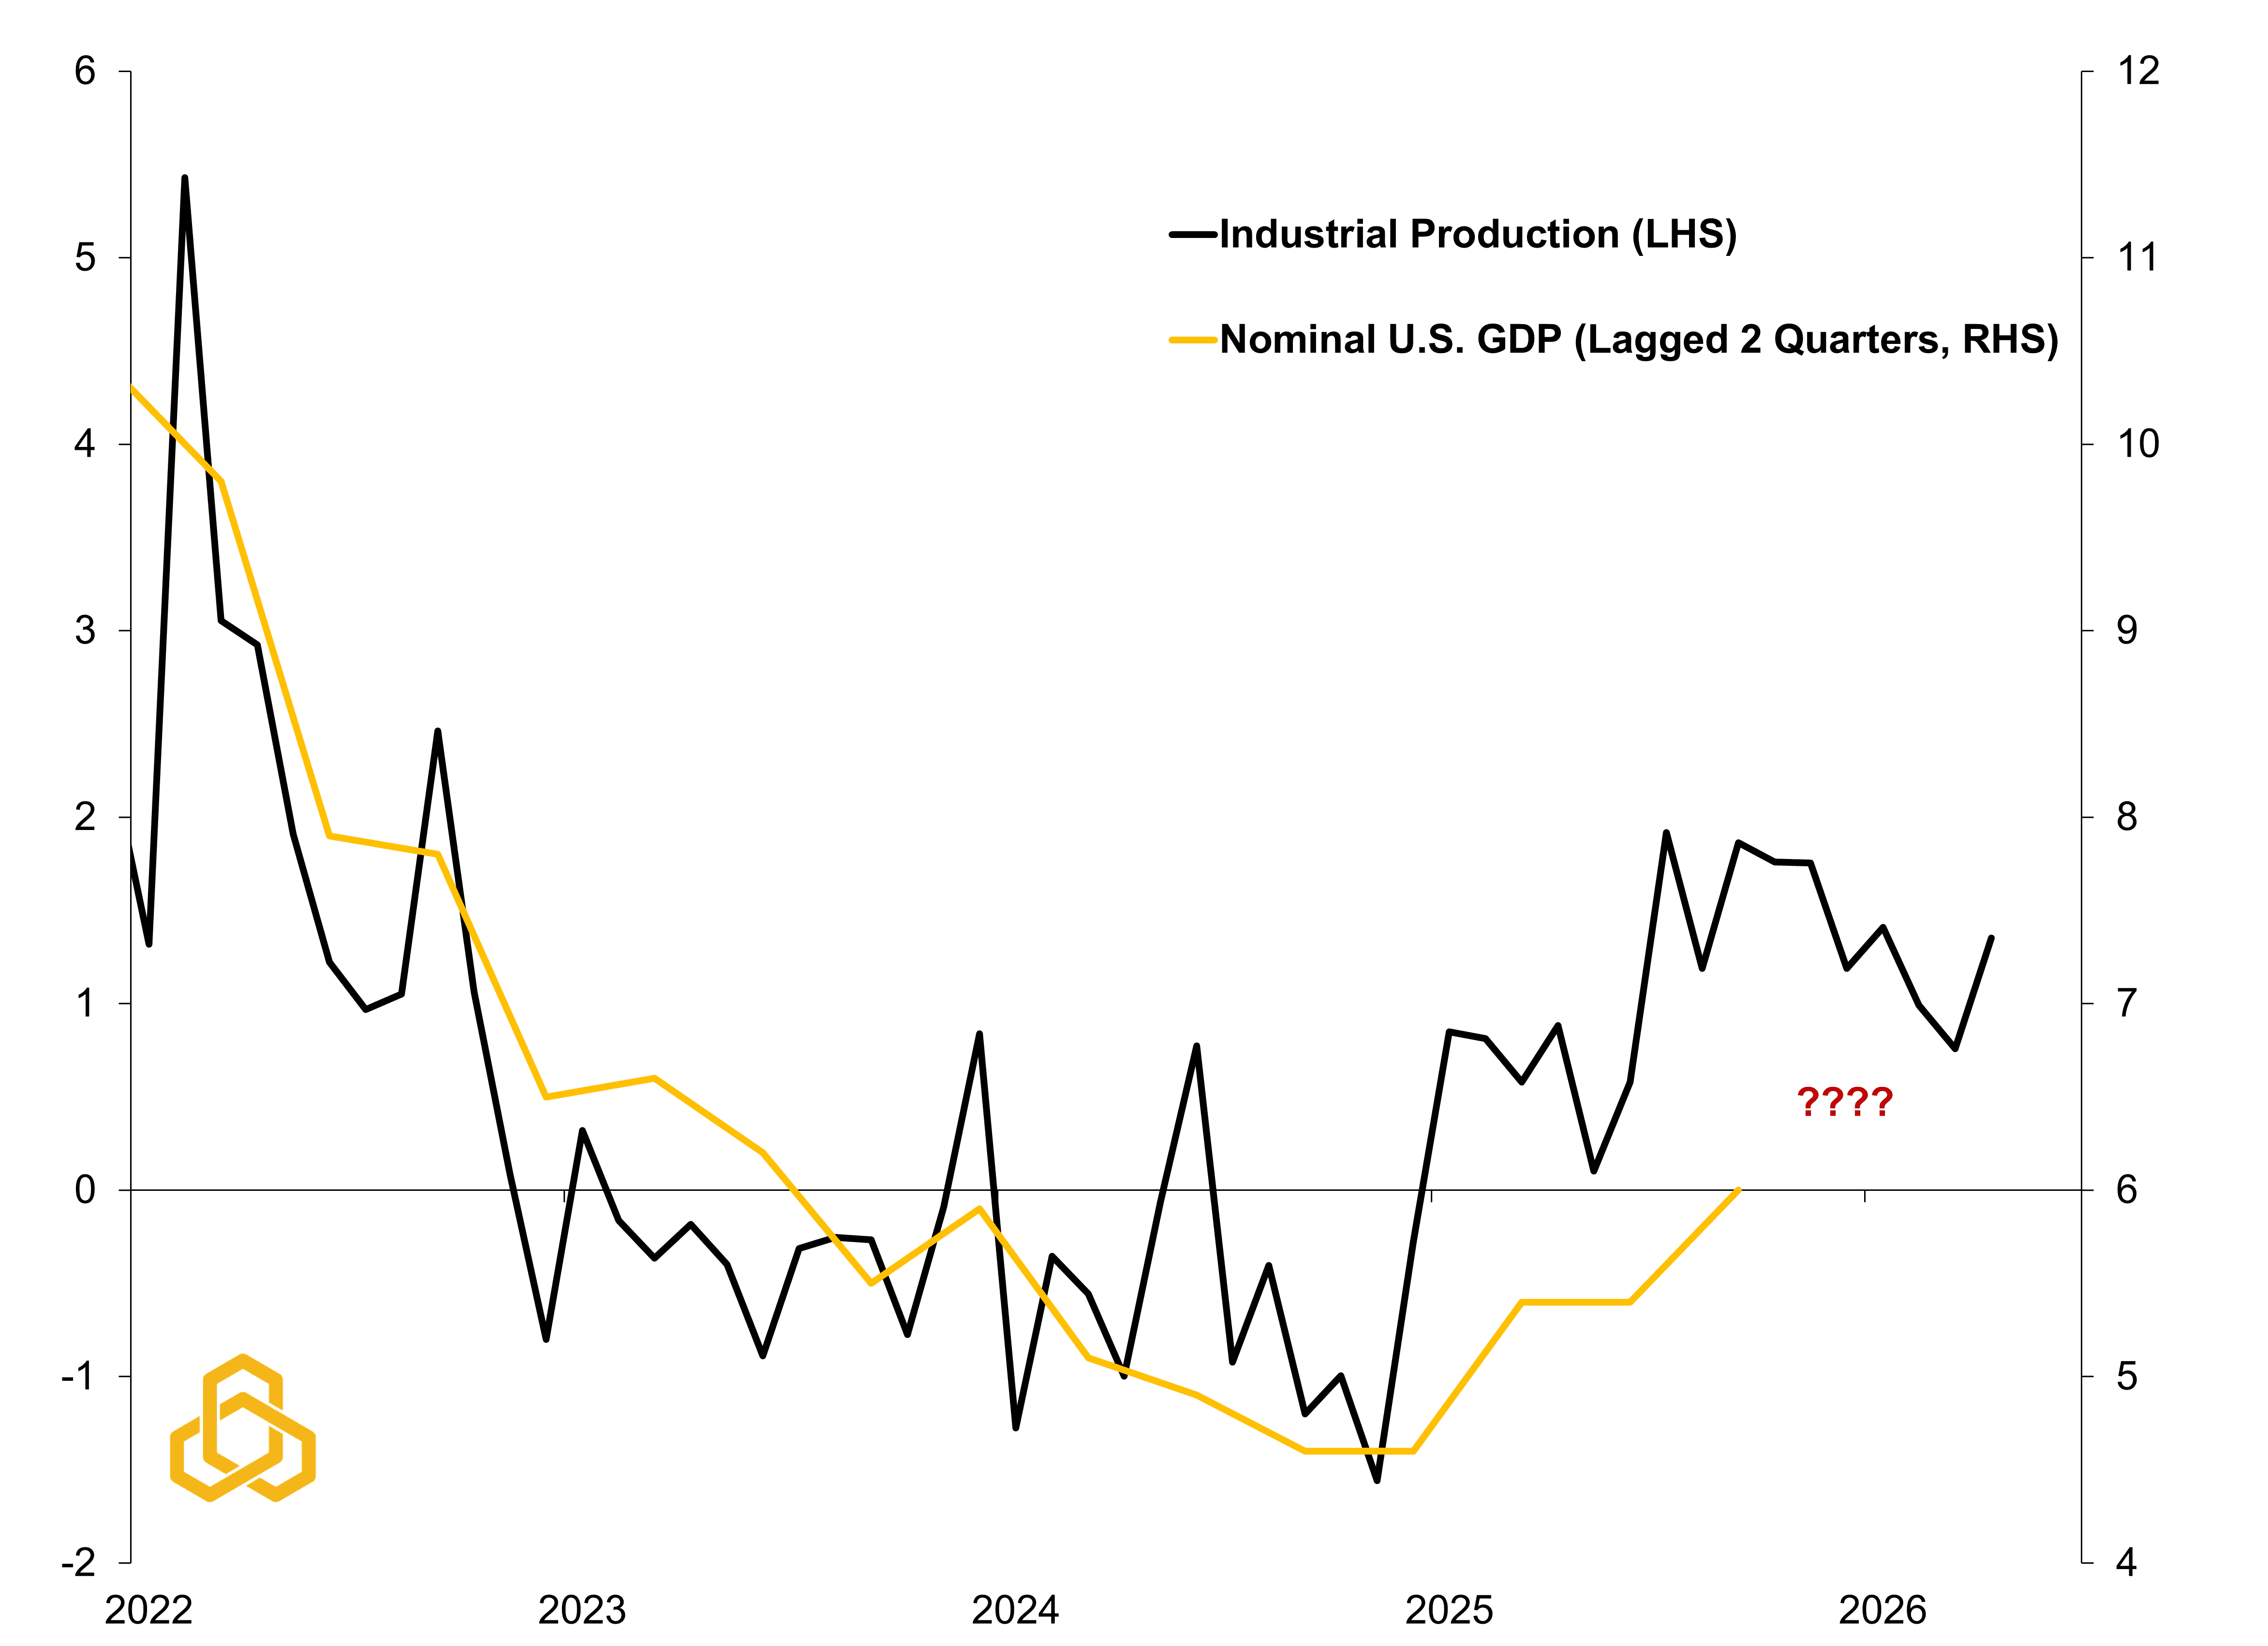
Sources: Federal Reserve Board of Governors, Bureau of Economic Analysis, Bloomberg L.P., and Potomac. Data as of April 2026 for Industrial Production and 1Q 2026 for Nominal U.S. GDP.
Weekly “Keeping it Strait” Highlights:
The Strait of Hormuz remains closed. According to Polymarket, the odds of a permanent ceasefire by June 30 have now fallen to just 33%.
Economic data in China came in weaker-than-expected with retail sales and industrial production missing expectations.
Globally, sovereign bond yields have risen on rising inflation expectations. The 10-year U.S. Treasury yield has climbed about 0.7% since the start of the war. Essentially removing two rate cuts from the Federal Reserve. A hike in 2027 is now a very real prospect.