No one likes debt, but nearly everyone has it. Over the next three weeks, we will examine the debt profiles of the three largest parts of the U.S. economy: consumers, corporations, and the federal government. Let’s start with the almighty U.S. consumer.
Consumer spending remains the stalwart of the U.S. economy, accounting for roughly 70% of the nation's economic output. Consumer spending is also the primary driver of corporate earnings, and corporate earnings are the primary driver of the stock market, so it matters to investors. A lot.
That makes the unexpected weakness in July retail sales worth watching. Headline sales fell 0.6% during the month, while sales excluding autos and gasoline declined 0.2%. Some of the weakness likely reflected Amazon moving Prime Day from July into June, along with the boost from outsized tax refunds during the first half of the year starting to fade. This could be concerning, but the timelier Johnson Redbook weekly retail sales data appear to have stabilized following the recent slowdown and remain above their two-year average. We find this encouraging.
Figure 1. Johnson Redbook Weekly Same-Store Sales (YoY%)

Sources: Redbook Research, Bloomberg L.P., and Potomac. Data as of August 8, 2026.
Even with the stabilization in the weekly data, July's weakness could shave off 0.6 percentage point from third-quarter real GDP growth according to the Atlanta Fed’s GDPNow tracker.
That said, one month of weaker retail sales is not enough to conclude that consumers are running out of money. Retail sales can be volatile, cover only 30% of overall consumption, and can be influenced by the timing of promotions and changes in prices.
The more important question is whether spending is simply returning to a more normal pace or whether households are pulling back as they come under pressure?
The Other Side of the Balance Sheet
On an aggregate basis, there is little evidence that household debt is becoming a serious constraint.
U.S. household debt as a percentage of GDP remains well below the levels that preceded the Global Financial Crisis and continues to trend lower. Household debt-service payments as a percentage of disposable personal income also remain manageable and below their pre-COVID level.
Figure 2. Household and Nonprofit Organizations Debt (% of GDP)

Sources: Federal Reserve Board of Governors, Bureau of Economic Analysis, National Bureau of Economic Research, Bloomberg L.P., and Potomac. Data as of 2Q 2026. Note: Shaded regions denote periods of U.S. recession.
Figure 3. Household Debt Service Payments (% of Disposable Personal Income)

Sources: Federal Reserve Board of Governors, Bureau of Economic Analysis, National Bureau of Economic Research, Bloomberg L.P., and Potomac. Data as of 2Q 2026. Note 1: The Household Debt Service Payment Ratio (DSR) measures the share of a household’s total required debt payments relative to its disposable personal income. It is a key indicator of household financial stress, as it shows how much of a family’s income is going toward servicing debt. Note 2: Shaded regions denote periods of U.S. recession.
Under the hood, however, the picture is considerably more bifurcated.
The top 1% of the income distribution holds nearly one-third of all household assets, while the bottom 50% carries roughly one-third of all household liabilities. That leaves the bottom half of the income distribution much more sensitive to higher interest rates, borrowing costs, and even a modest deterioration in the labor market.
The divide has also widened since the Global Financial Crisis, with little sign of the trend reversing. The top 1%'s share of total household assets has risen from roughly 20% in 1990 to almost 30% today, while the share held by the bottom 50% has declined.
With stocks near record highs, the concentration of household assets among higher-income consumers should continue to support aggregate spending even if lower-income households become more cautious.
This helps explain how overall consumer spending can remain healthy while some families struggle to keep up with higher prices and borrowing costs.
Figure 4. Share of Household Assets and Liabilities by Income Percentile (%)

Sources: Federal Reserve Board of Governors, Bloomberg L.P., and Potomac. Data as of 1Q 2026.
Figure 5. Share of Total Assets by Income Percentile vs. U.S. Recession (%)
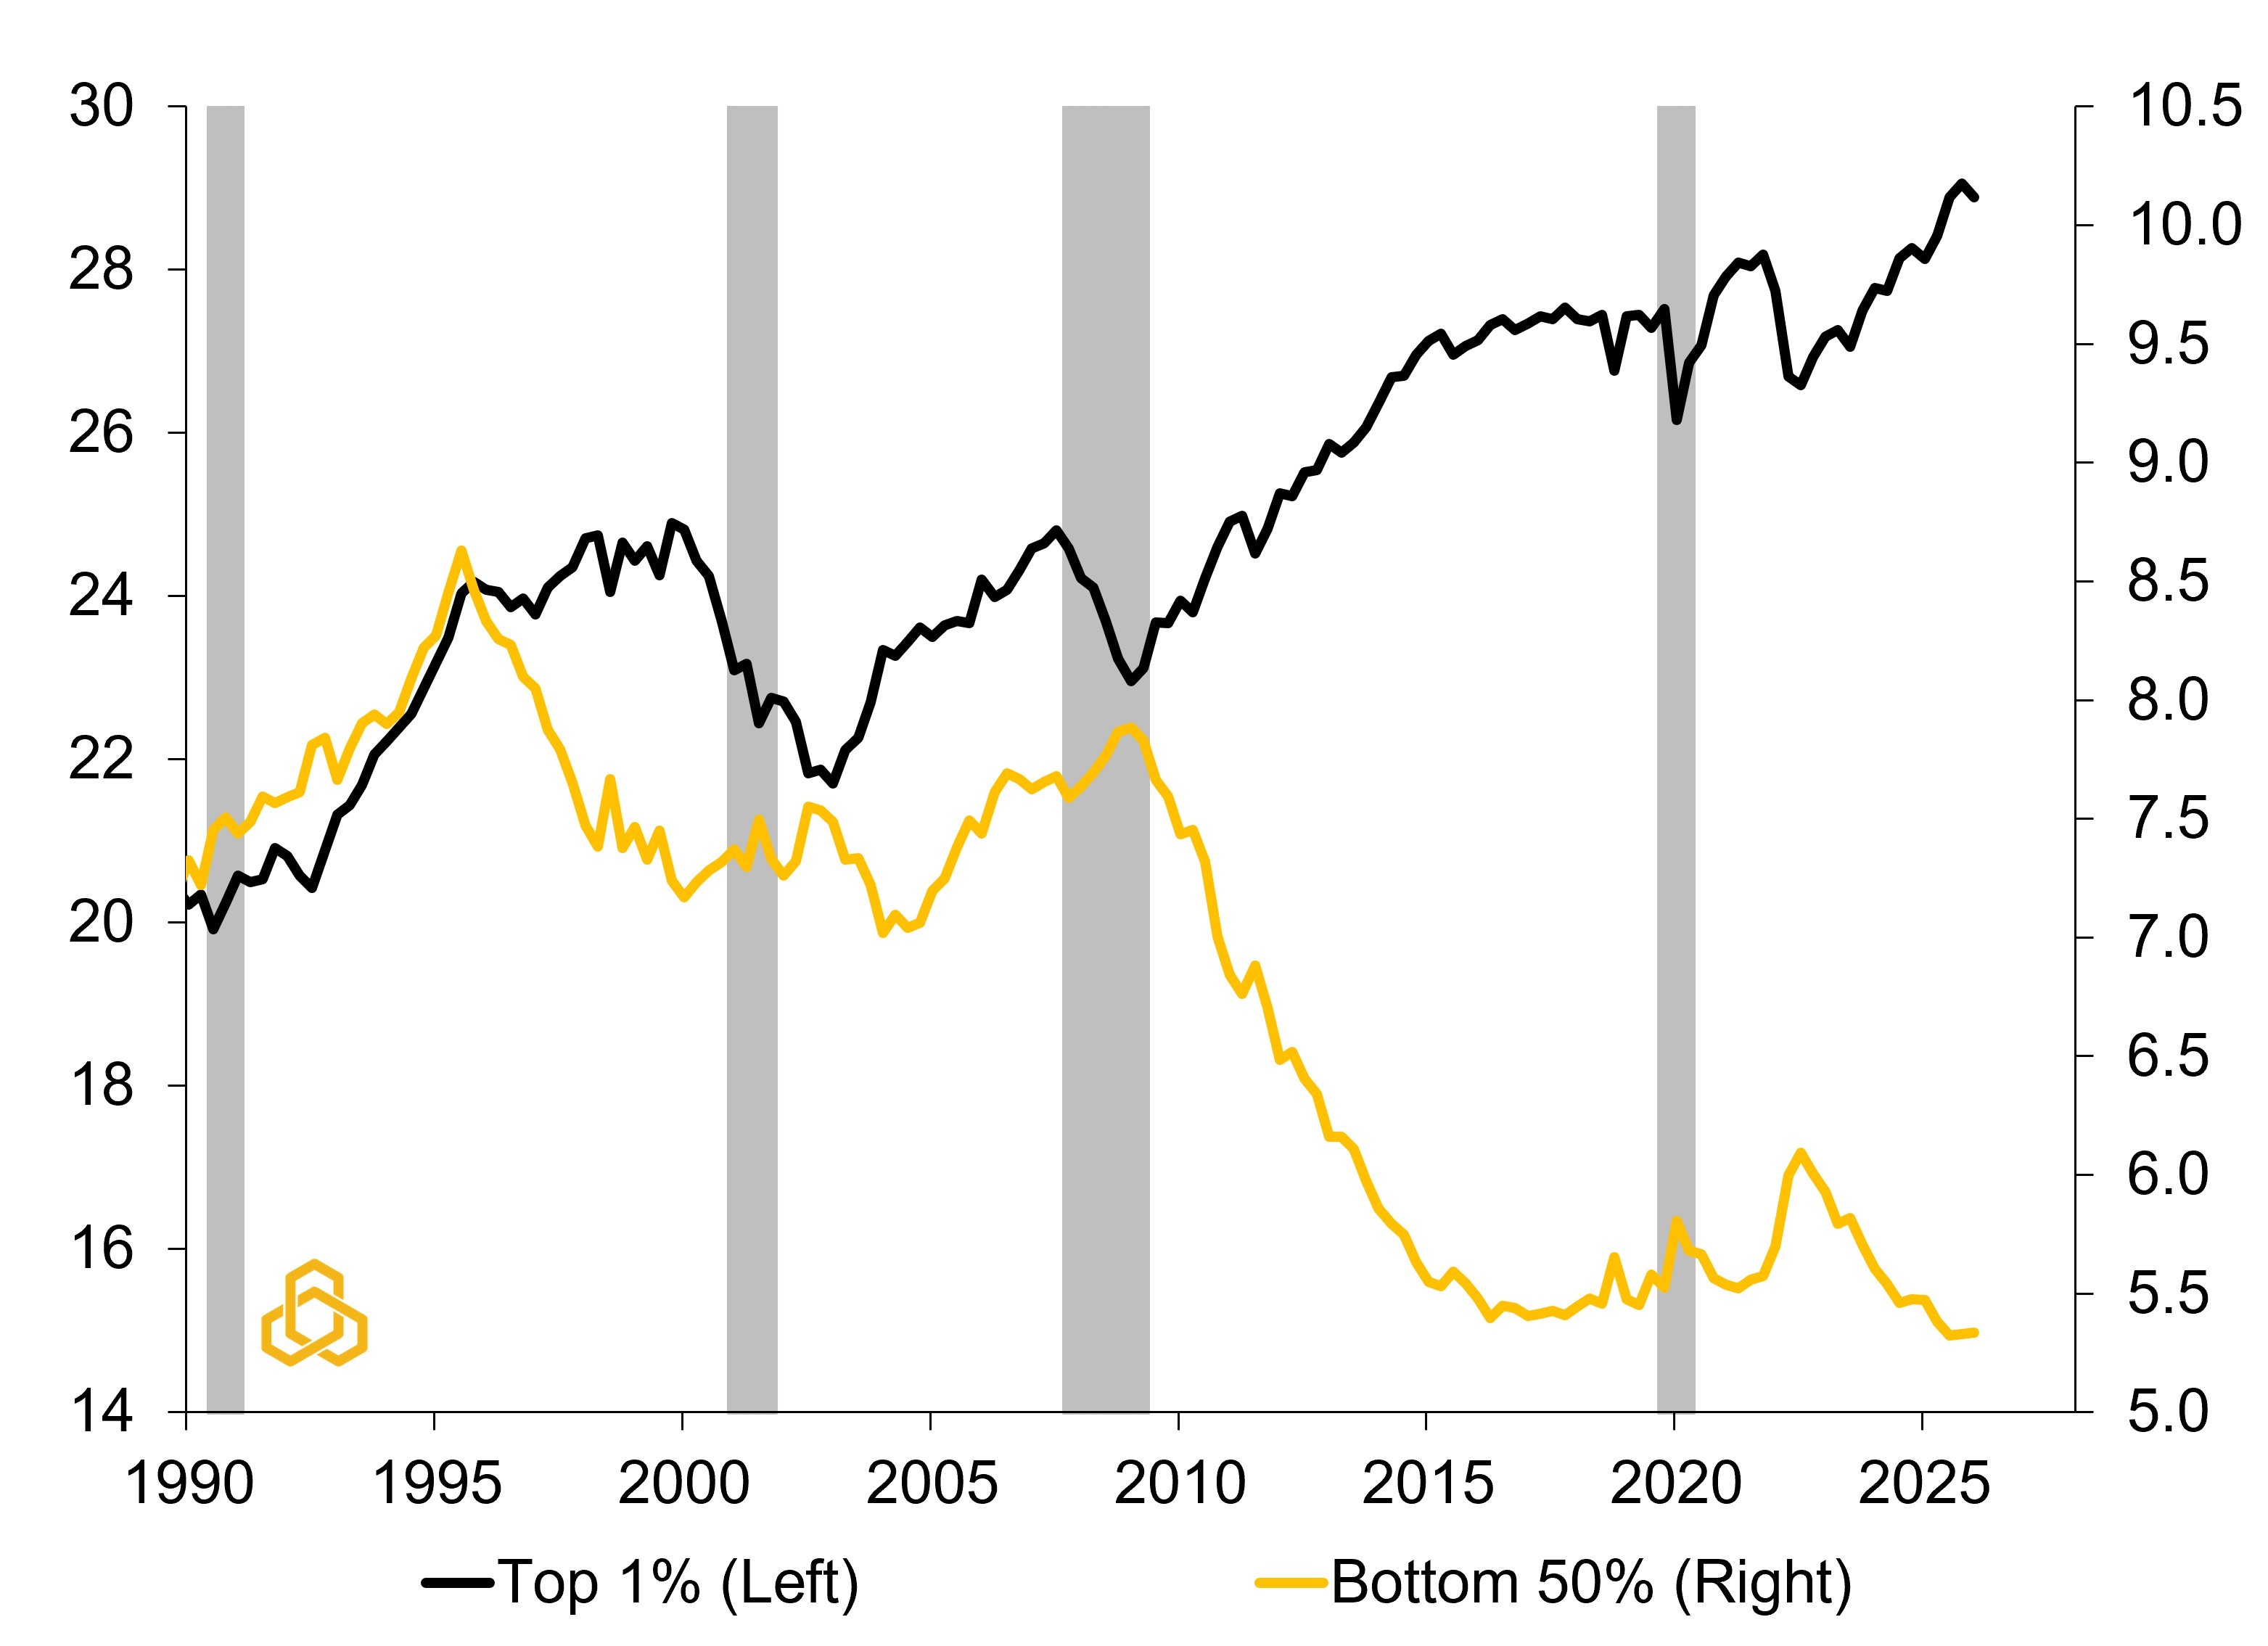
Sources: Federal Reserve Board of Governors, National Bureau of Economic Research, Bloomberg L.P., and Potomac. Data as of 1Q 2026. Note: Shaded regions denote periods of U.S. recession.
The same divide is visible in measures of near-term payment stress, although the data do not point to a persistent deterioration.
The probability that households earning less than $50,000 will miss a minimum debt payment over the next three months remains below its early-2026 peak, despite turning higher in the latest reading. Lower-income households are clearly more vulnerable, but the improvement from earlier this year suggests that financial stress is not accelerating in a straight line.
Figure 6. Chance of Missing a Minimum Debt Payment in the Next 3 Months (%)

Sources: Federal Reserve Bank of New York Survey of Consumer Expectations, Bloomberg L.P., and Potomac.
Actual delinquency data tell a similar story.
The percentage of student loan balances transitioning into serious delinquency surged above 16% in 2025 before falling to approximately 8% in the second quarter of 2026. Some of the surge reflected the return of negative credit reporting after temporary protections expired in late 2024, making the deterioration appear more abrupt.
Credit card and auto loan delinquencies also rose between 2022 and 2024 as higher interest rates took their toll. However, both trends appear to have stabilized since the fourth quarter of 2025.
Figure 7. Percentage of Balances Moving into Serious Delinquency By Loan Type

Source: Federal Reserve Bank of New York Quarterly Report on Household Debt and Credit and Potomac. Data as of 2Q 2026.
Recent data from Bank of America are also somewhat encouraging. The share of households paying off their credit card balances in full each month has risen, while there is little evidence that consumers are drawing upon their savings more aggressively.[1] Taken together, the data point to a consumer that is becoming more selective, but not on the verge of collapse.
This week's retail earnings should shed more light on the consumer. Results from Home Depot, Target, Lowe's, TJX, Walmart, and Ross Stores will offer a broad look at spending across income levels and categories. Walmart should provide insight into necessities, grocery spending, and whether households are becoming more price sensitive. Home Depot and Lowe's will tell us more about large purchases, remodeling activity, and the effects of elevated interest rates on housing-related spending.
The consumer stress test is not over, and not every household is passing. But unless retail earnings show that weakness is spreading or the labor market deteriorates meaningfully, the U.S. consumer remains in solid shape.
Next week, we turn to the corporate sector, where the largest companies have considerable capacity to fund the AI build-out, but smaller and more leveraged borrowers face a different reality.
Weekly “Keeping it Strait” Highlights:
The U.S. – Iran stalemate continues with crude oil prices swinging back and forth and Treasury yields going along for the ride.
Weaker retail sales resulted in a downgrade in the Atlanta Fed’s GDPNow tracker, but growth is still tracking at 4% in the third quarter. That seems way too high in our opinion, but we will see.
It seems like many of these data series have stabilized of late. This could change as activity picks up in the fall and the Fed perhaps provides more clarity on monetary policy, but for now things seem fairly quiet as we finish out the summer.

Source: Bloomberg L.P. and Potomac. Data as of August 18, 2026. Note 1: The dates selected are 2/27/2026 (start of the conflict), 3/9/2026 (initial oil surge/peak as the Strait closed), and the latest week and previous week to compare the weekly trend. Note 2: Economic and inflation surprise index readings about zero imply that data are beating the consensus on average, below zero means that data are missing expectations. Note 3: In commodity prices, we ranked higher oil, natural gas, retail gas, fertilizer, and aluminum prices as bad for the economy because it weighs on growth, we ranked rising gold and silver prices are good due to the investor perspective. Note 4: Political betting market odds are forecasts. All forecasts are expressions of opinions and are subject to change without notice and are not intended to be a guarantee.
[1] Bank of America Institute, Consumer Checkpoint: The Great Divergence, August 2026


