For the third and final chapter of our three-part series, we are going to focus on corporate debt. As Figure 1 shows, nonfinancial corporate debt as a percentage of gross domestic product (GDP) has trended higher over time, but it remains around the same level as before the Global Financial Crisis. While we have seen a modest tick higher recently, debt levels are far from suggestive of a debt-led crisis.
If you remember nothing else from this piece, that should be the key takeaway.
Figure 1. U.S. Nonfinancial Corporate Debt (% of GDP)

Sources: Federal Reserve Board of Governors, National Bureau of Economic Research, Bloomberg L.P., and Potomac. Note: Shaded regions denote periods of U.S. recession.
That does not mean there is no more story to tell, however. In fact, the COVID-19 pandemic was an important chapter in today's story.
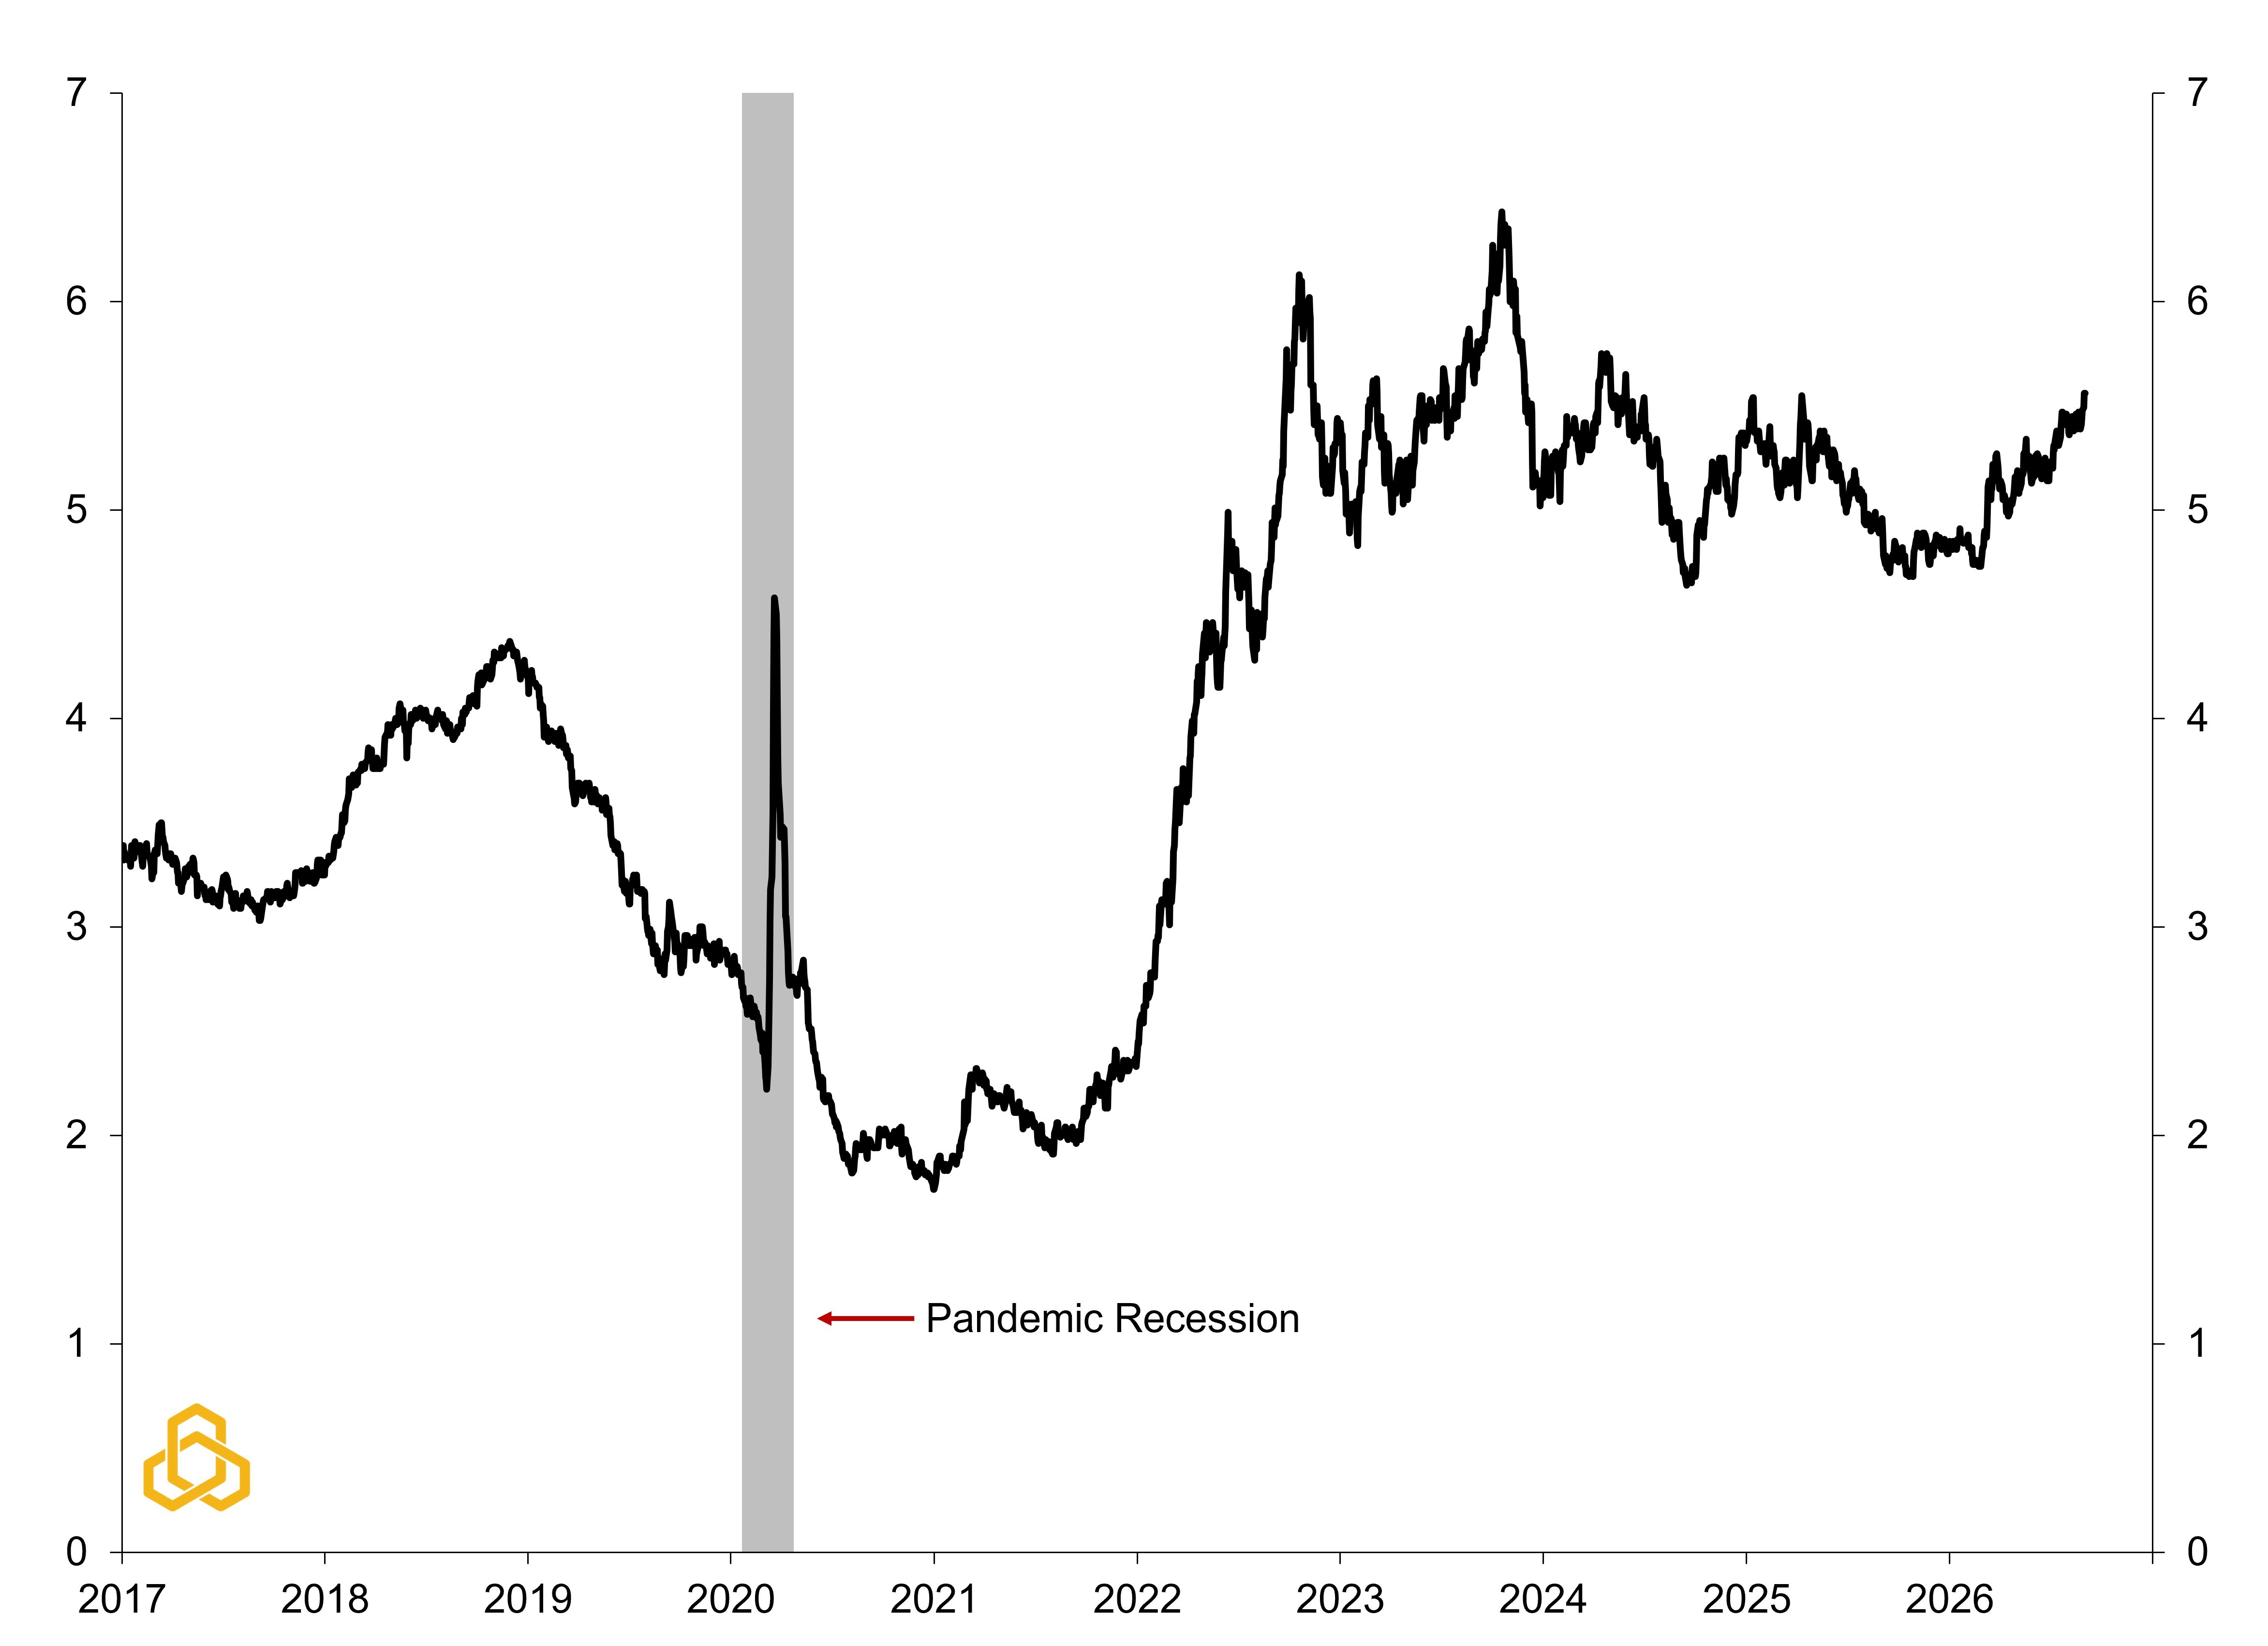
During the pandemic, corporate credit spreads initially widened sharply. But once the Federal Reserve stepped in to stabilize credit markets, companies rushed to issue long-term bonds at historically low rates. Some of those proceeds were used to repay credit-line borrowings, refinance existing bonds and replace shorter-term debt with longer-term, fixed-rate debt.
Figure 2. Bloomberg U.S. Aggregate Corporate Yield-to-Worst
Sources: Bloomberg L.P. and Potomac. Note: Shaded regions denote periods of U.S. recession.
That refinancing wave helped insulate Corporate America from the subsequent rise in interest rates in 2022.
As a result, corporate net interest expense as a percentage of net operating surplus has fallen to its lowest level since 1959. Think of this ratio as the share of operating income generated by nonfinancial companies that is needed to cover net interest expense.
With a current reading of about 5.7%, roughly 6 cents of every dollar of operating surplus goes toward net interest expense. That compares with approximately 20 cents per dollar for the federal government.
Put differently, despite higher interest rates and elevated debt levels, the aggregate corporate interest burden remains remarkably manageable.
Figure 3. Corporate Net Interest Expense (% of Net Operating Surplus)

Sources: Bureau of Economic Analysis, Bloomberg L.P. and Potomac. Note: Shaded regions denote periods of U.S. recession.
That backdrop has also helped support corporate profitability. Nonfinancial corporate profits before tax have climbed to a record share of GDP. Combined with the ongoing artificial intelligence investment cycle, strong profitability has provided an important tailwind for a stock market trading near record highs.
Figure 4. U.S. Nonfinancial Corporate Profits Before Tax (% of GDP)

Sources: Bureau of Economic Analysis, Bloomberg L.P., National Bureau of Economic Analysis, and Potomac. Note: Shaded regions denote periods of U.S. recession.
So, on the surface, Corporate America has a fairly clean bill of health.
There are, however, a few pockets worth monitoring. One of the most interesting is AI.
As we wrote in The AI Affirmation: From Hypergrowth to Normalization, hyperscaler capital expenditures have exploded as companies race to build out the infrastructure required for artificial intelligence. Increasingly, part of that investment is being financed through debt issuance at a time when borrowing costs remain well above their pre-pandemic levels. One Wall Street firm estimates that the five largest hyperscalers could issue around $400 billion in 2027.
That is almost the exact opposite of the backdrop companies faced in 2020.
Figure 5. Nonfinancial Corporate Net Debt Issuance (Bils of $) vs. 10-Year Treasury Yield

Sources: Federal Reserve Board of Governors, U.S. Treasury, Bloomberg L.P., and Potomac.
Importantly, this is not yet a story about AI investment being predominantly debt financed.
Much of the roughly $1 trillion in AI-related capital spending is still being financed through internally generated cash. But Bloomberg Intelligence estimates capex could climb above $1.5 trillion by 2028. Maintaining that pace will likely require either substantially greater earnings and cash-flow generation or increasing reliance on outside financing.
In other words, debt is becoming a more important marginal source of funding for the AI buildout and we are already seeing tentative signs that credit markets are taking notice.
Oracle and Meta provide two interesting examples. Both have increased spending aggressively, although their credit profiles remain very different. Their credit-default swap, or CDS, spreads give us one way to monitor how the market views that risk.
For those unfamiliar, a CDS spread is essentially the annual price of insuring against a company defaulting on its debt. The wider the spread, the more investors are willing to pay for that protection, and generally the greater the perceived credit risk.
Meta's CDS spread remains relatively benign at around 50 basis points, but Oracle is a different story. Its 5-year CDS spread has climbed toward 200 basis points, a meaningful repricing for an investment-grade company.
That does not mean investors expect Oracle to default. Far from it. But it is a yellow flag that credit markets are assigning considerably more risk to the company's balance sheet and financing needs than they were a year or two ago.
Figure 6. Meta and Oracle 5-Year Implied Credit-Default Swap Spreads (bps)

Sources: Bloomberg L.P., and Potomac. Note: A CDS spread is basically the annual price of insuring against a company defaulting on its debt.
In our opinion, hyperscaler CDS spreads could become one of the more useful indicators to watch as the AI investment cycle matures.
For now, spreads across the largest technology companies remain consistent with generally strong credit quality. But if CDS spreads across Amazon, Microsoft, Google or Meta begin moving persistently north of 100 basis points, we would take that as evidence that the market is beginning to price materially greater credit risk into the AI buildout.
That would not necessarily signal an imminent credit crisis. But it would suggest that what began as an earnings and capital-spending story was increasingly becoming a balance-sheet story.
If we had to guess what could eventually turn this bull market into a bear market, our guesses would be twofold: 1) an unexpected overtightening of monetary policy by the Fed, and 2) the risk-reward tradeoff surrounding artificial intelligence becomes less attractive as the cost of financing the buildout rises.
Under that scenario, capital spending could slow, removing an important source of economic and earnings growth as the eventual winners and losers of the AI race become clearer.
That said, we do not think the AI race is ending anytime soon.
Weekly “Keeping it Strait” Highlights:
The U.S. – Iran stalemate continues with discussions of exacting economic force on Iran through sanctions and targeting a major financial institution for doing business with Iran. There does not appear to be an end in sight with oil prices once again drifting upward.
Higher oil prices are once again putting pressure on yields with the 10-year U.S. Treasury yield rising to 4.79%. Higher real yields have also pushed commodity prices lower with gold and silver finishing the week lower. Growth prospects still remain decent despite the renewed climb in oil prices.
Inflation signals like the one-year breakeven rate picked up or remained stable. The ISM manufacturing prices paid component also remained unchanged in August suggesting that the initial improvement in inflation data may not prove lasting. The market now believes a rate hike in September is more likely than not.