The Dow Jones Transportation Average has been on a wild ride over the last few weeks, with much of the gain driven by Avis Budget Group. That’s a reminder that price-weighted indexes can be misleading when a single stock makes an outsized move and ends up steering the entire index (see figure 1).
Figure 1. Dow Jones Transportation Average vs. Avis Budget Group Stock
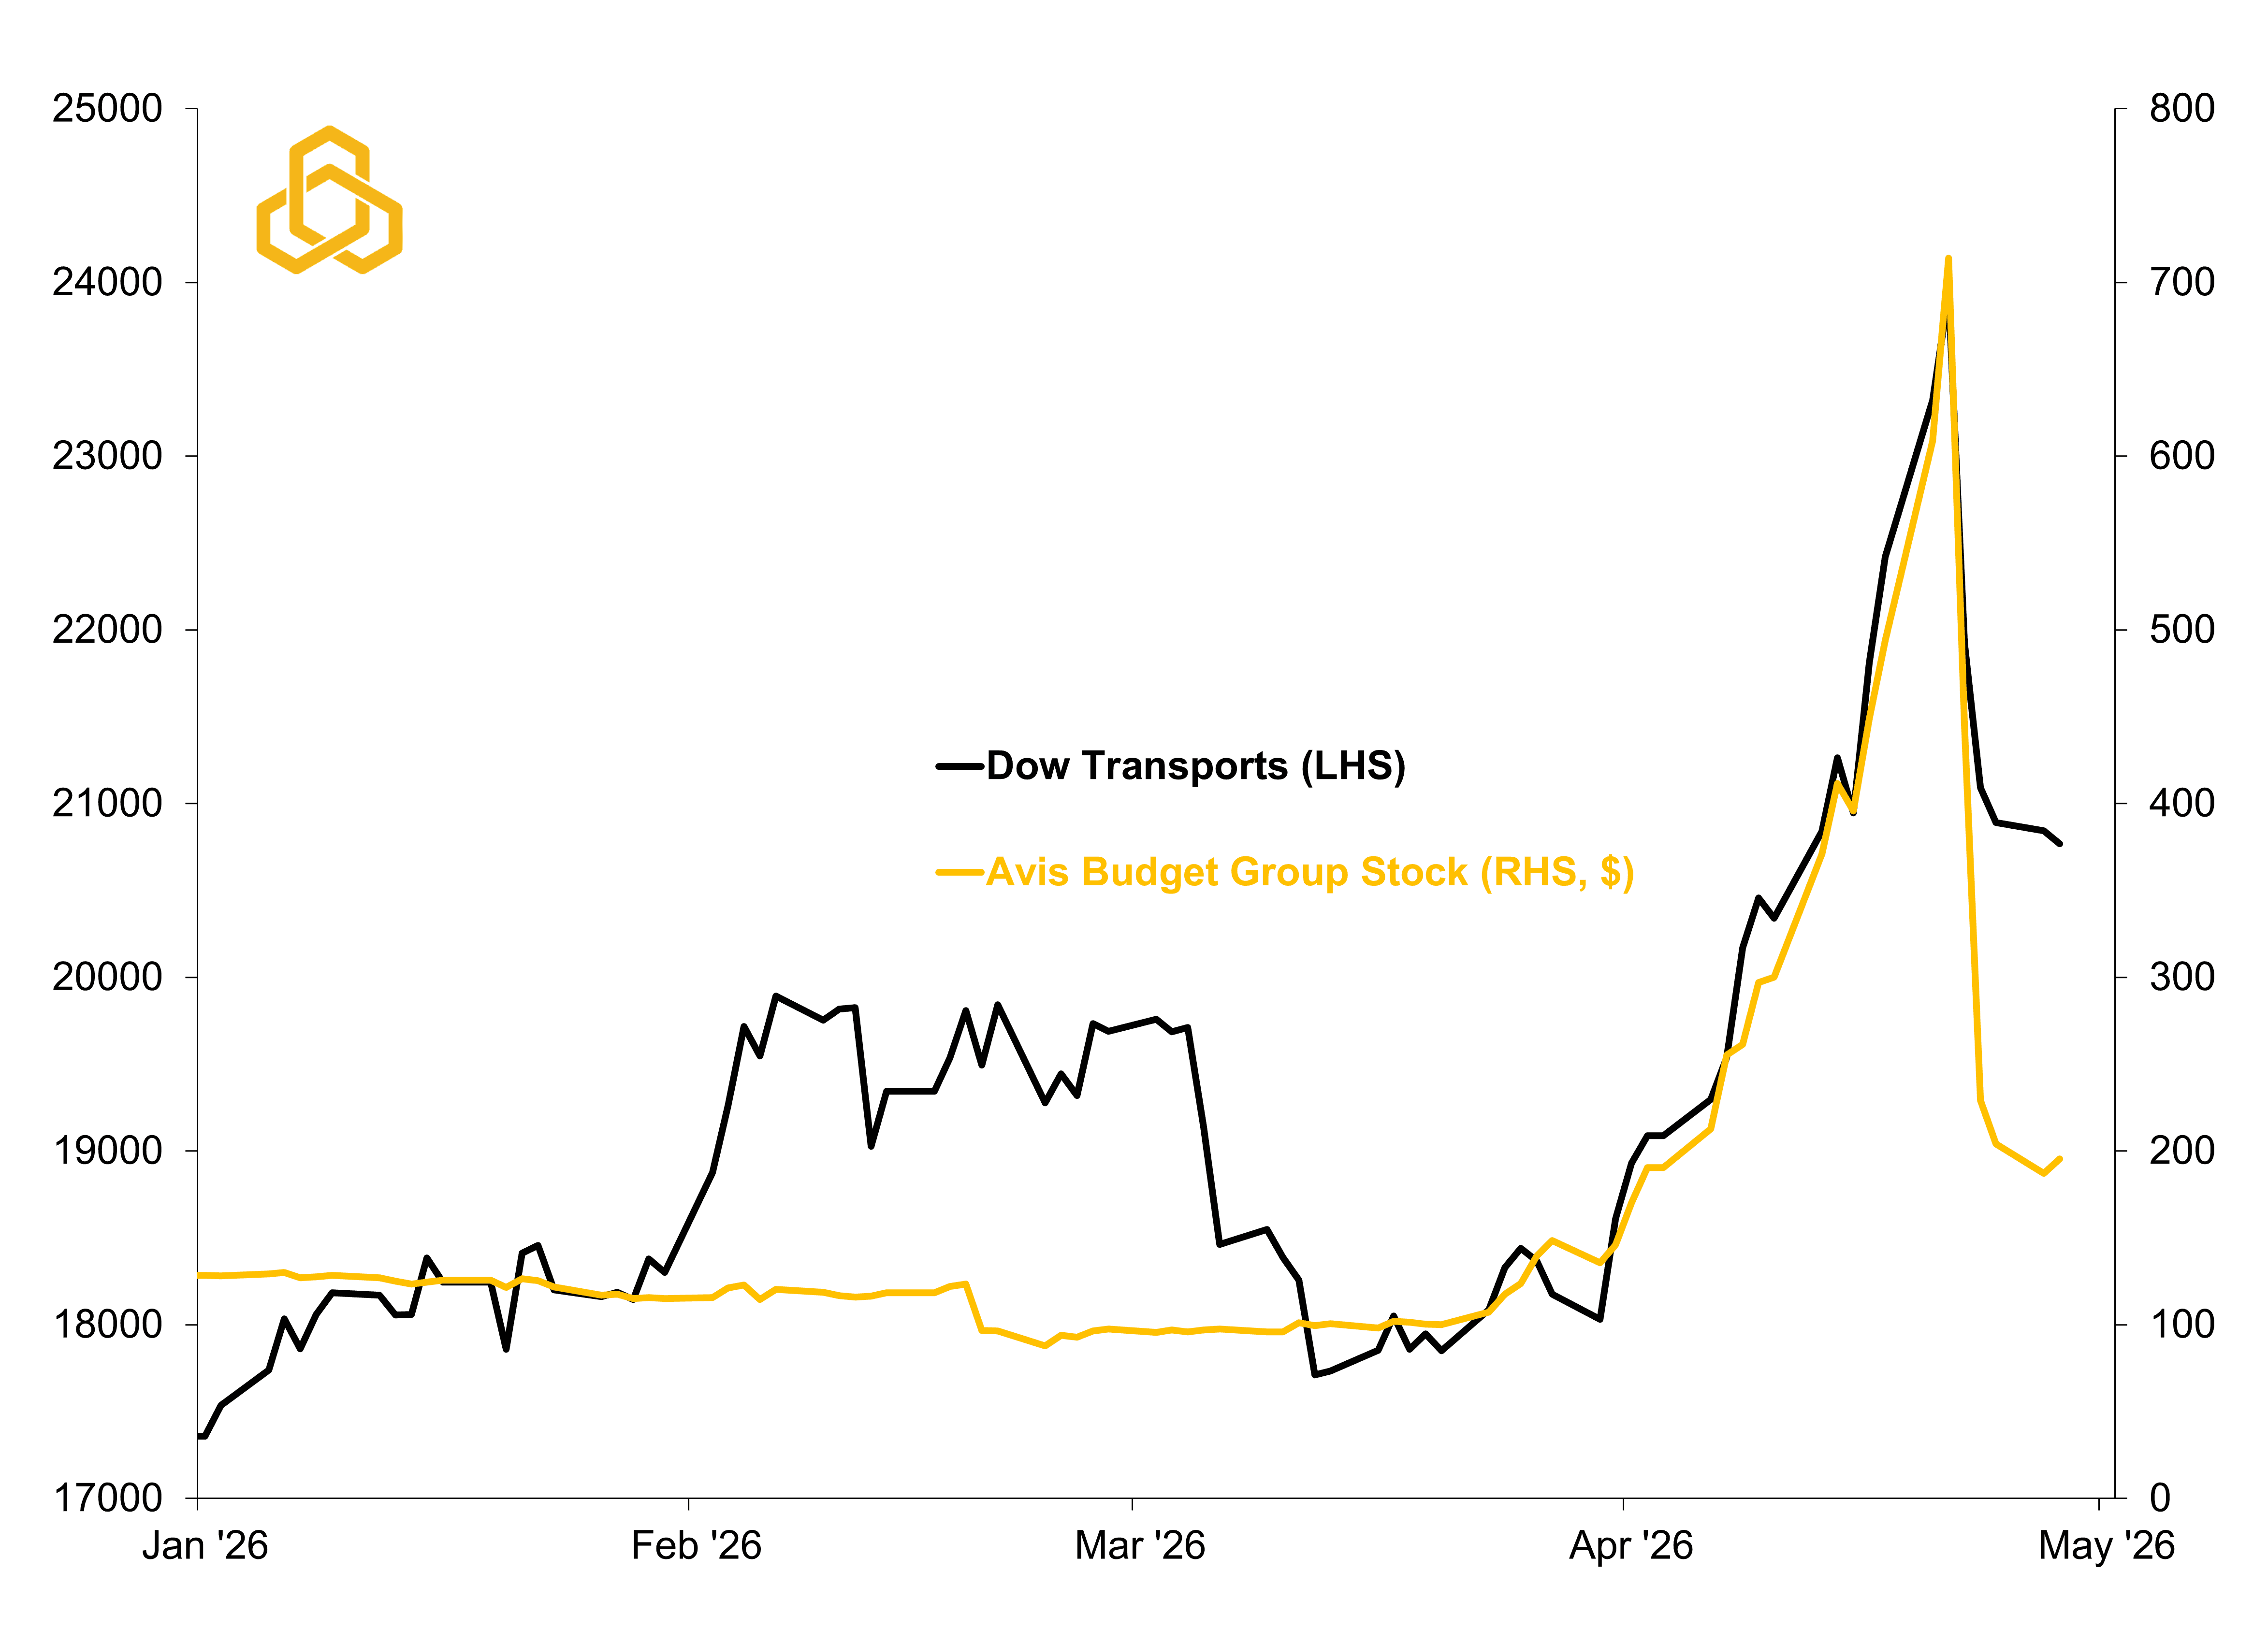
Sources: Dow Jones, Bloomberg L.P., and Potomac. Data as of April 28, 2026. Past performance is no guarantee of future results. It is not possible to invest directly in an index.
The reason this happened is a short squeeze, which occurs when a heavily shorted stock rapidly rises in price, forcing short sellers to buy shares to cover their positions, which then drives the price even higher. The move is reminiscent of the meme stock era of 2021, when GameStop and AMC Entertainment rocketed higher before eventually falling back to Earth.
That does not mean, however, that the Dow Jones Transportation Average has lost its value as an economic indicator. Prior to the recent surge, the index had been tracking closely with our weighted Institute for Supply Management New Orders Index, a forward-looking gauge of incoming business demand (see figure 2). This measure helps show whether companies are receiving more or fewer new orders from customers compared with the prior month.
Figure 2. Dow Jones Transportation Average vs. Weighted ISM New Orders Index
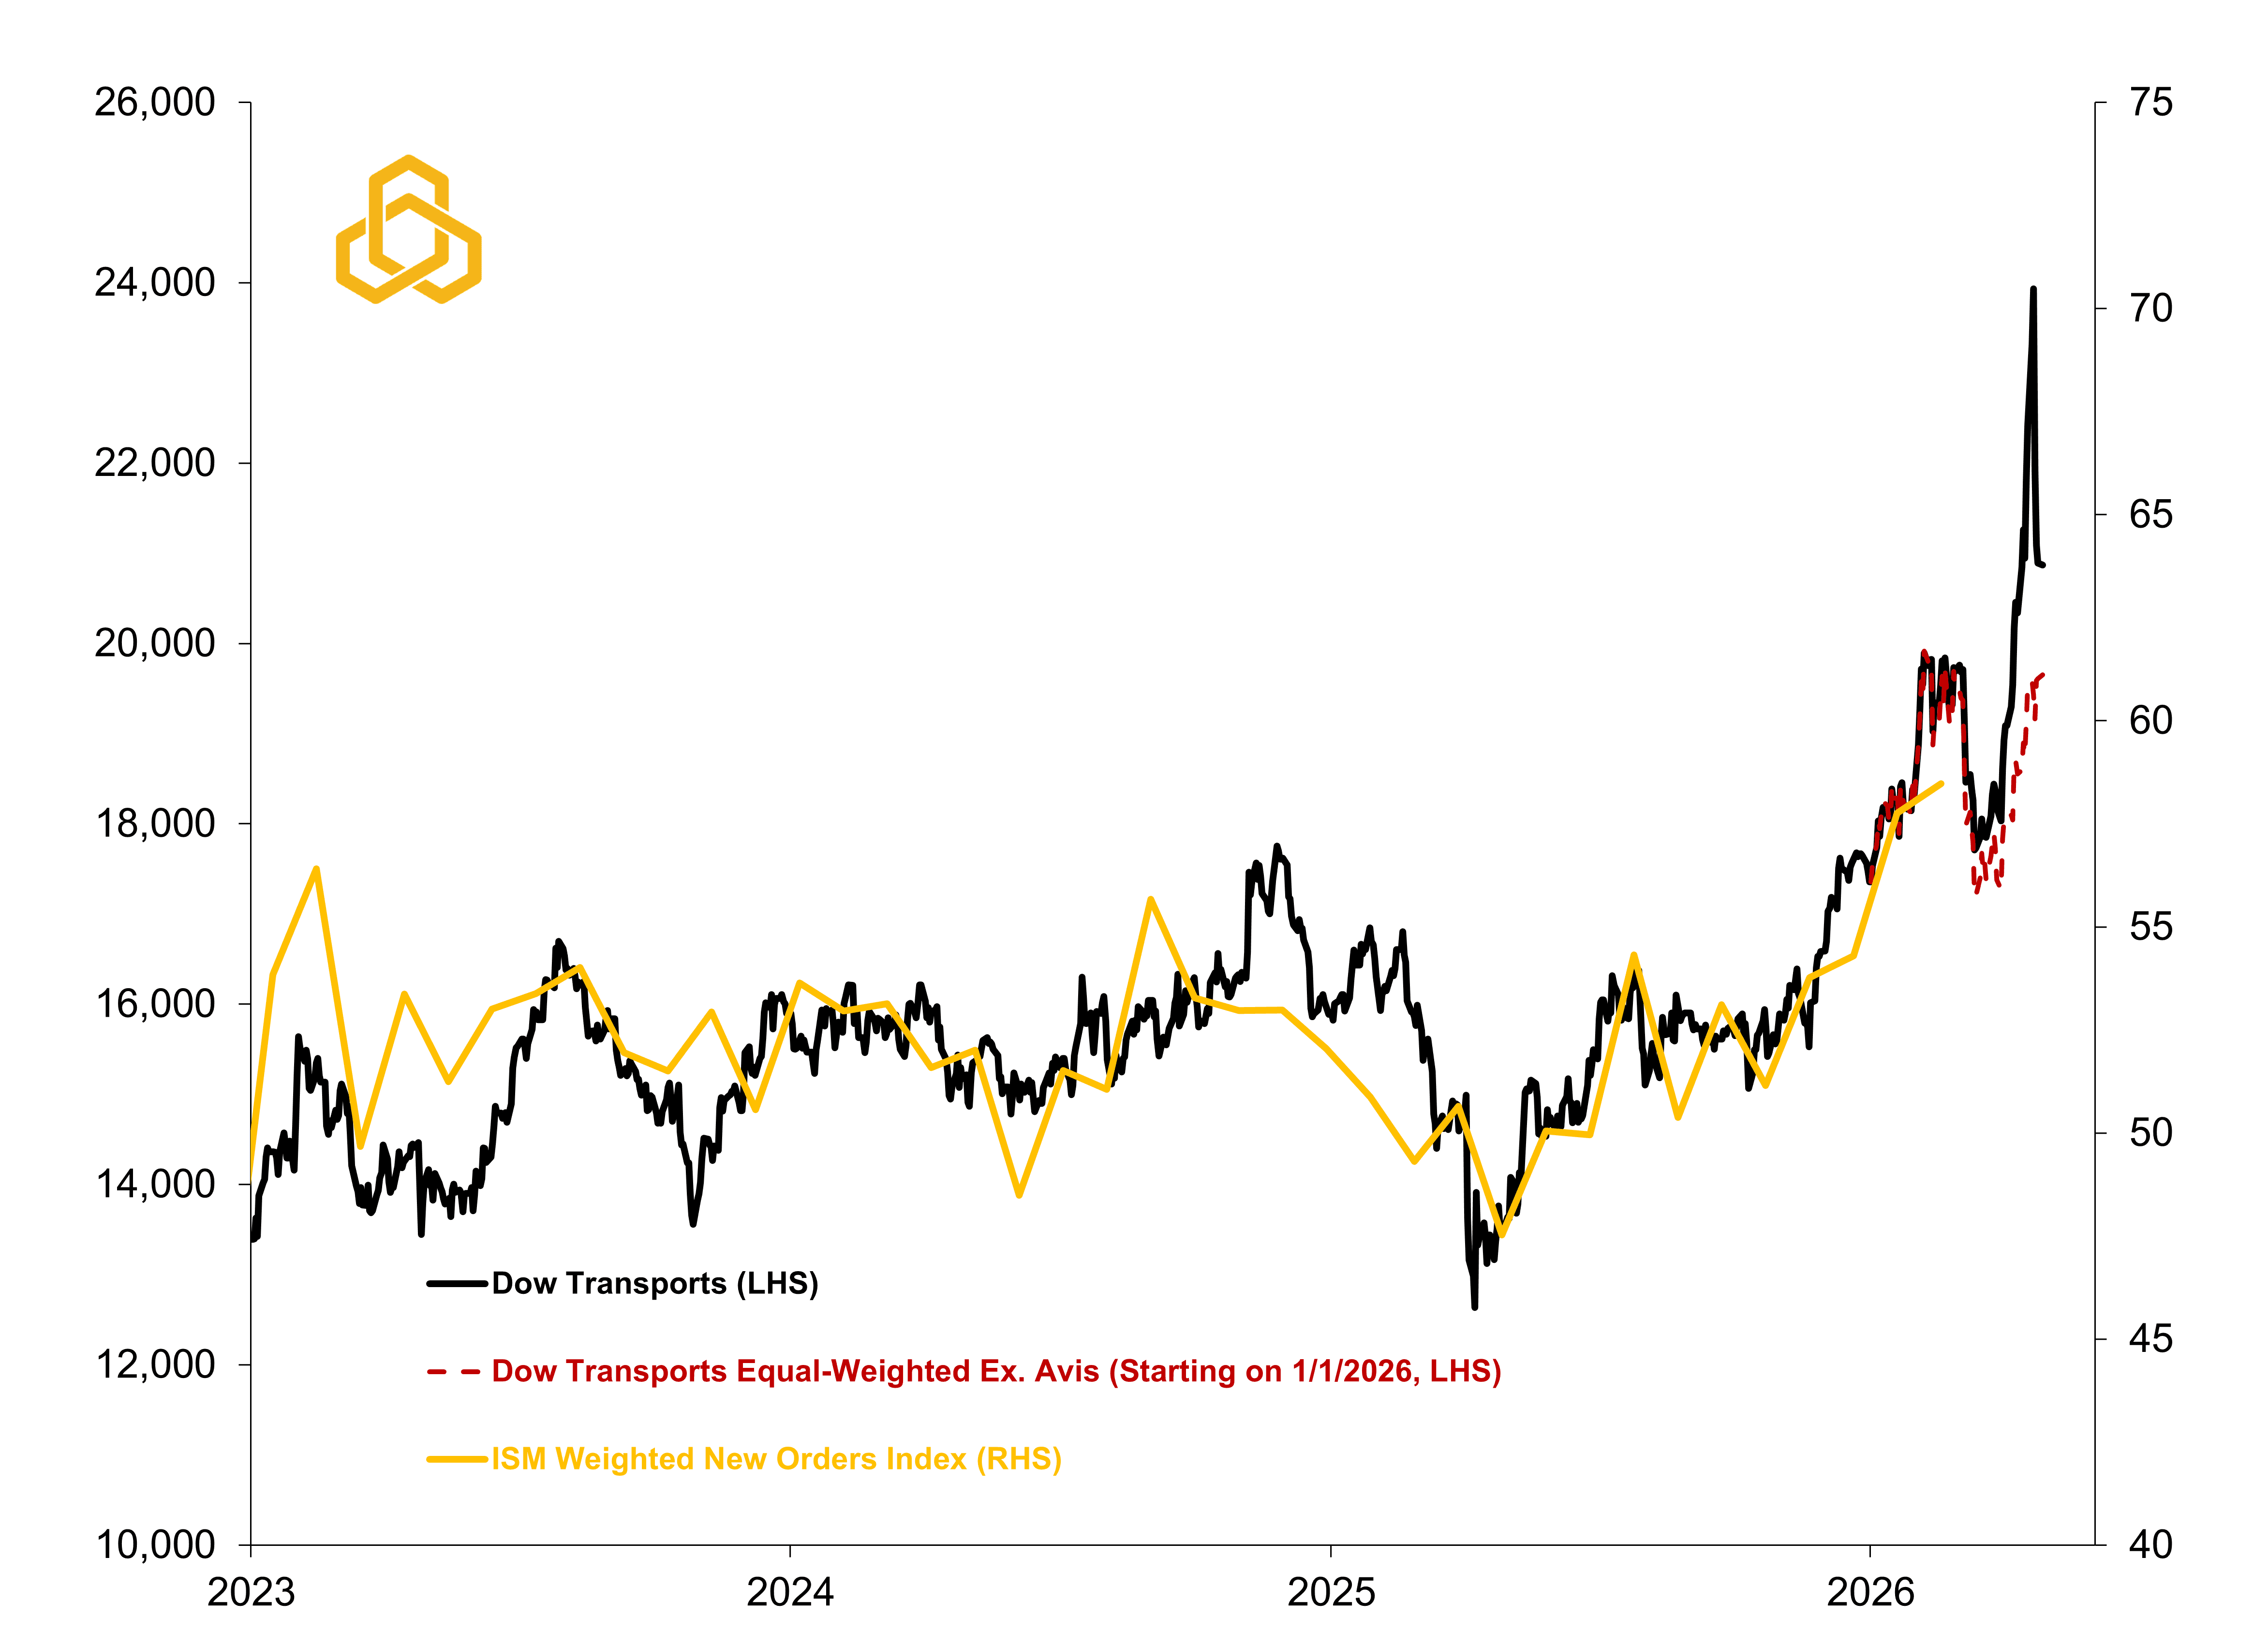
Sources: Dow Jones, Bloomberg L.P., and Potomac. Data as of April 28, 2026. Note: The ISM weighted new order index is 70% services and 30% manufacturing. Past performance is no guarantee of future results. It is not possible to invest directly in an index.
To adjust for the recent surge, we created an equal-weighted Dow Transports index excluding Avis Budget Group. Unsurprisingly, much of the spike and collapse fades away, with the index showing a V-shaped recovery from the recent pullback following the onset of the U.S. / Israel / Iran conflict. It also suggests that new orders likely remained fairly stable in April, with the next releases due on May 1st for manufacturing and May 5th for services.
Ignoring the recent short squeeze, the transports have been a solid predictor of economic activity over the past few years. In addition, March’s durable goods orders report confirmed their recent signal, with orders for nondefense capital goods excluding aircraft surging by 3.3%. This is the largest jump in the indicator since 2020 and it feeds directly into U.S. real gross domestic product (GDP) calculations.
Moving forward, we will be watching the charts below closely. Typically, economic data begins to surprise to the downside when energy prices remain elevated for extended periods (see figure 3). While we suspect that the U.S. economy will continue to show resilience relative to other developed markets, some slowing in the second quarter of 2026 would not be surprising (see figure 4).
Figure 3. Average U.S. Retail Gas Price vs. Citi’s U.S. Economic Surprise Index
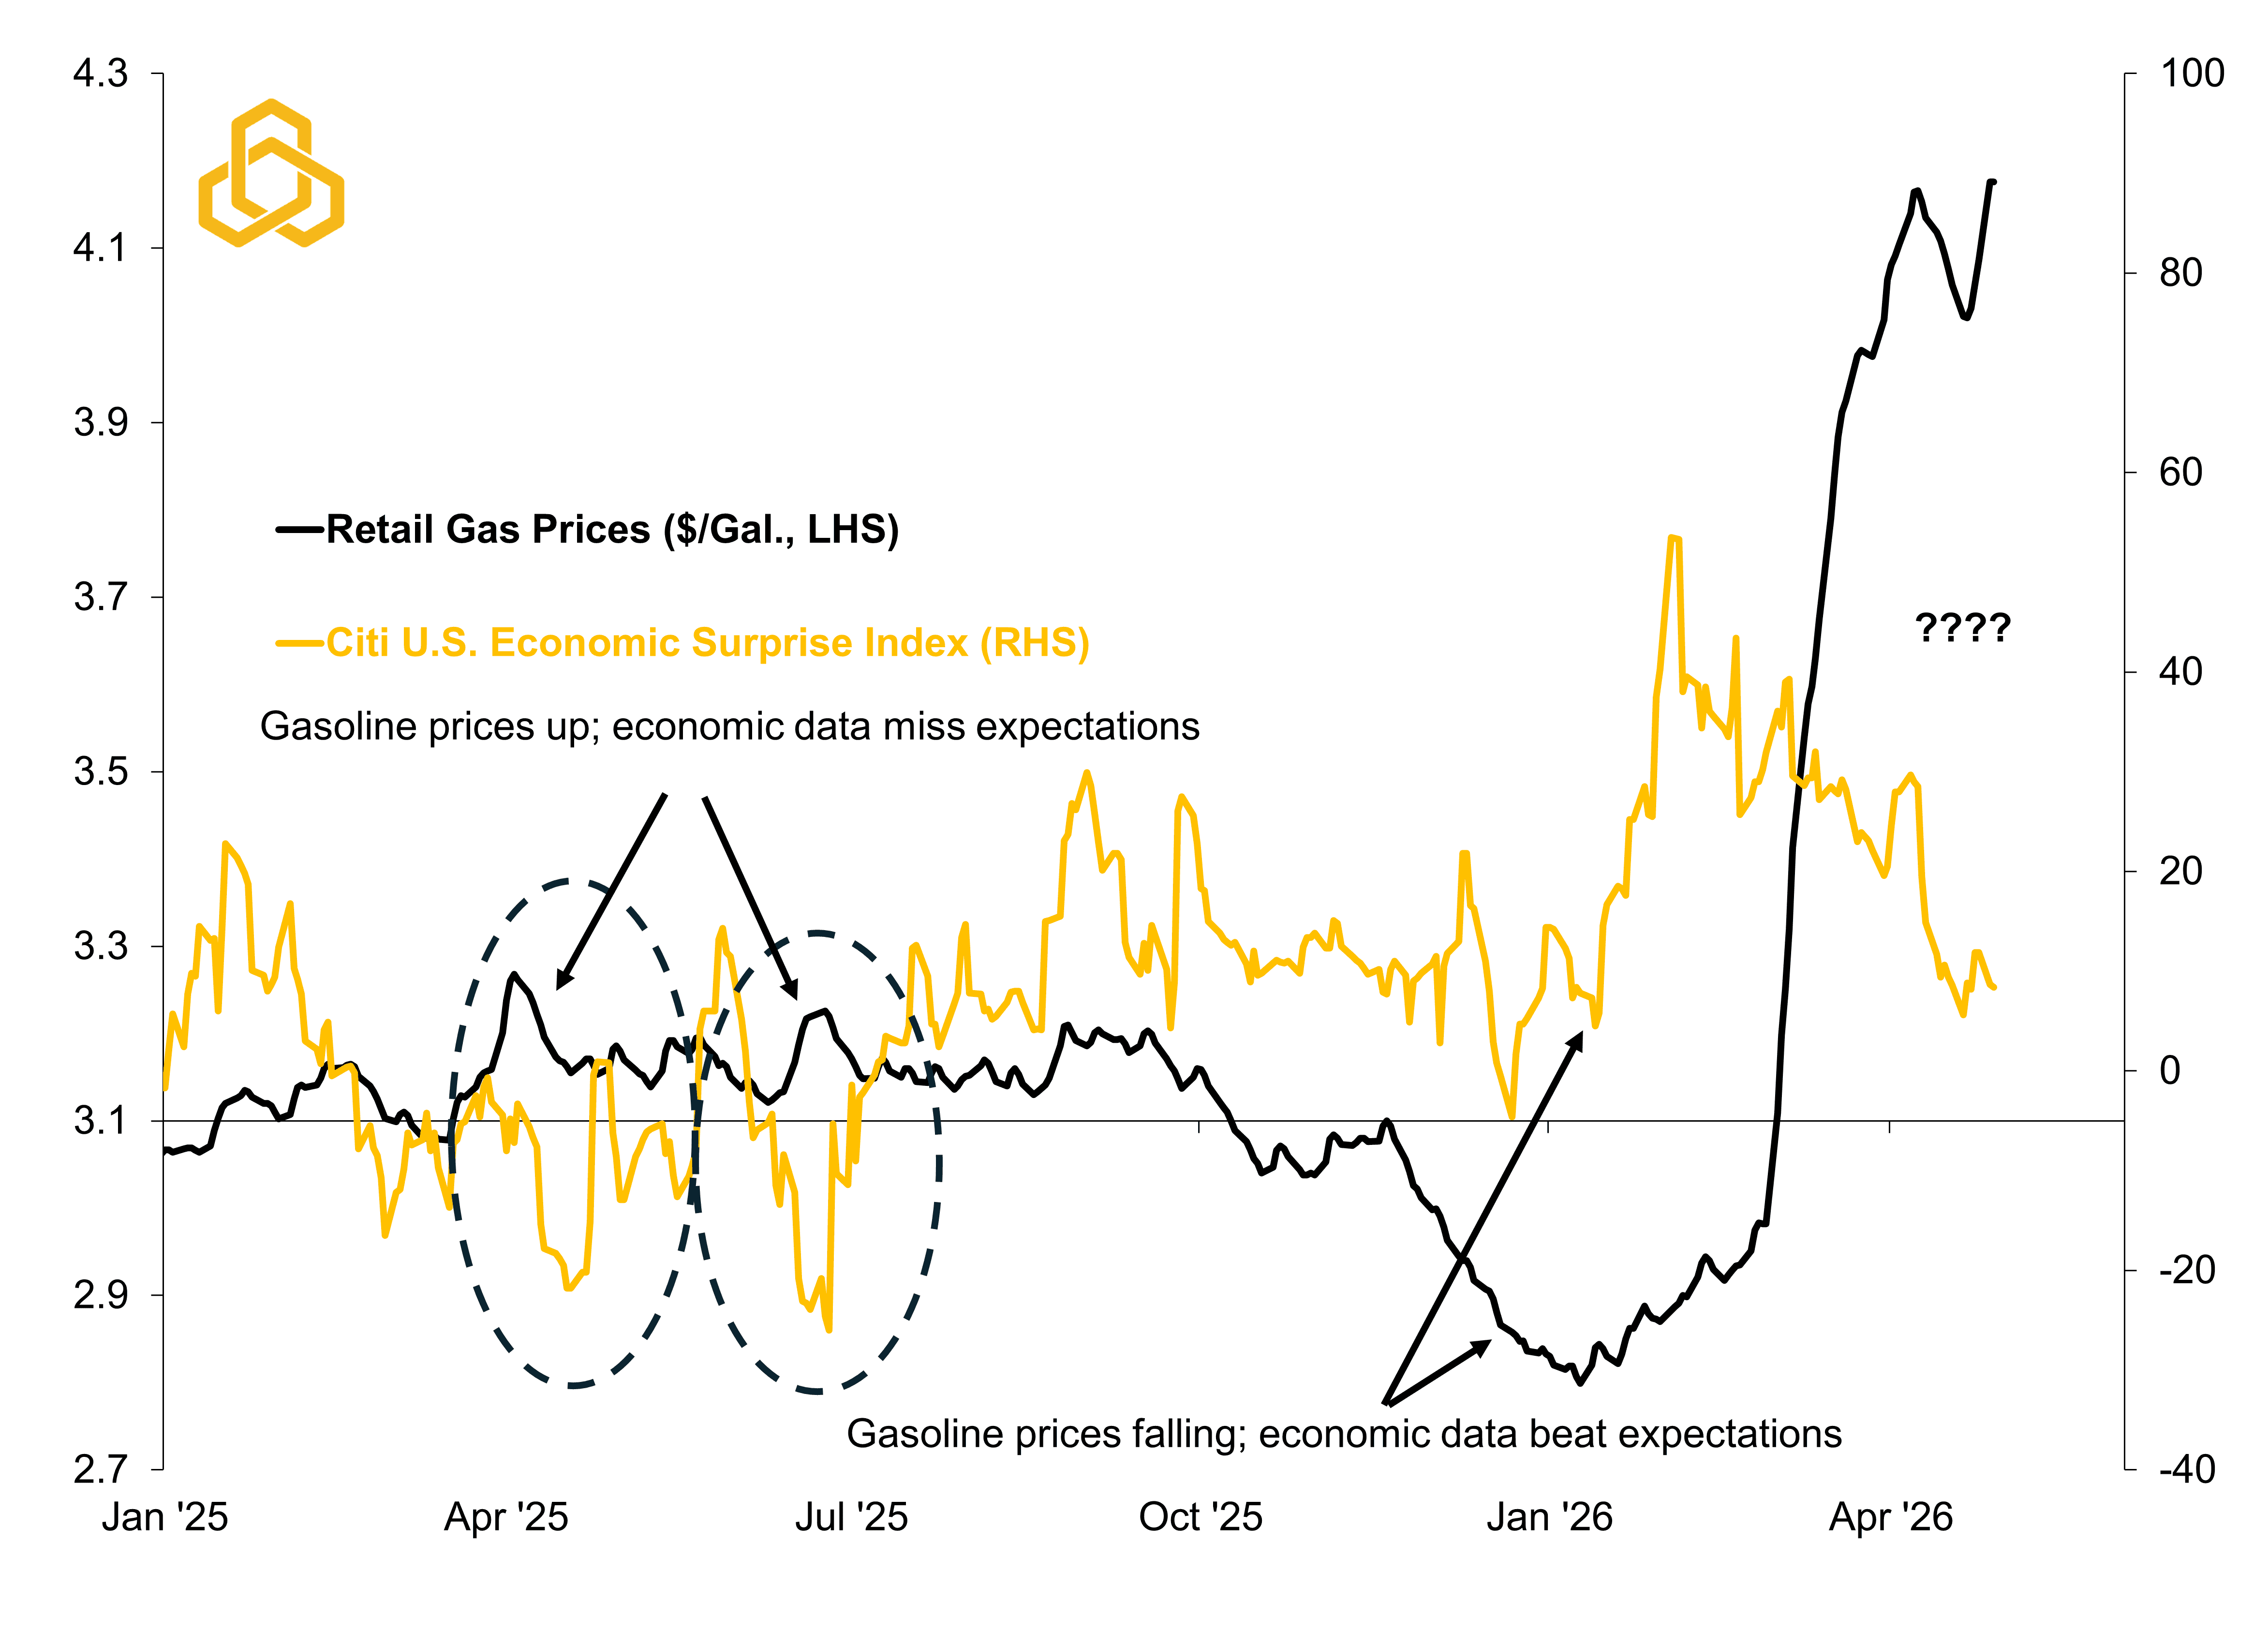
Sources: American Automobile Association, Citigroup Global Markets, Inc., Bloomberg L.P., and Potomac. Data as of April 28, 2026. Note: A Citi Economic Surprise Index reading above zero means that economic data are beating consensus on average; below means that data are missing expectations.
Figure 4. Global and Regional Economic Surprise Indices vs Brent Crude Oil
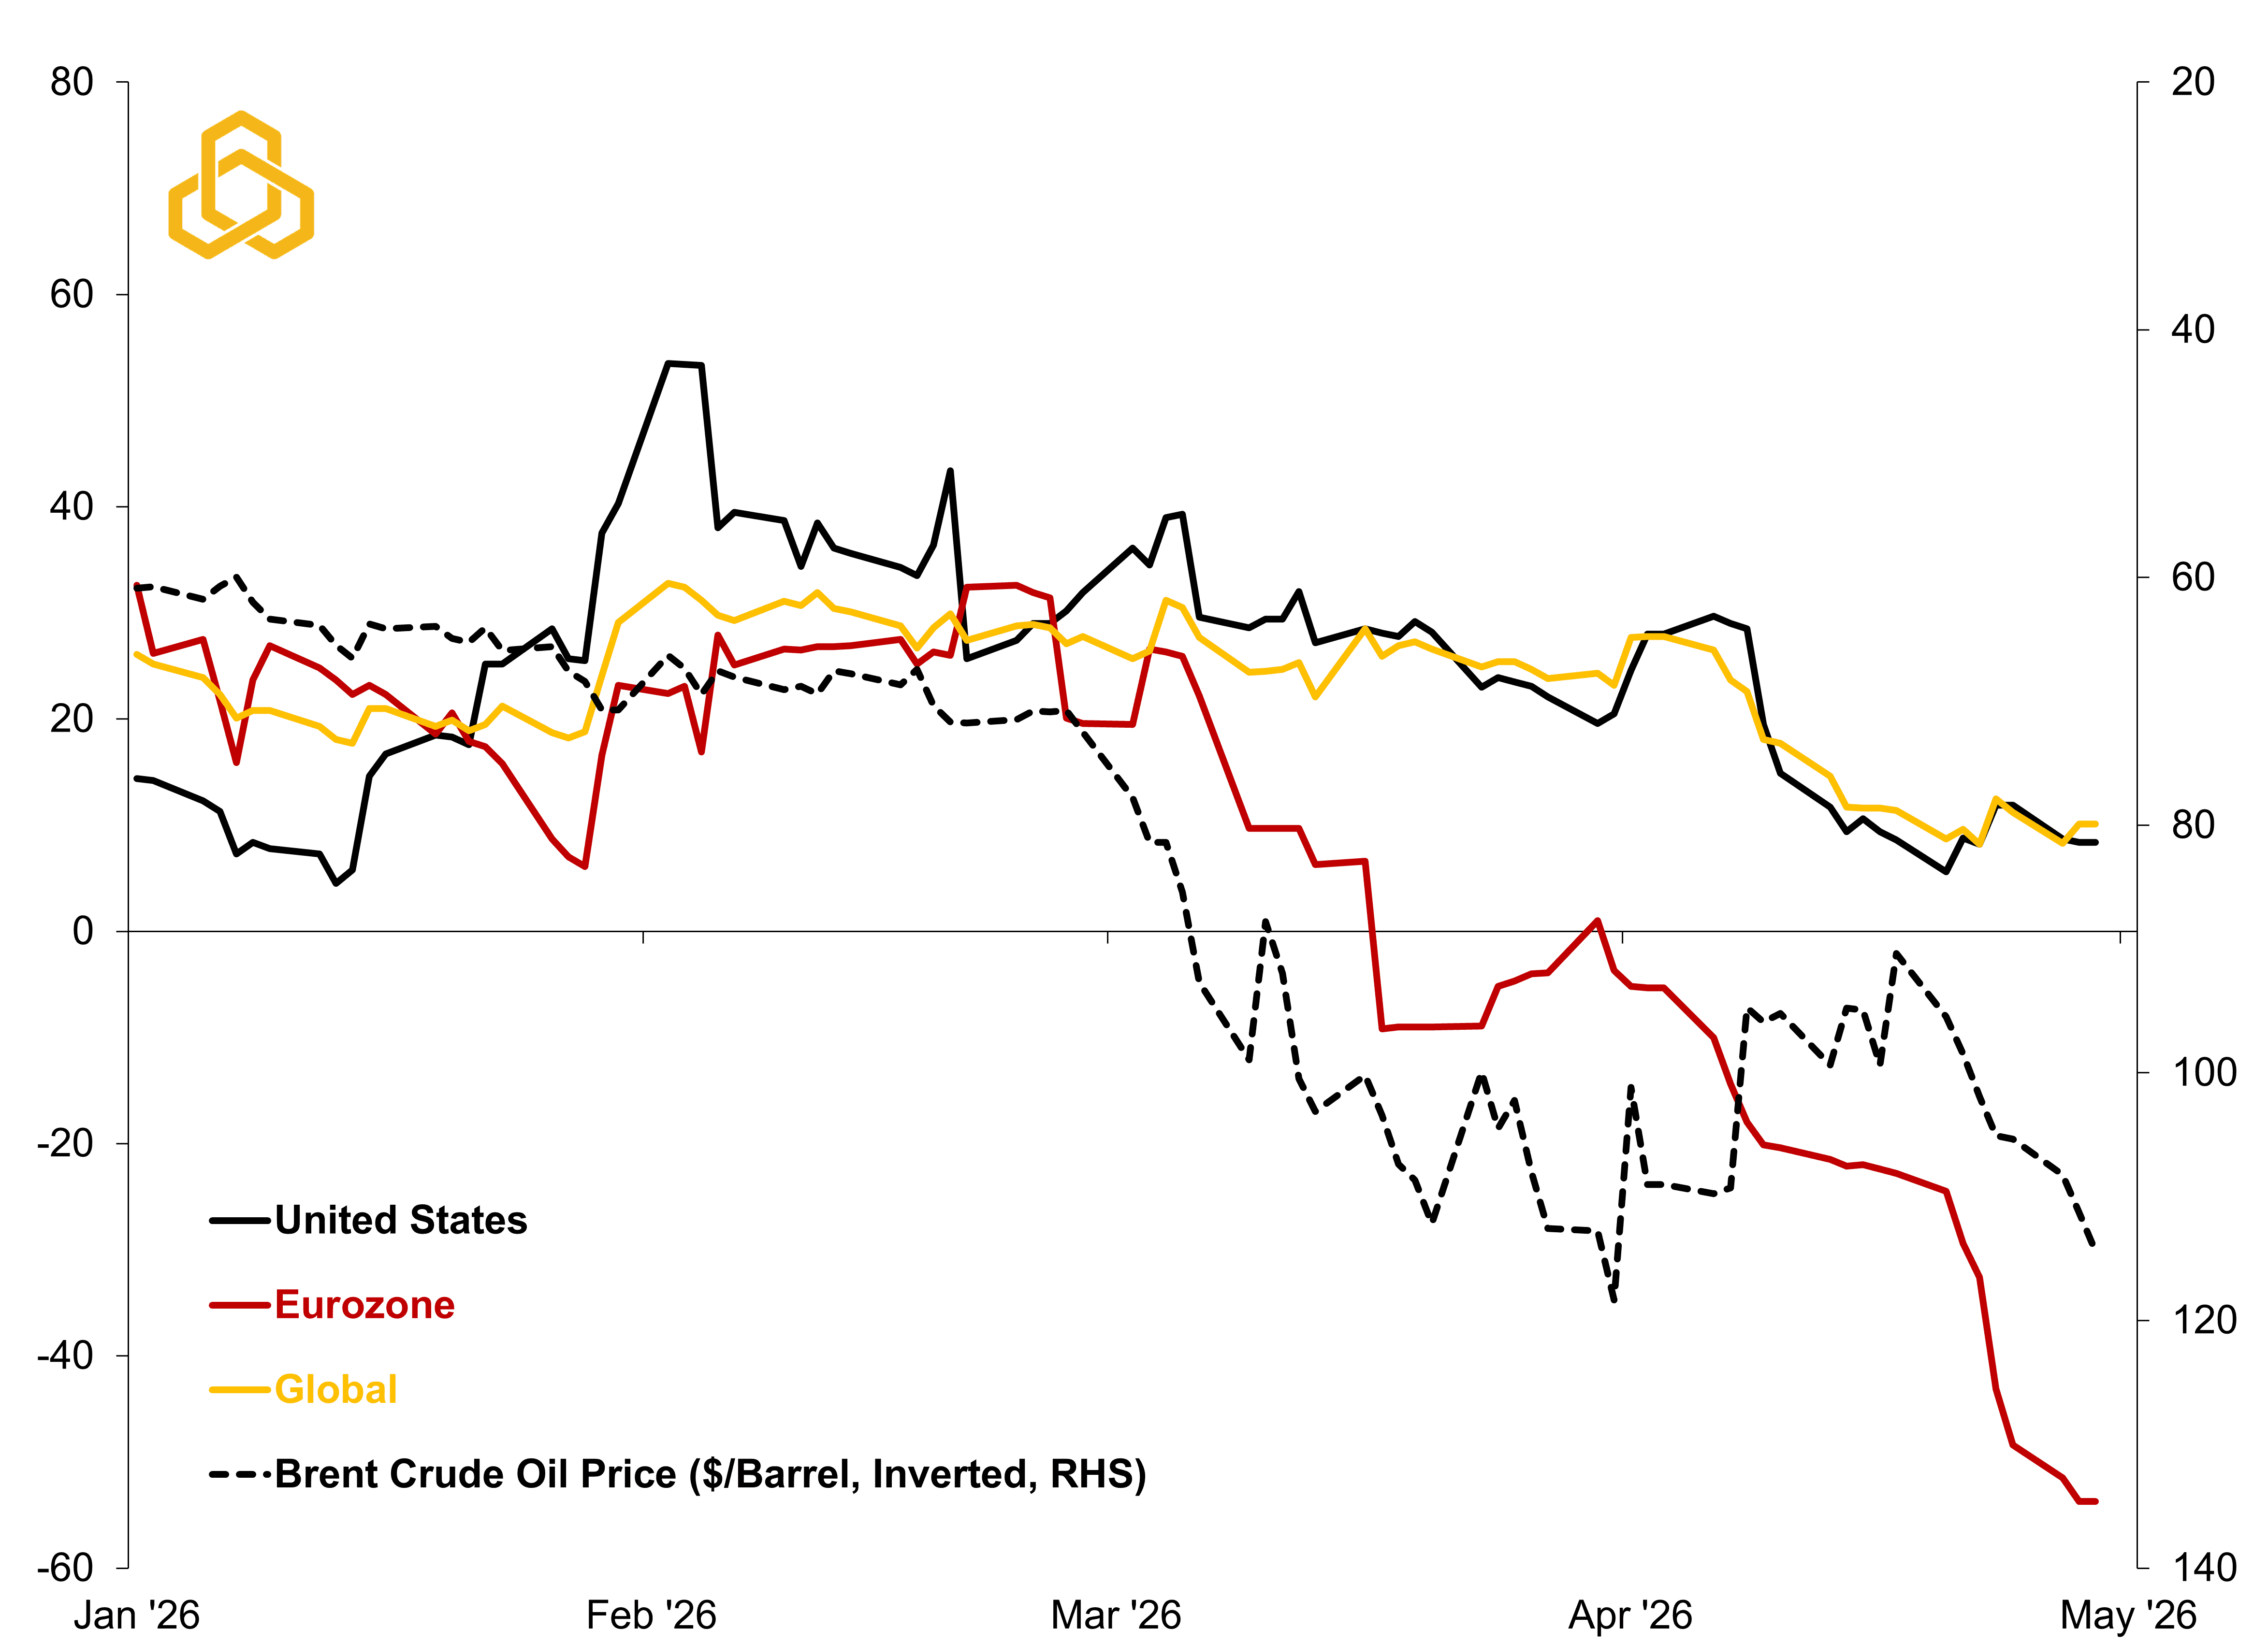
Sources: Citigroup Global Markets, Inc., Intercontinental Exchange, Bloomberg L.P., and Potomac. Data as of April 28, 2026. Note: A Citi Economic Surprise Index reading above zero means that economic data are beating consensus on average; below means that data are missing expectations.
It will be interesting to see whether any second quarter slowing influences the Trump Administration’s handling of tariff refunds from U.S. Customs and Border Protection. With potential refunds totaling roughly $166 billion, or about 0.5% of nominal U.S. GDP, those payments could act as a mini corporate stimulus by cushioning growth, supporting margins, and modestly lifting activity in the second half of the year. The first checks could arrive in late June, with the bulk likely in July or August. For once, Washington may help the economy not by passing a new bill, but by paying one.
Weekly “Keeping it Strait” Highlights:
The Strait of Hormuz effectively remains closed. The odds of a permanent ceasefire by June 30 slipped from 64% last week to 43% currently.
The economic surprise index in Europe weakened further as the April flash composite PMI disappointed and economic sentiment fell from 96.6 to 93.0 – its lowest level in about 3 ½ years.
Oil prices jumped higher again, which caused a backup in Treasury yields. The rise in yields caused gold prices to move lower as it is a non-yielding asset.