
Mixed Messages: A Solid Economy with Commitment Issues
The U.S. economy continues to send mixed messages. At times, it flirts with investors with a strong payrolls report, only to turn around and give them the “ick” as inflation metrics reaccelerate. The relationship between investors and the U.S. economy feels tenuous, but let’s unpack what the latest data are really saying.
The Labor Market
Initial jobless claims, what individuals file for when seeking unemployment insurance, remain remarkably low. On its own, this should give investors confidence that a recession, and by extension a bear market, is unlikely in the near term (see figure 1).
Figure 1. Initial Jobless Claims (Thous.) vs Periods of U.S. Recession
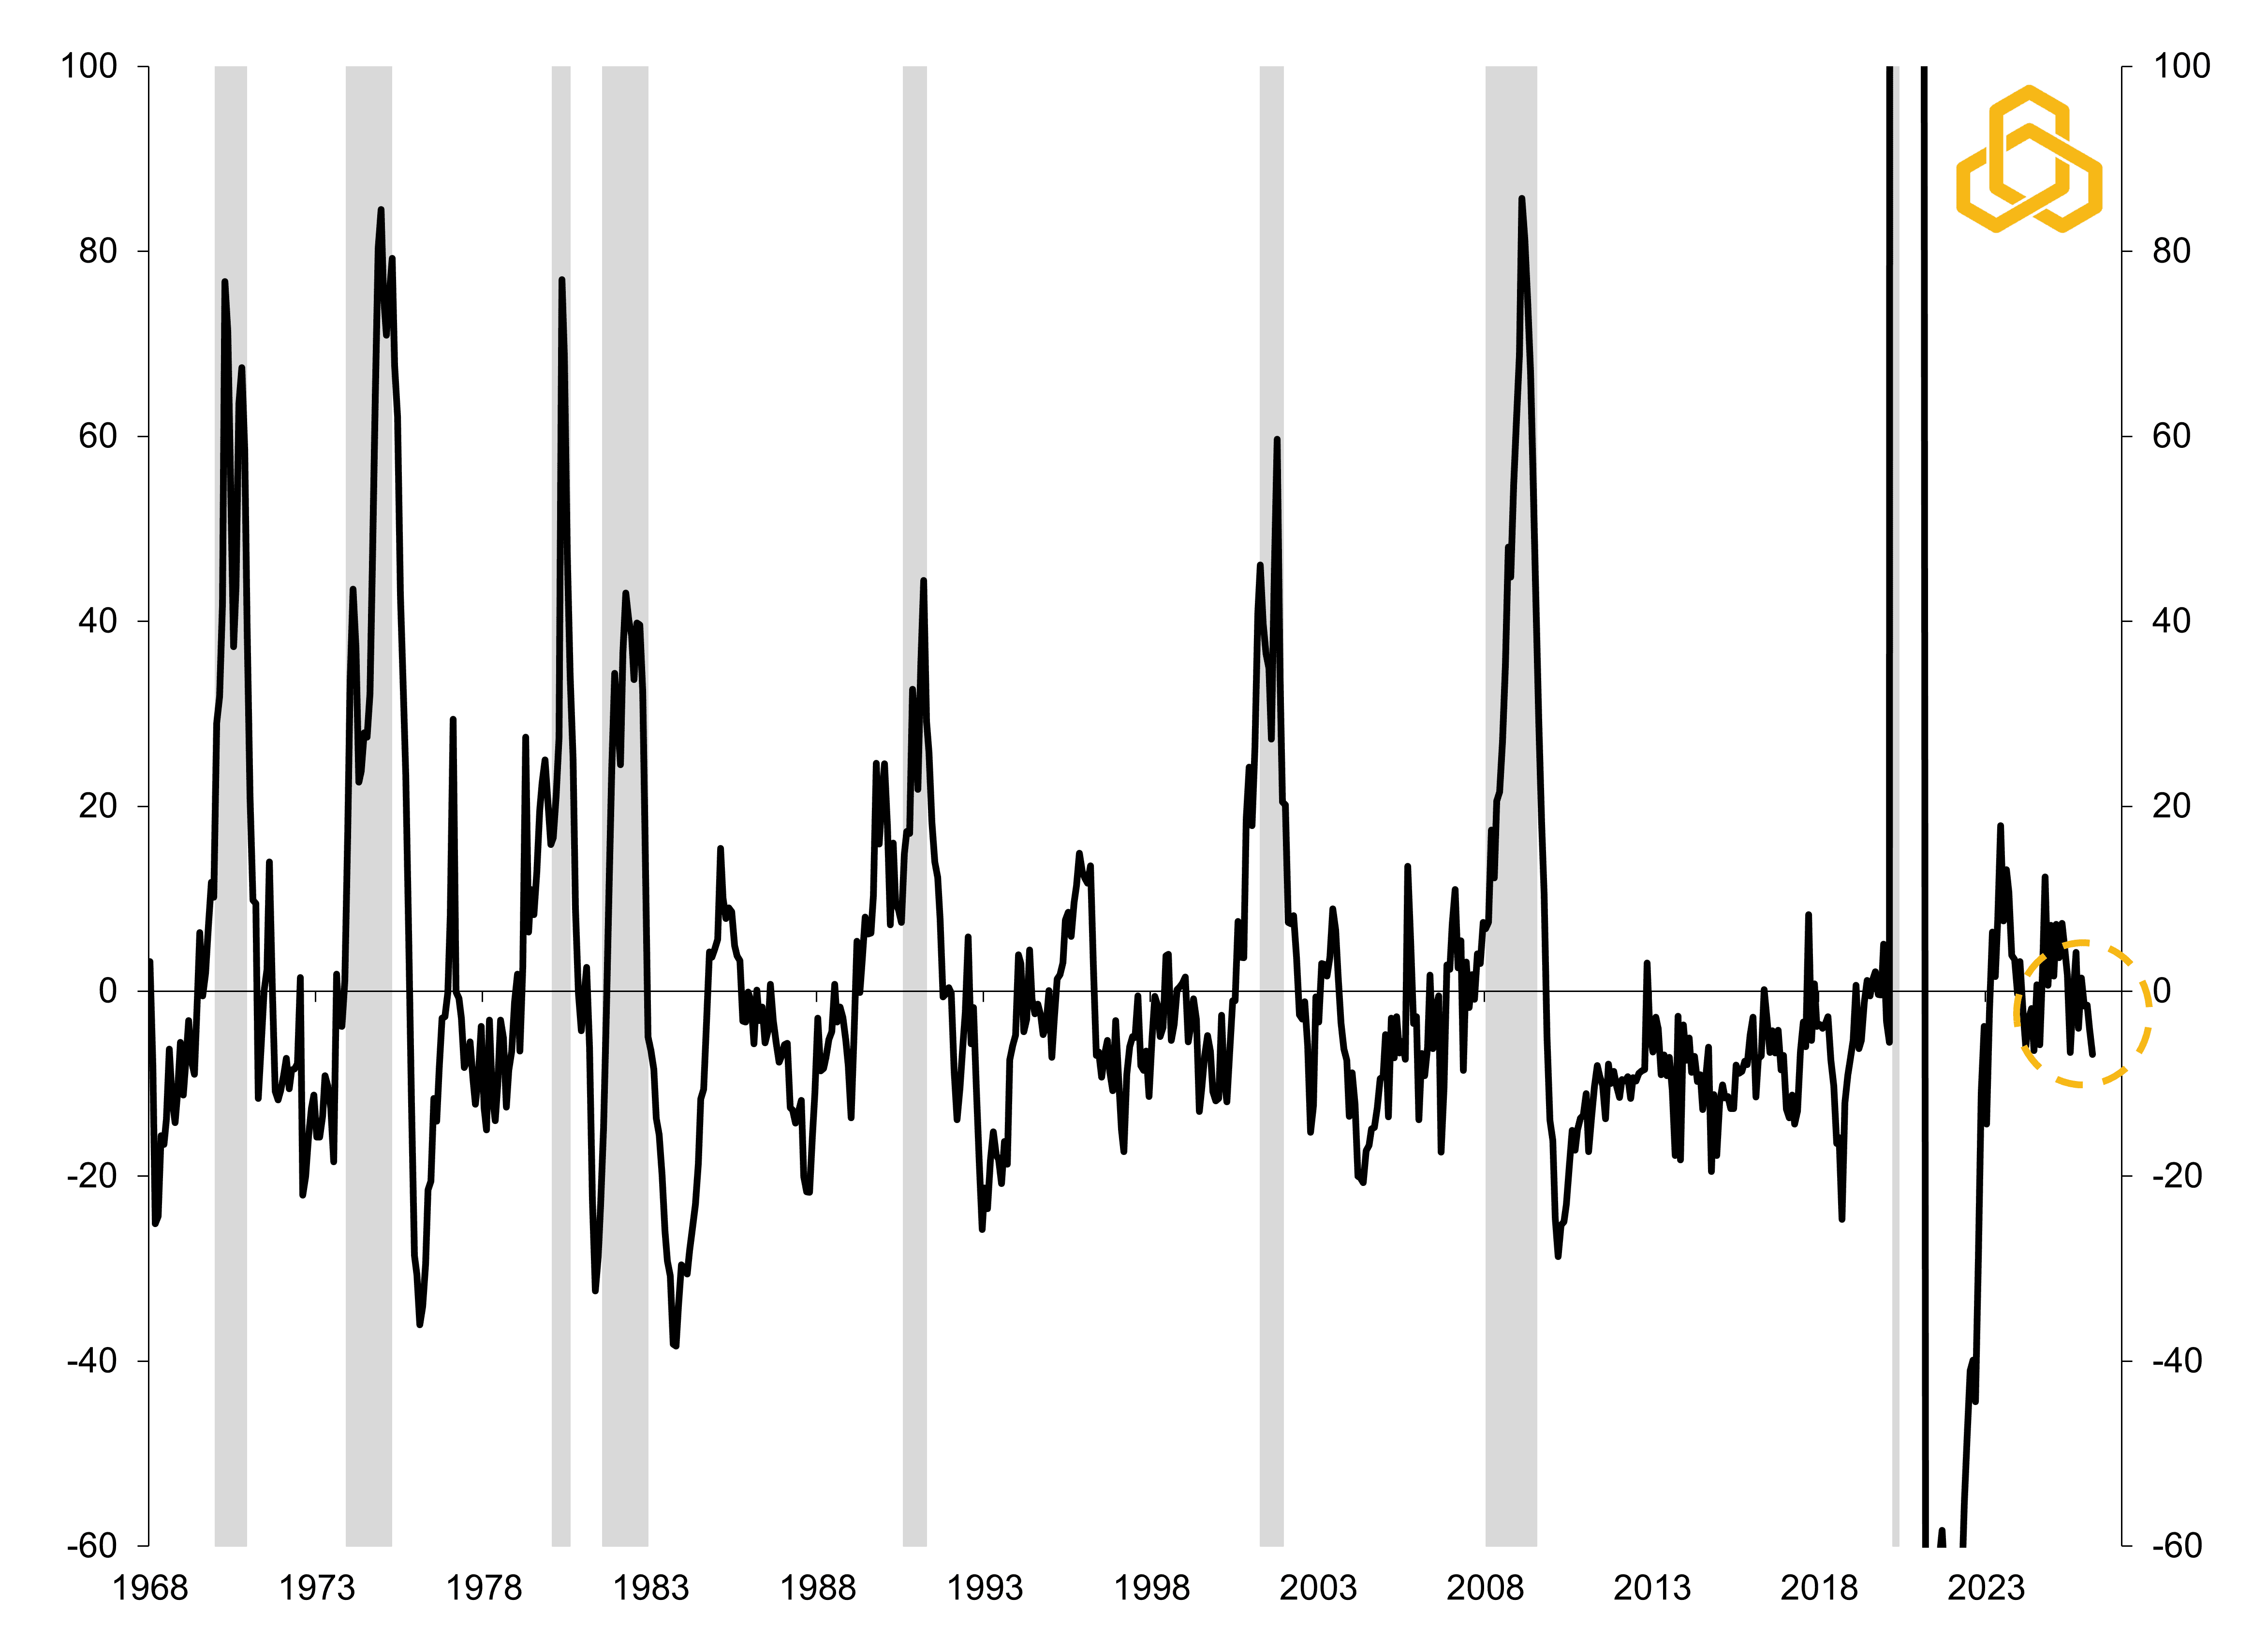
Sources: Department of Labor, National Bureau of Economic Research, Bloomberg, L.P., and Potomac. Data as of April 2, 2026. Note: Shaded regions denote periods of U.S. recession.
However, the economy still appears stuck in a “low-hire, low-fire” environment, with monthly payrolls flipping between positive and negative prints. The breadth of job gains also remains weak, with Healthcare and Social Assistance continuing to account for most of the hiring. In March, the sector added 90,000 of the 178,000 total jobs, including 35,000 workers returning from a strike. Excluding this sector, the U.S. economy has lost over half a million jobs since the end of 2024 (see figure 2).
Figure 2. Monthly Change in U.S. Nonfarm Employment Excluding Healthcare and Social Assistance (Thousands)
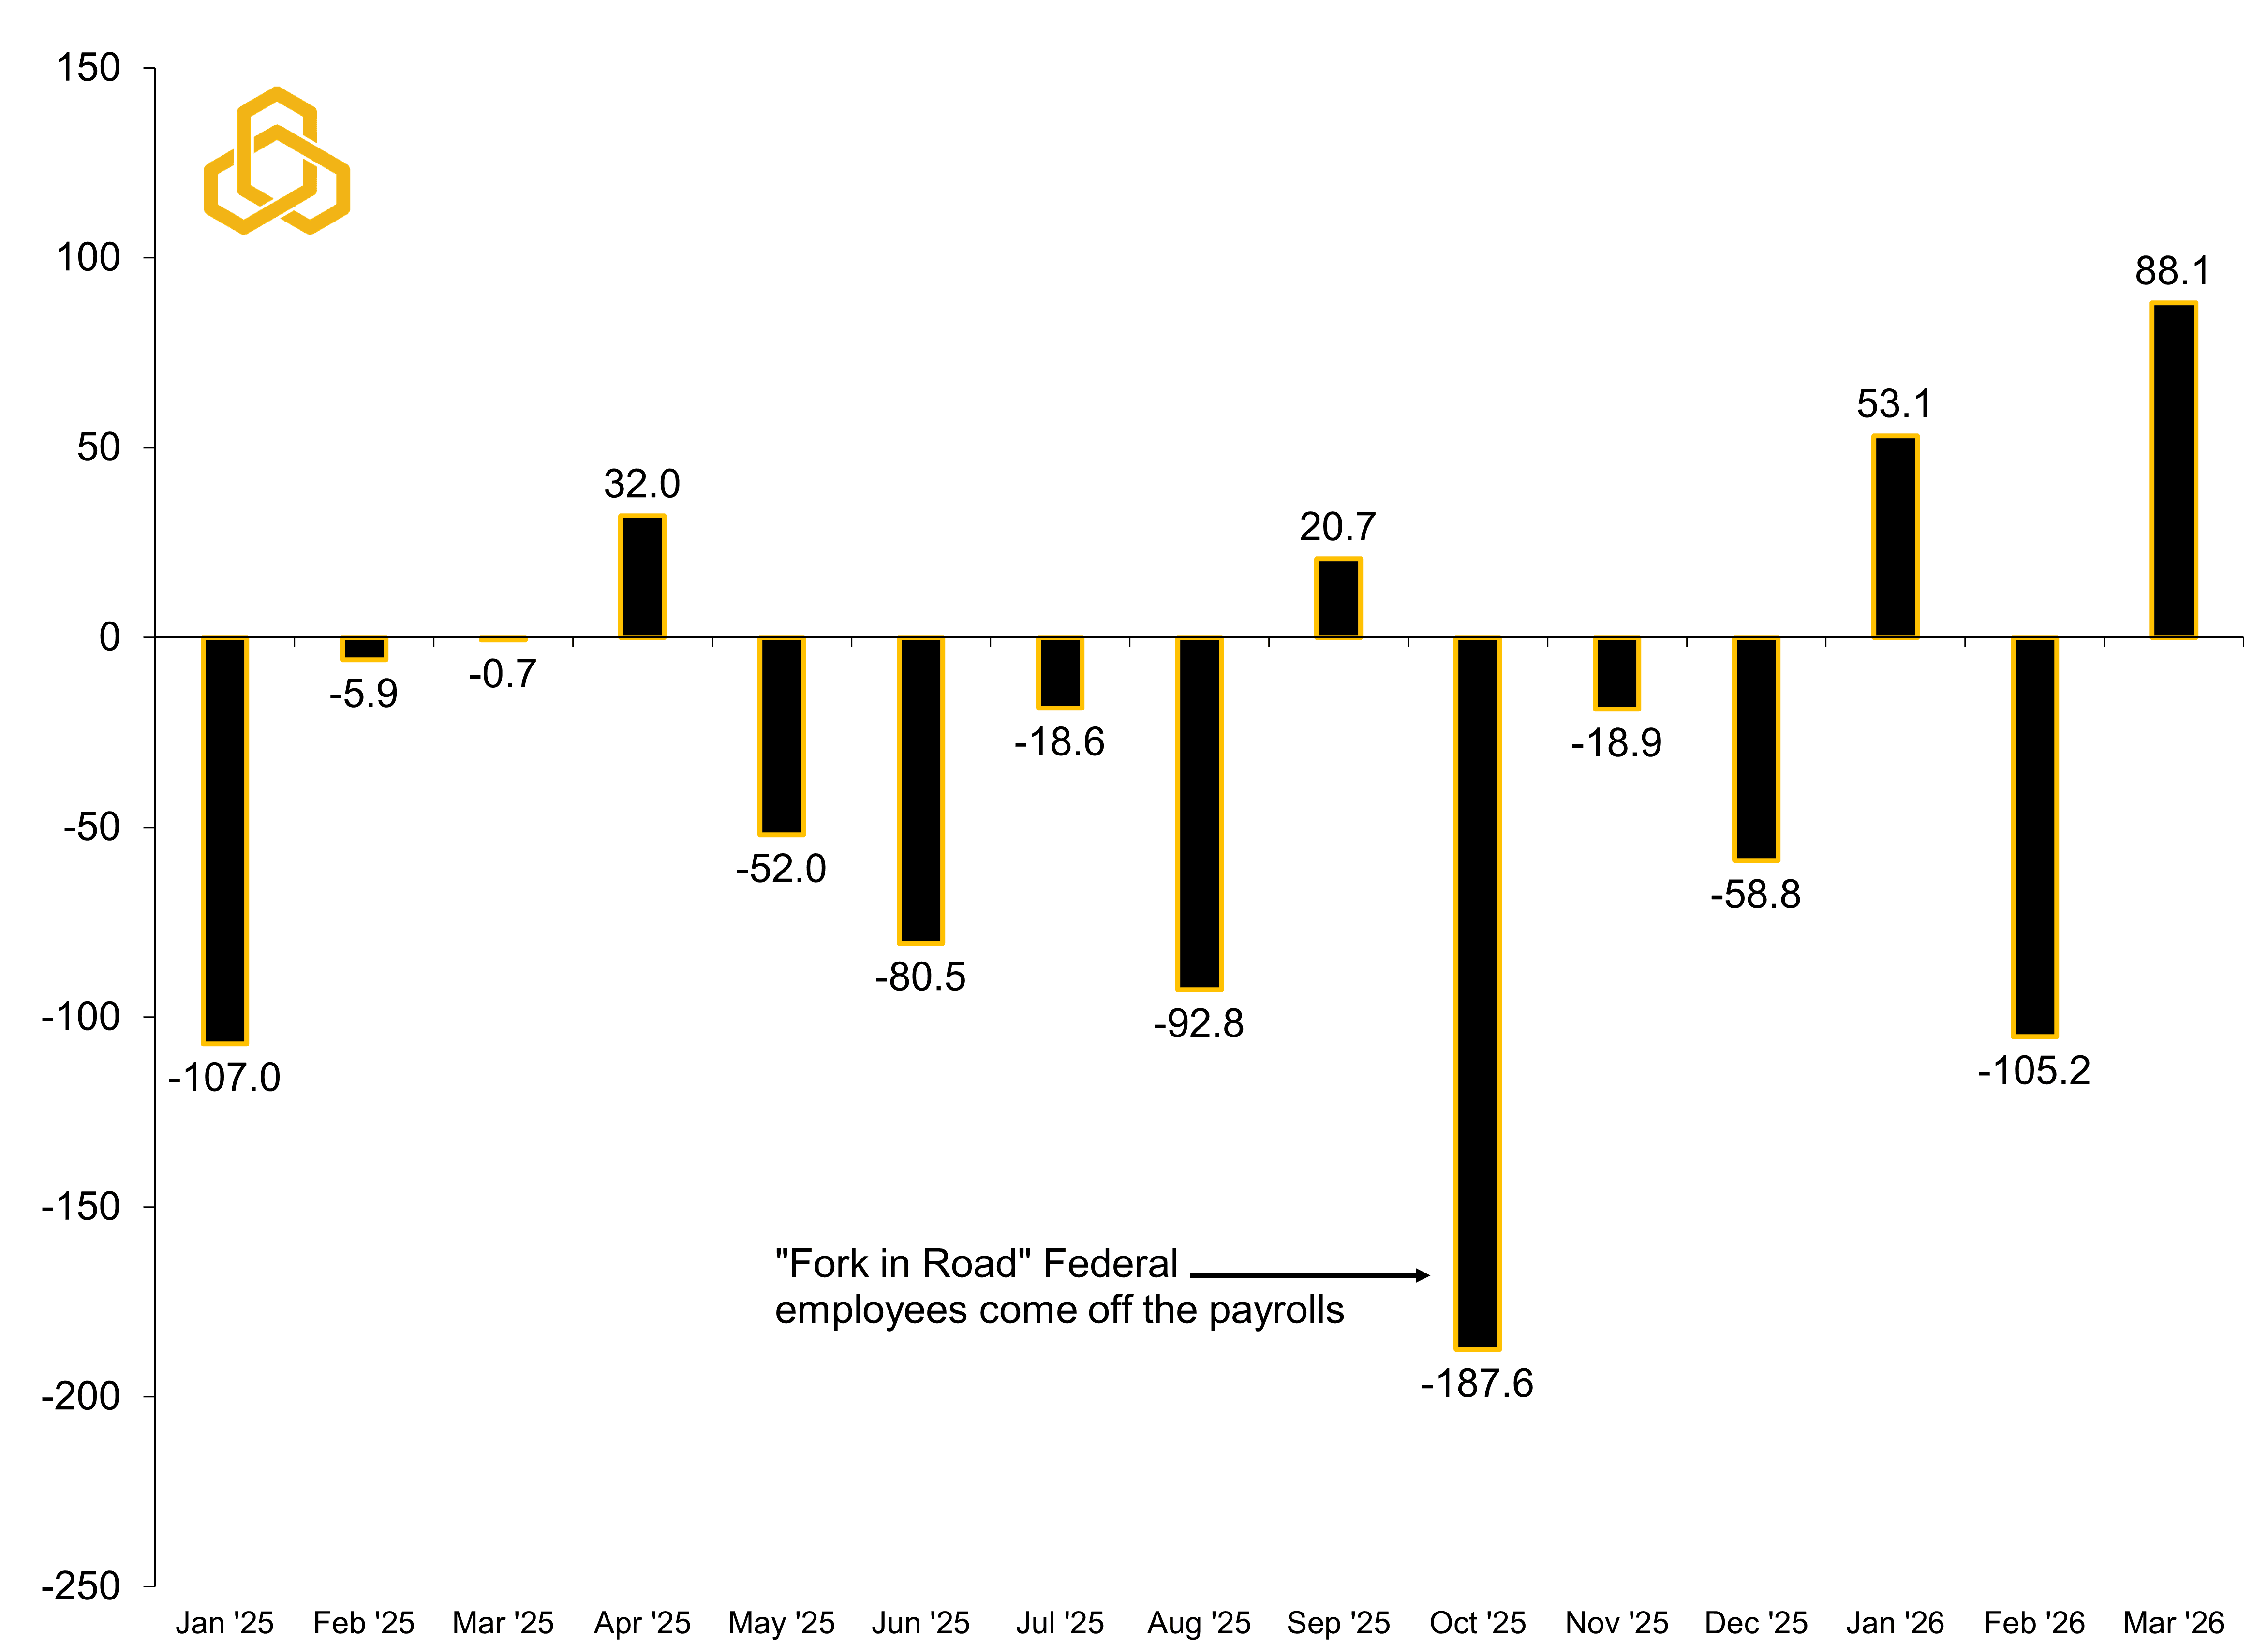
Sources: Bureau of Labor Statistics, Bloomberg, L.P., and Potomac. Data as of March 2026.
Combined, this has resulted in a gradual upward drift in the unemployment rate. While the unemployment rate ticked down to 4.3% in March, this was largely driven by a decline in labor force participation rather than a meaningful improvement in hiring. Looking ahead, the modest uptrend in unemployment is likely to resume as small business hiring plans continue to point to a softening labor market, particularly as the Fed remains on hold until inflation pressures ease (see figure 3).
Figure 3. Small Business Hiring Plans vs. the U.S. Unemployment Rate (%)
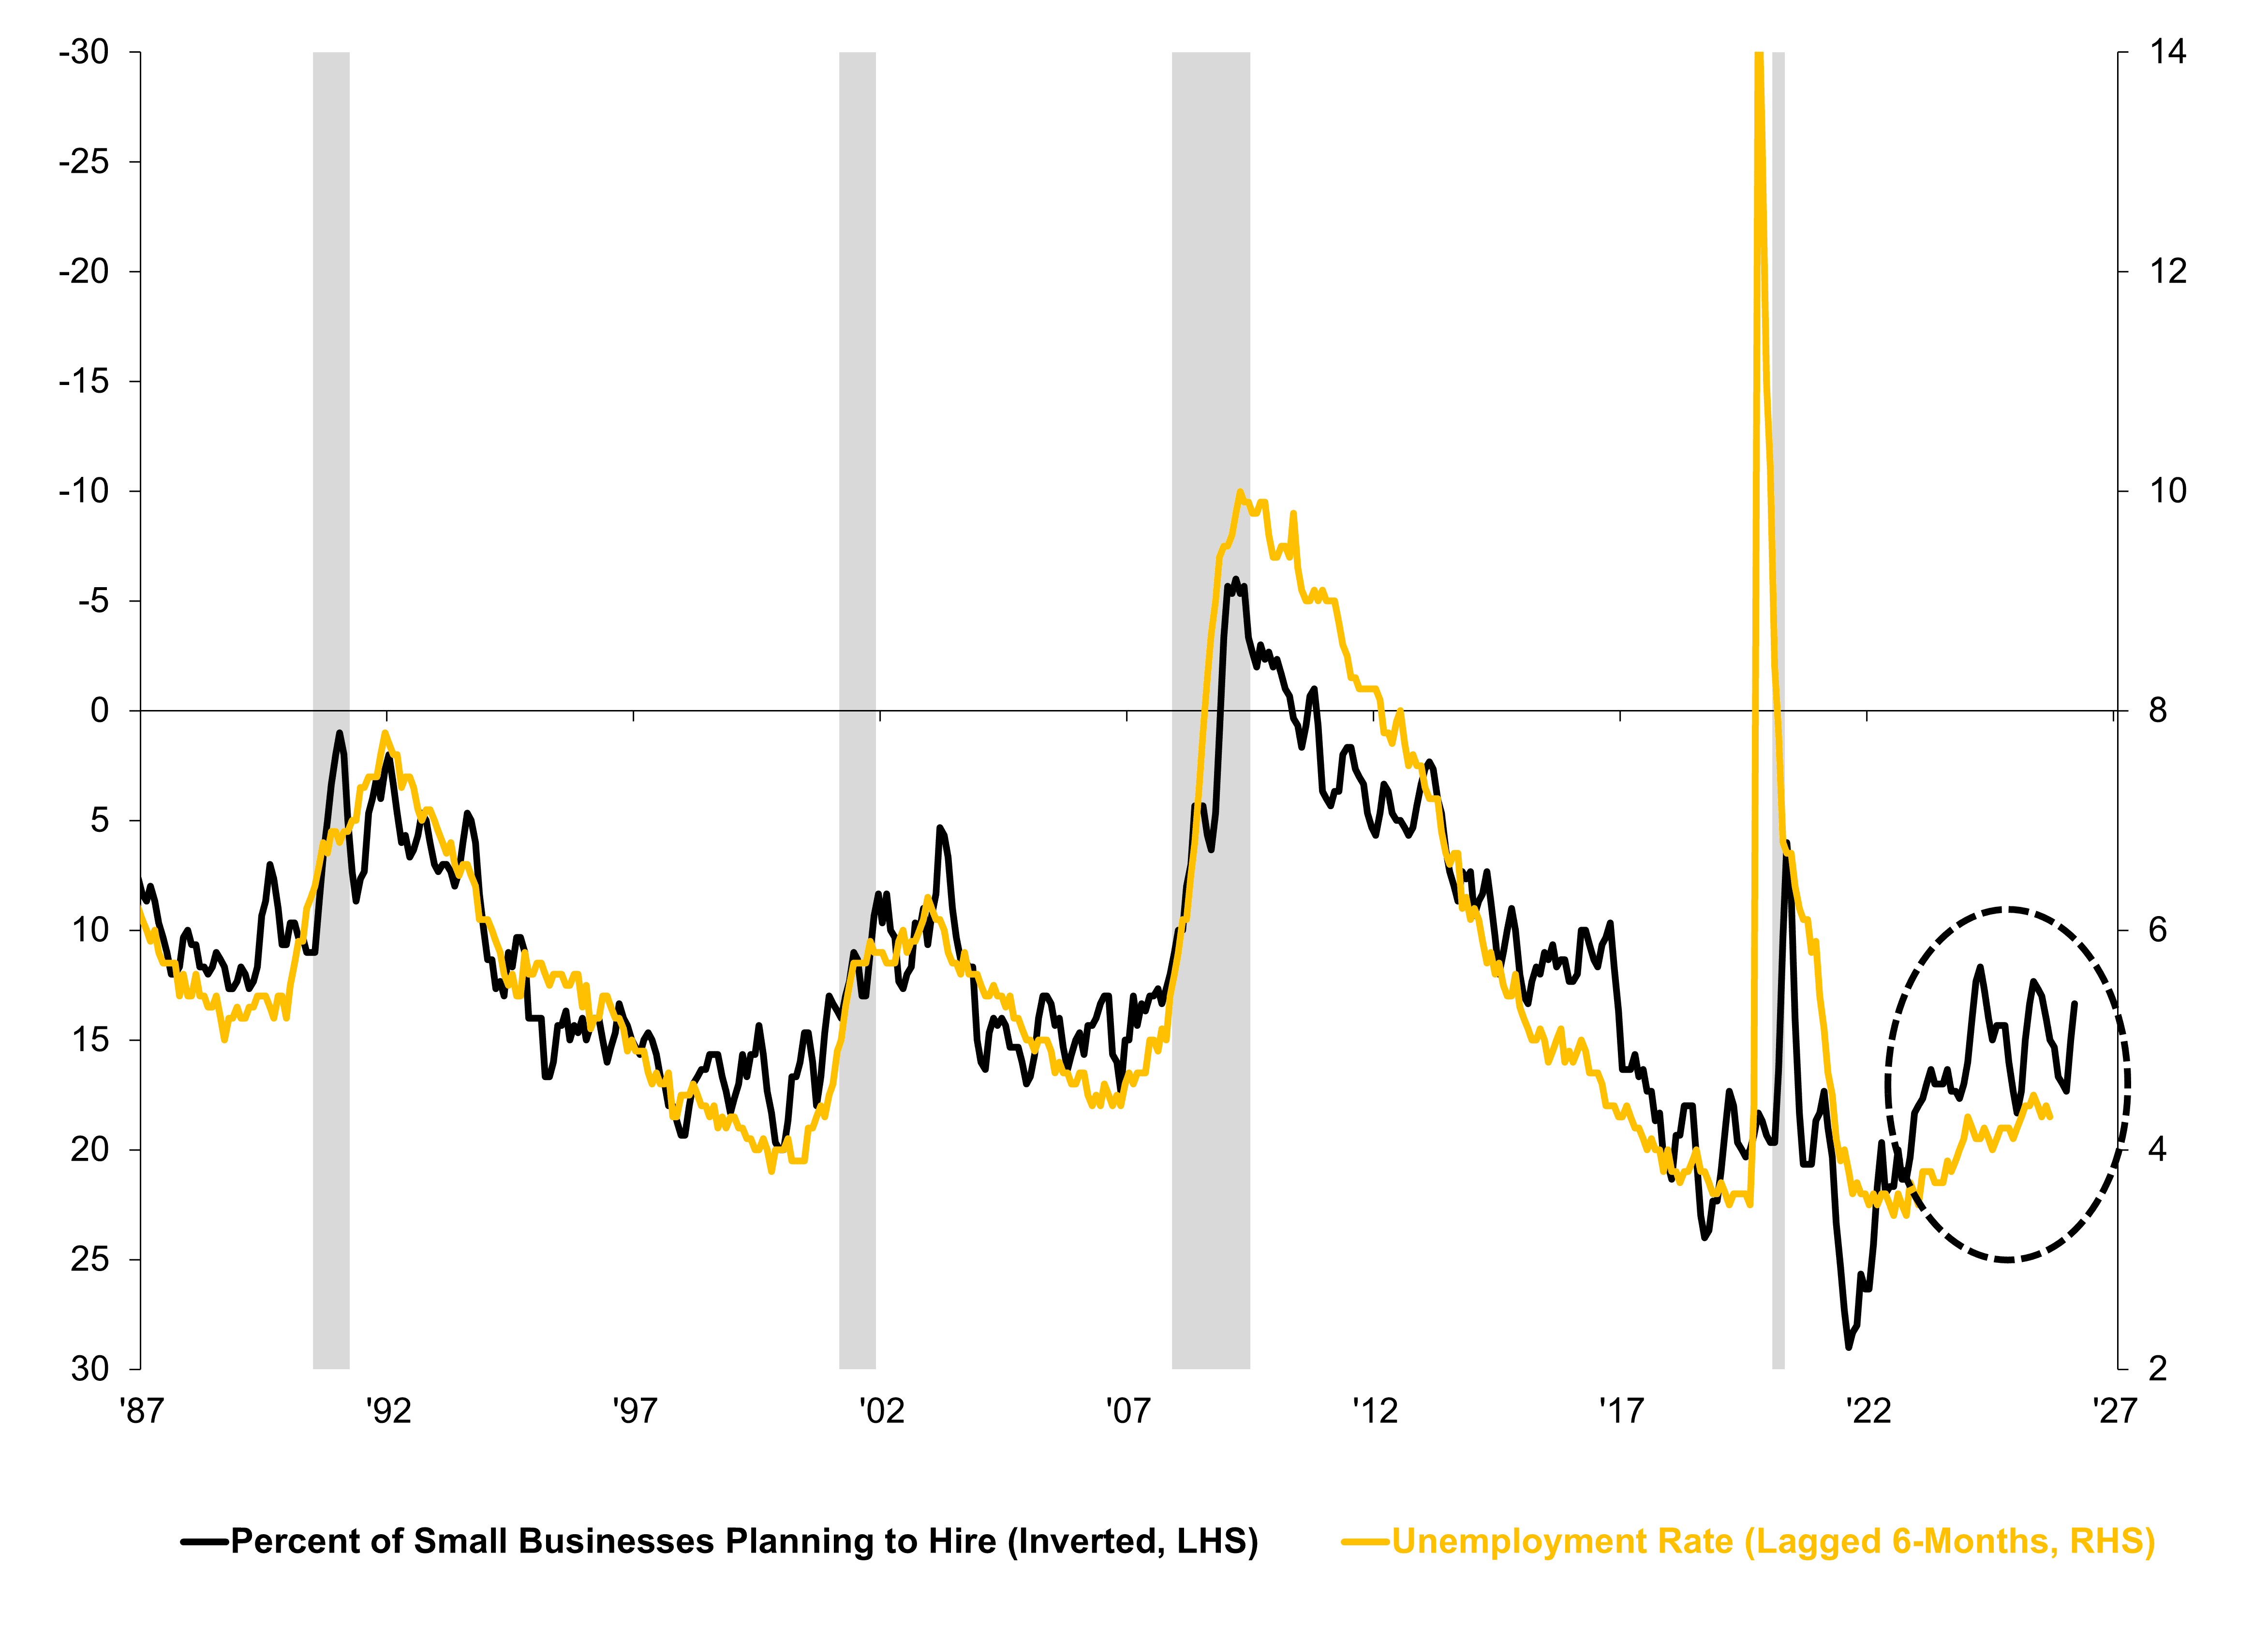
Sources: National Federation of Independent Business, Bureau of Labor Statistics, Bloomberg, L.P., and Potomac. Data as of March 2026.
Business Sentiment
On Wall Street, there is a difference between facts and feelings. Sentiment data, often referred to as “soft data,” do not always align with “hard data” like payrolls or CPI, but it remains a useful forward-looking gauge.
Last week, the Institute for Supply Management (ISM) released its March manufacturing and services surveys. These remain among the best leading indicators of economic activity, as new orders tend to translate into production and ultimately GDP. They also provide an early read on inflation.
On the manufacturing side, activity remained in expansion territory, but input prices surged. Services showed stronger demand, with new orders rising from 58.6 to 60.6, well above the 50 threshold that separates expansion from contraction. However, this strength was accompanied by notable weakness in the employment component.
Taken together, the surveys point to modestly stronger growth in the first quarter of 2026, with consensus expectations around 2.3%, but also to a renewed pickup in inflation (see figures 4 and 5).
Figure 4. Real U.S. GDP vs. Weighted ISM New Orders Index
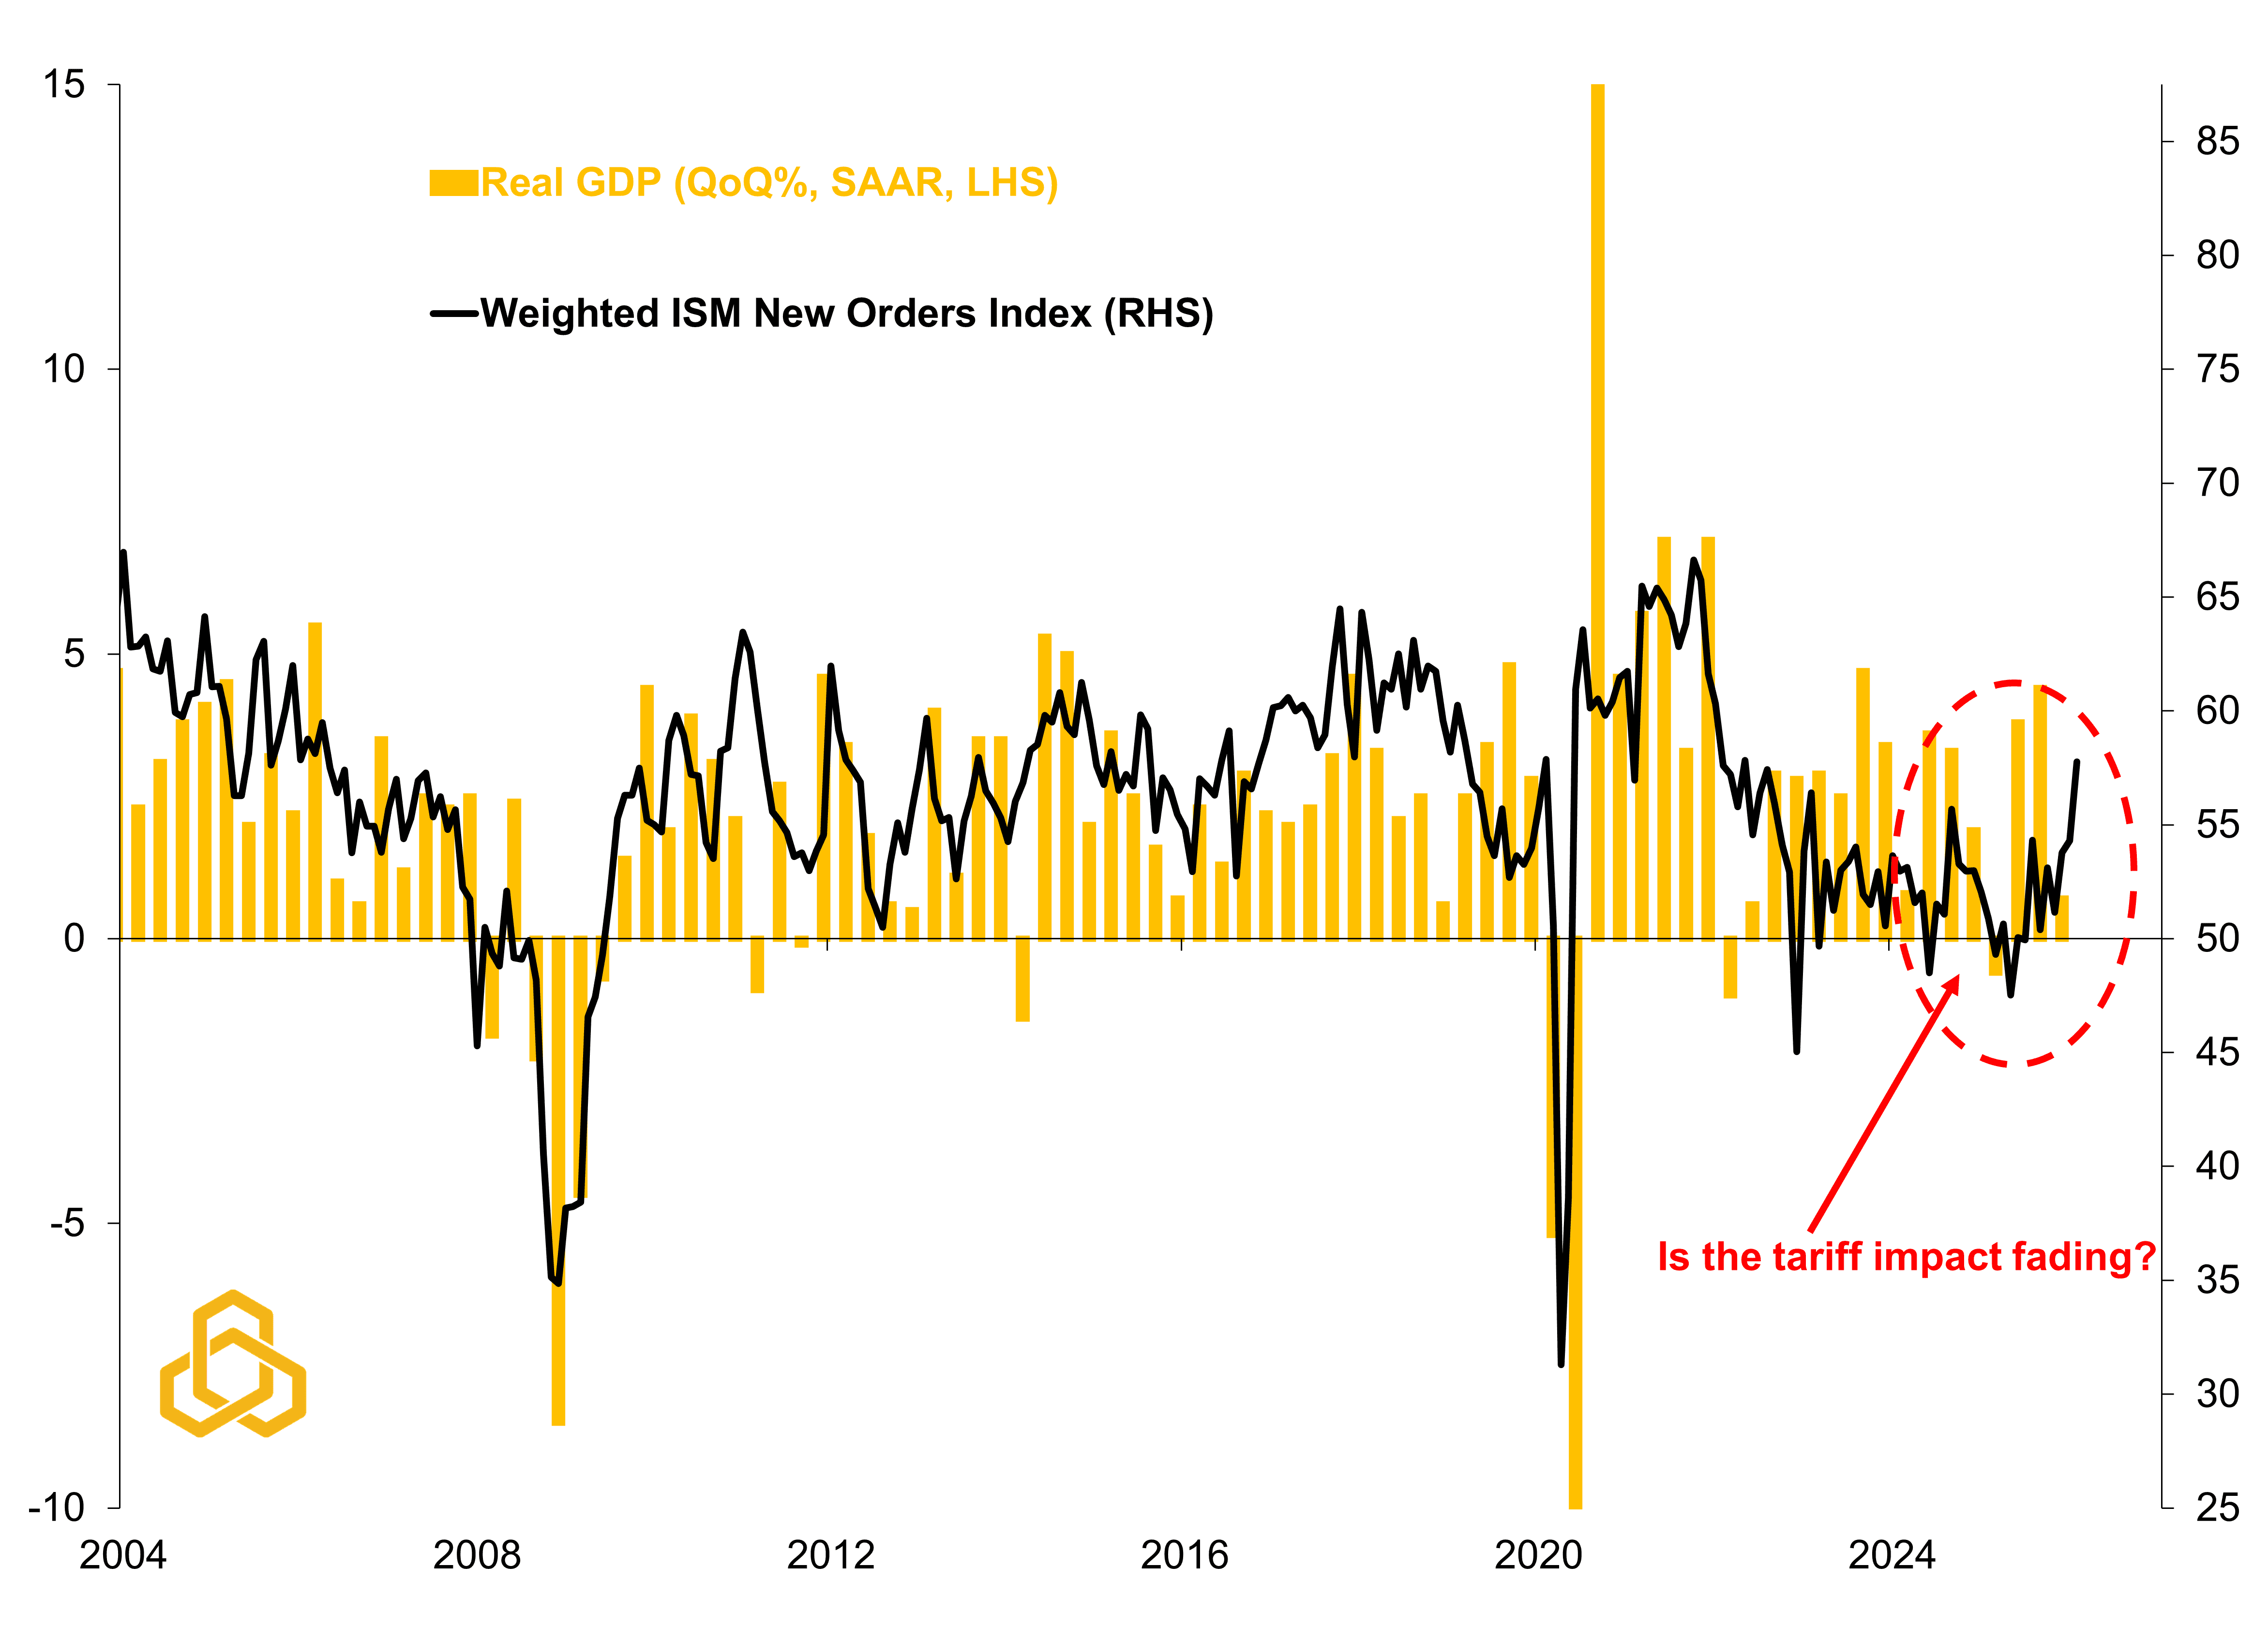
Sources: Bureau of Economic Analysis, Institute for Supply Management, Bloomberg, L.P., and Potomac. Data as of March 2026 for ISM; 4Q 2025 for GDP. Note 1: A reading above 50 is thought to be consistent with a rise in new orders and below 50 implies a contraction in new orders. Note 2: The weighted ISM index places a 30% weight on manufacturing and a 70% weight on services to reflect their respective weights in the U.S. economy.
Figure 5. Real U.S. GDP vs. Weighted ISM New Orders Index
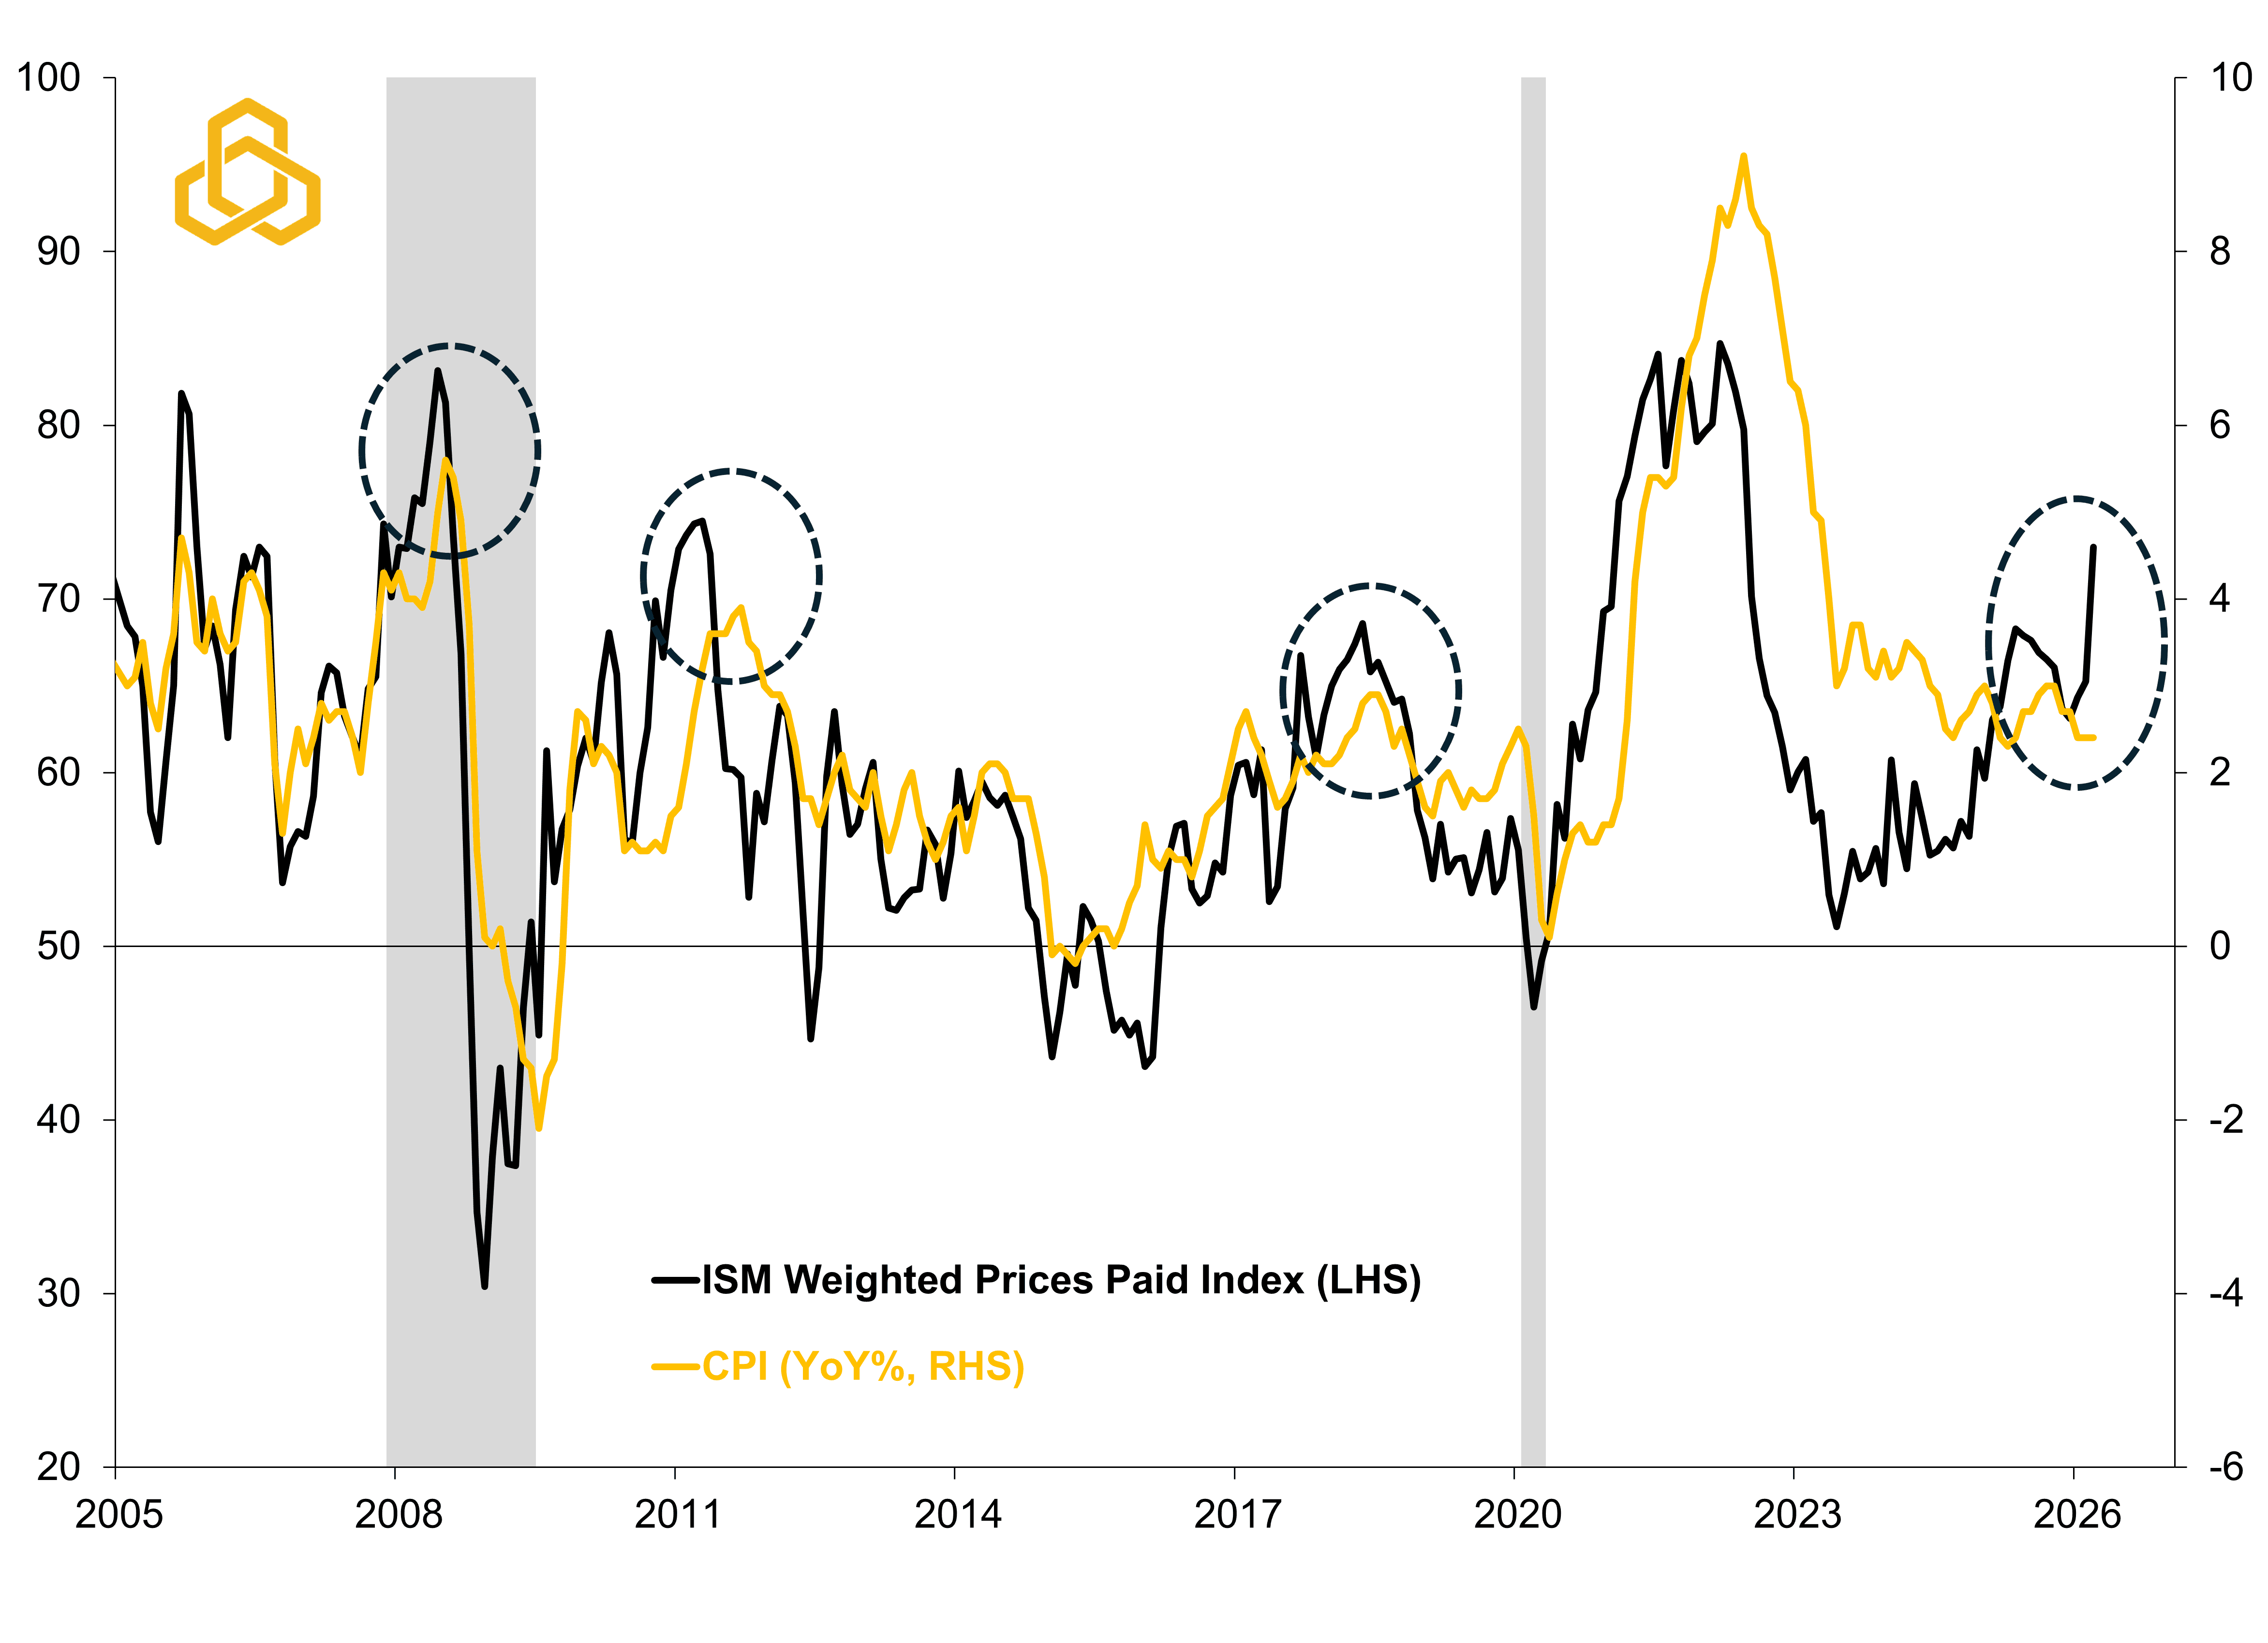
Sources: Institute for Supply Management, Bureau of Labor Statistics, Bloomberg, L.P., and Potomac. Data as of March 2026 for ISM; February 2026 for CPI. Note 1: A reading above 50 on the ISM prices paid index is thought to be consistent with rising input prices, below means prices are falling. Note 2: The weighted ISM index places a 30% weight on manufacturing and a 70% weight on services to reflect their respective weights in the U.S. economy. Note 3: Shaded regions denote periods of U.S. recession.
Inflation
As figure 5 suggests, the upcoming March CPI release may show a full percentage point increase, driven largely by the surge in energy costs tied to the Iran conflict, pushing inflation from 2.4% to 3.4%.
While the ISM Prices Paid Index points to inflation potentially running above 4%, it is worth noting that the series tends to overshoot realized CPI, as firms often absorb part of these cost increases through margins to maintain market share. Directionally, however, the signal aligns with other indicators, including the Cleveland Fed’s Nowcast (see figure 6). However, if the U.S. / Iran ceasefire holds then we would expect these pressures to gradually ease as the risk premium in oil prices fades. At the time of this writing, West Texas Intermediate futures are predicting prices to land around $71 per barrel by year end (down from a settlement high of roughly $133 per barrel on April 7th).
Figure 6. U.S. Consumer Price Index vs. Cleveland Fed’s CPI Nowcast
Sources: Bureau of Labor Statistics, Federal Reserve Bank of Cleveland, Bloomberg, L.P., and Potomac. Data as of April 7, 2026 for Nowcast; February 2026 for CPI. All forecasts are expressions of opinion and are subject to change without notice and are not intended to be a guarantee of future events.
The Third Party: The Federal Reserve
The Federal Reserve is the third party in this relationship, and it may be the one driving the commitment issues.
At the start of the year, markets expected additional rate cuts. Instead, the Iran conflict reinforced inflation concerns at a critical juncture, leaving the Fed effectively on hold.
That said, the stock market is a leading indicator and typically moves ahead of policy. With the recent two-week ceasefire announcement, investors may start to put rate cuts back on the table which could bolster equities, but inflation data are notorious for being lagged data. It may take some time to get further clarity from the Fed as it remains sidelined as it waits for clearer signals.
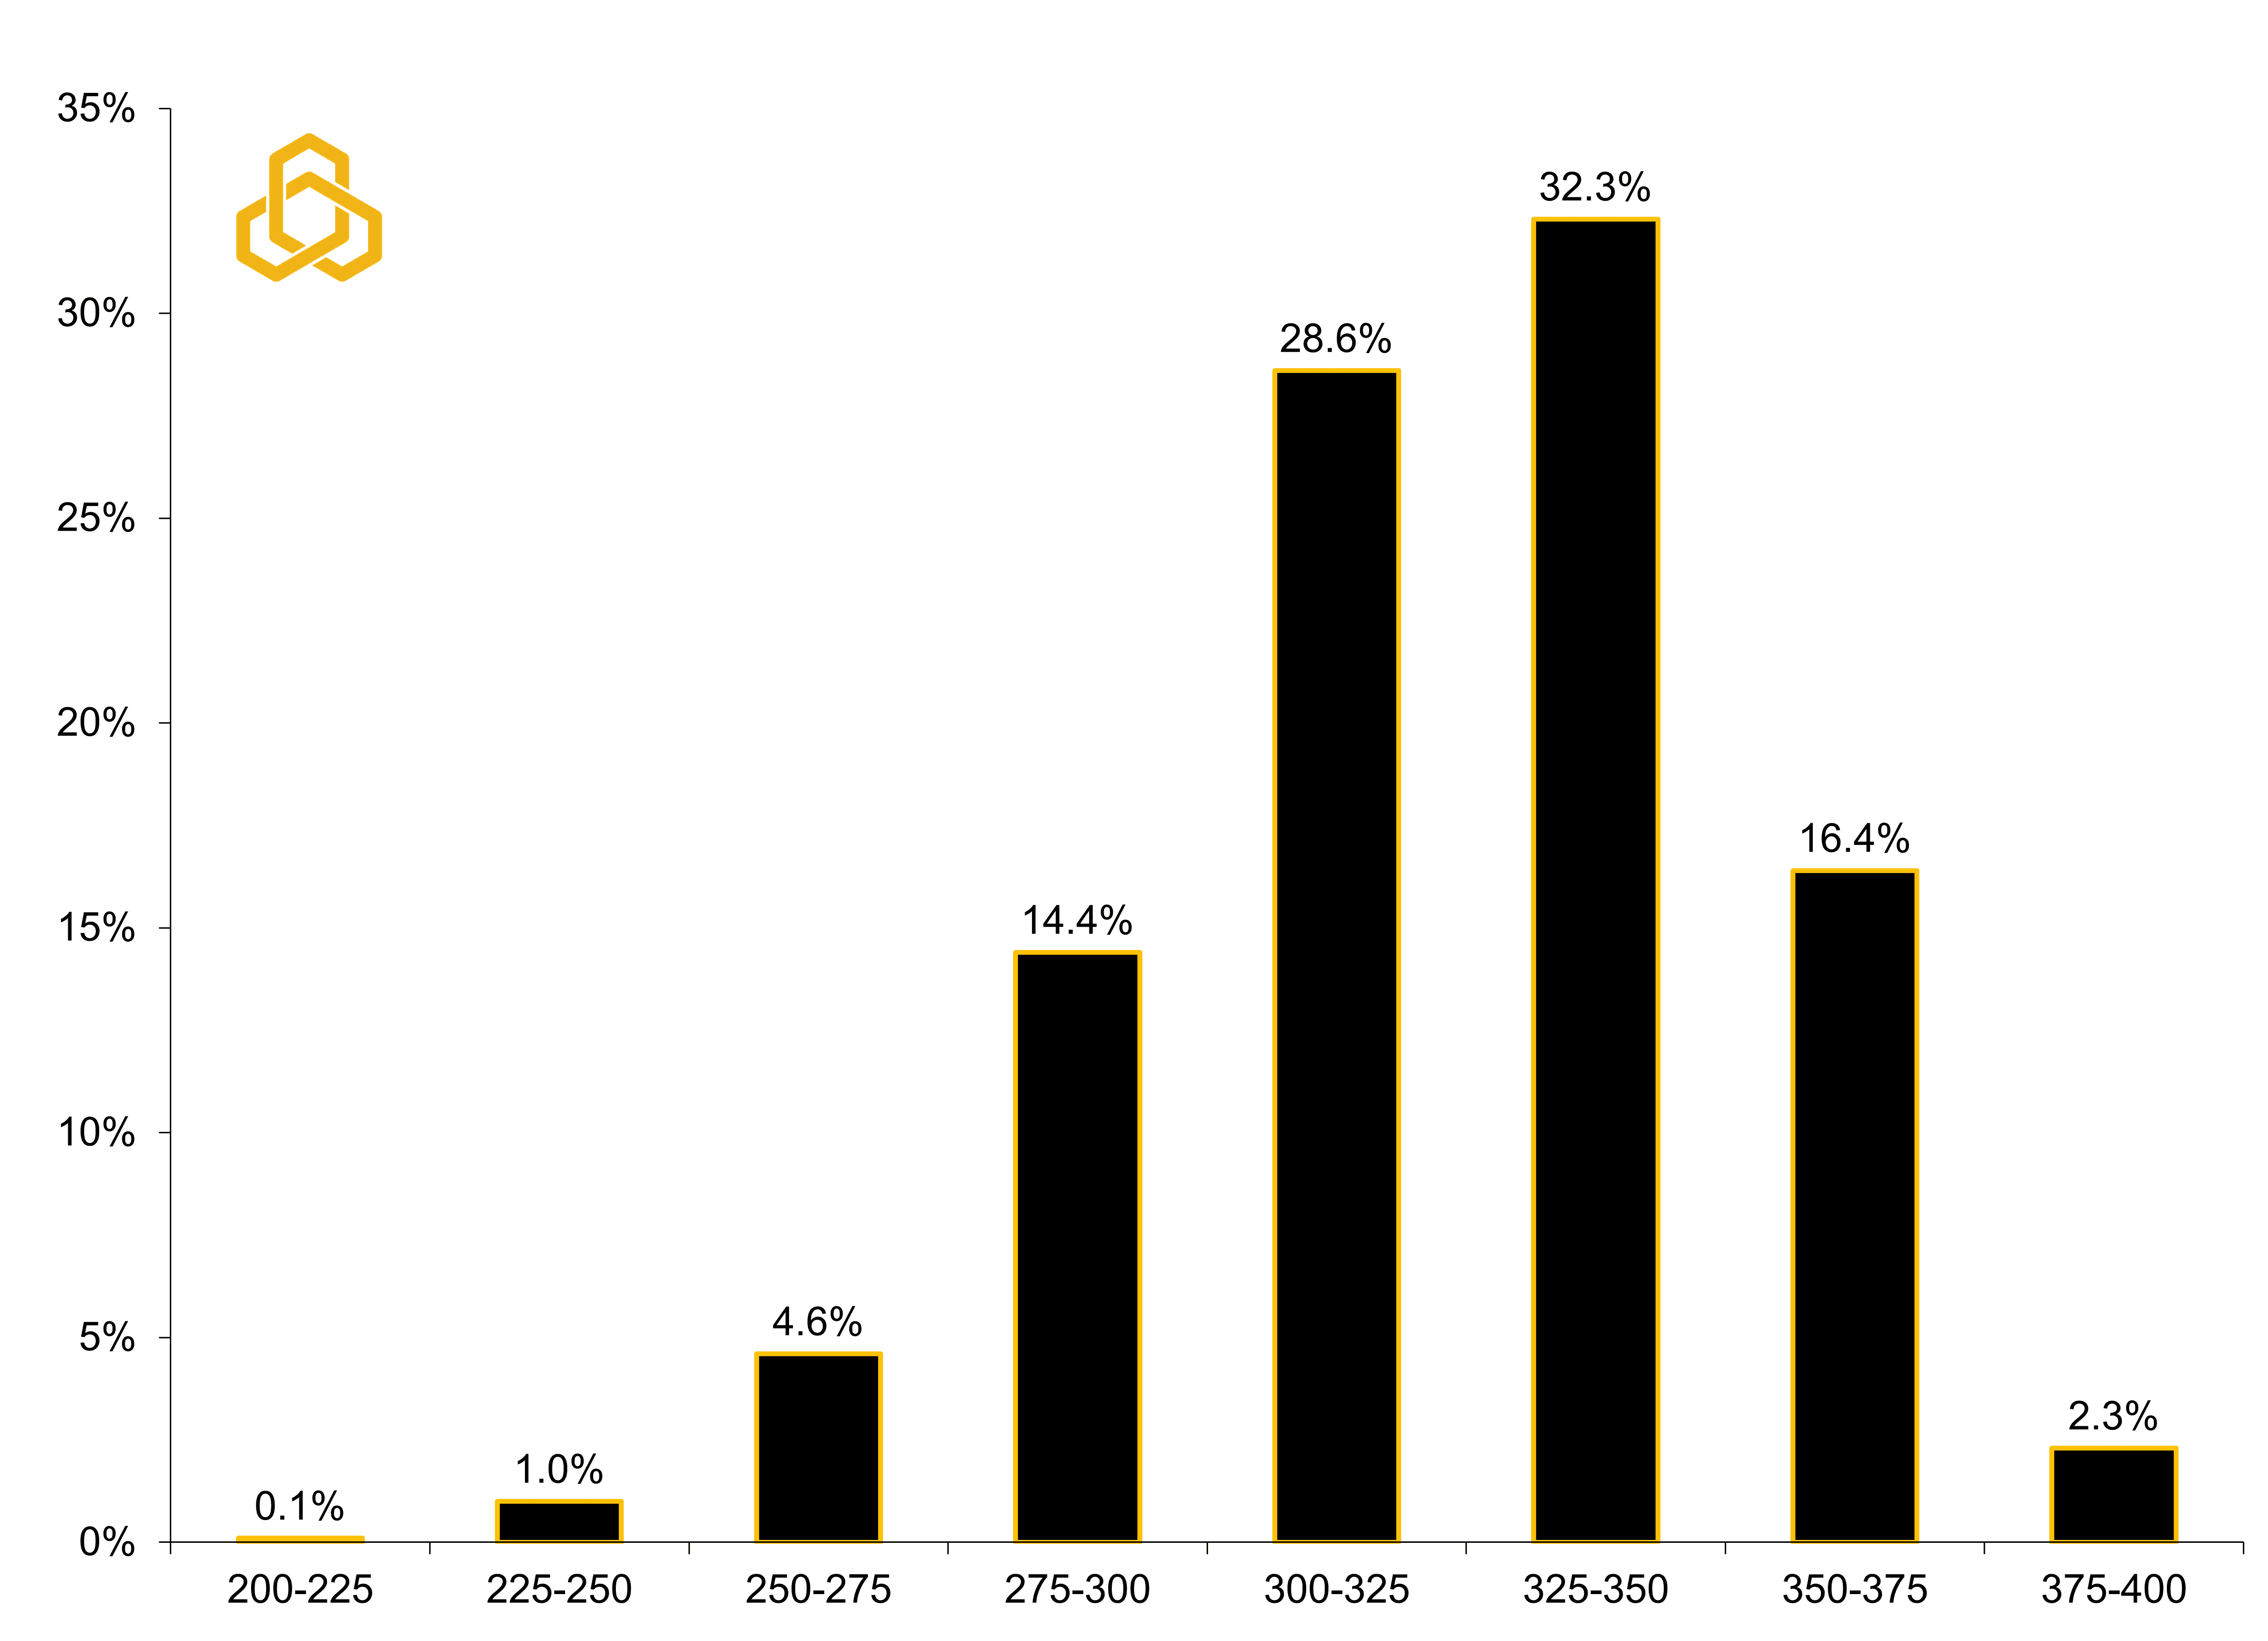
Following the announcement of the two-week ceasefire between the U.S. and Iran, investors seem to be breathing a sigh of relief, but Fed funds futures are still showing just a 49% probability of more than one rate cut by the end of 2027 (see figure 7). This suggests to us that investors may still be a bit hesitant after the relief rally to make future plans while they reassess their options.
Figure 7. Fed Fund Futures Target Rate Probabilities for Dec. 8, 2027 Meeting
Sources: CME and Potomac. Data as of April 8, 2026. All forecasts are expressions of opinion and are subject to change without notice and are not intended to be a guarantee of future events.
Weekly “Keeping it Strait” Highlights:
Pakistan brokered a two-week ceasefire between the U.S. and Iran. As a result, Polymarket’s bet for a ceasefire by April 30 has been officially closed.
Oil prices declined globally with West Texas Intermediate sliding from $100.12 per barrel to $93.90 per barrel and Brent crude falling to $92.83 per barrel. Gas prices tend to lag oil prices, but we would expect to see some relief at the pump soon.
Treasury yields came down a bit. Rate cuts are not yet back on the table for 2026 according to Fed fund futures, but a rate hike appears to be officially off the table.
Tanker rates remain elevated, but the Baltic Exchange Dirty Tanker Index is now 6.4% off its March 27th high of $3,737.
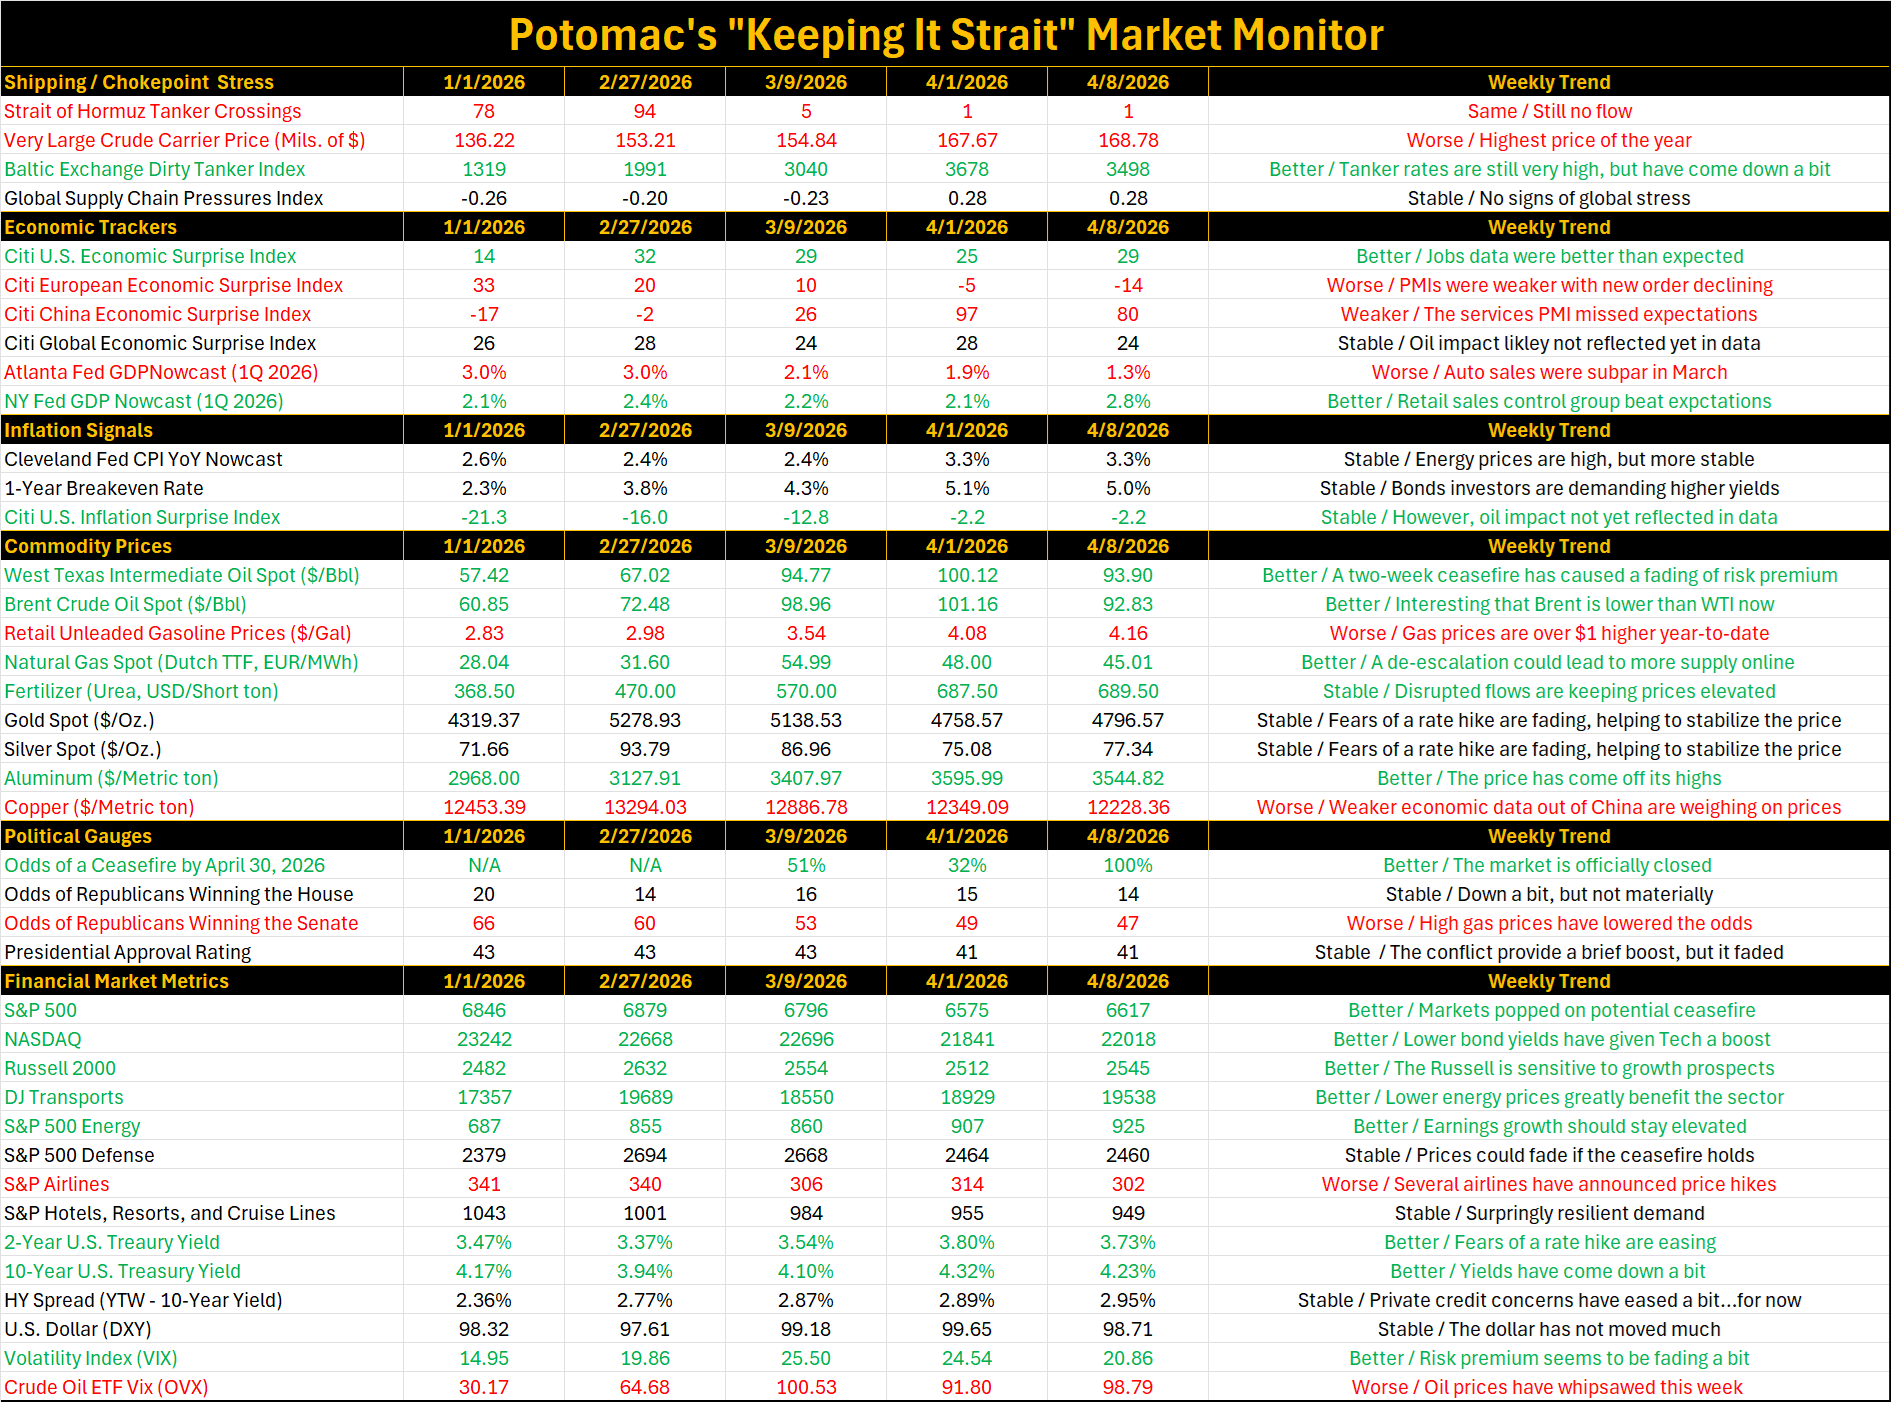
Source: Bloomberg L.P. and Potomac. Data as of April 8, 2026. Note 1: The dates selected are 2/27/2026 (start of the conflict), 3/9/2026 (initial oil surge/peak as the Strait closed), and the latest week and previous week to compare the weekly trend. Note 2: Economic and inflation surprise index readings about zero imply that data are beating the consensus on average, below zero means that data are missing expectations. Note 3: In commodity prices, we ranked higher oil, natural gas, retail gas, fertilizer, and aluminum prices as bad for the economy because it weighs on growth, we ranked rising gold and silver prices are good due to the investor perspective. Note 4: Political betting market odds are forecasts. All forecasts are expressions of opinions and are subject to change without notice and are not intended to be a guarantee.
PFM-324-20260408


