
What is Modern Portfolio Theory?
Financial advisors typically start their initial investment conversation by determining the client's comfort level with risk.
Harry Markowitz, a Nobel Prize-winning economist, formed the most common method for determining the maximum return for the newly discovered risk tolerance within a buy-and-hold investment strategy.
He created the modern portfolio theory (MPT), which states that assets can be mixed within a portfolio to maximize return for a given level of risk.
The Inputs
Modern Portfolio Theory requires three inputs:
Expected Return
Standard Deviation
Correlation
Expected return and standard deviation represent the expected future return of an asset and the dispersion around that return (standard deviation). Each asset has its own expected return and standard deviation.
The third input is correlation, the degree of co-movement between two variables. Put differently, correlation measures whether the return streams of assets move in the same direction.
For modern portfolio theory, each asset in the mix relies heavily on each input's historical values to continue in the future as they were in the past, which is a big assumption for passive investors.
Most crucial variable
Correlation is measured between each asset, and as such, it has more inputs than return and standard deviation.
For example, a simple three-asset portfolio would have three inputs for return, variance, and correlation. A 10-asset portfolio, however, would have ten returns, ten variances, and forty-five correlations.
As shown, the number of cross-correlations increases exponentially with the number of assets being considered. Because of this, any change in correlation estimates would result in a substantial change in optimal asset weights, even with no change in return or volatility.
Correlation is ever-changing. Predicting that future correlation will remain as it was in the past poses significant risk. Likewise, estimating what correlation will be in the future introduces significant room for error in optimization outputs.
Mean-Variance Optimization
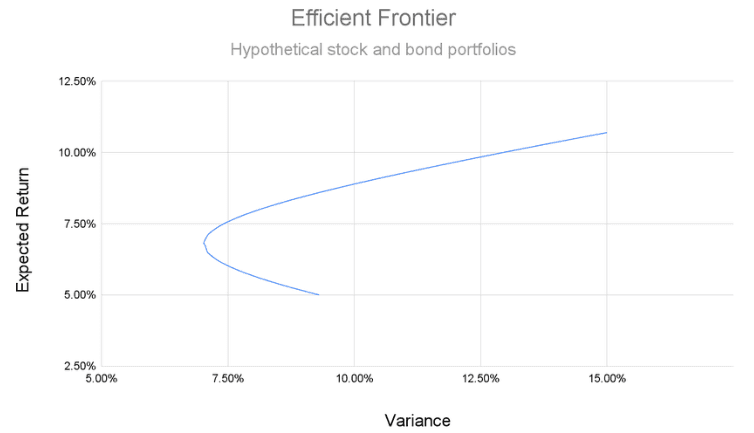
Using all three inputs, the process to determine an optimal allocation is the mean-variance optimization. This method produces an efficient frontier, which is a line representing a set of optimal portfolios that yield the highest return for differing levels of risk.
Each point on the frontier is a different mix of assets (chart from The Motley Fool). Different asset weights produce varying risk and return combinations, represented by the blue line, the efficient frontier.
The Risk of Prediction
Prediction lies at the heart of mean-variance optimization. The investor must decide the best estimate for each of the three variables going forward. They typically default to historical values.
Any difference from the historical estimate will result in a vastly different future outcome compared to the past.
To illustrate, view the chart below (from Proactive Advisor Magazine). Each efficient frontier represents a different decade, and each point along the frontier represents a different stock/bond allocation for that decade.
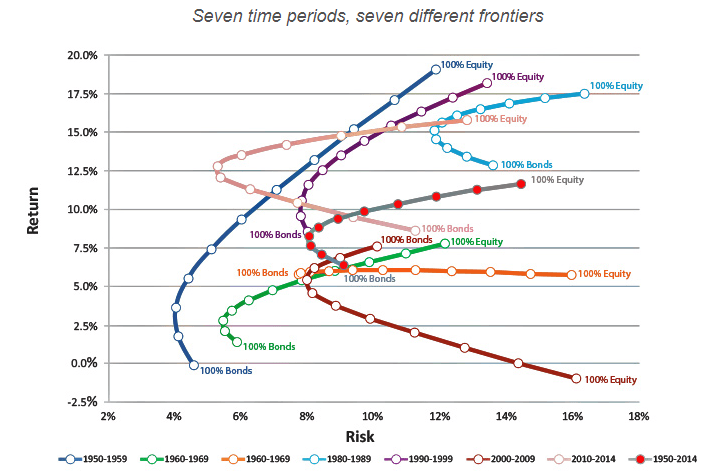
Each of the seven decades has had a different efficient frontier. Predicting the best mix of stocks and bonds for the next decade is challenging because the optimal allocation continually shifts.
Recency Bias
Much like mean-variance optimization, investors often choose their allocation based on what has performed best in the more recent past.
From Charles Schwab: "Recency bias is the tendency to place too much emphasis on experiences that are freshest in your memory-even if they are not the most relevant or reliable."
Applying this to financial markets means that, like mean-variance optimization, investors gravitate to the strategy that performed best in the most recent past.
A widely followed example of this occurred in 2020 and 2021 with the ARK Innovation ETF (ARKK).
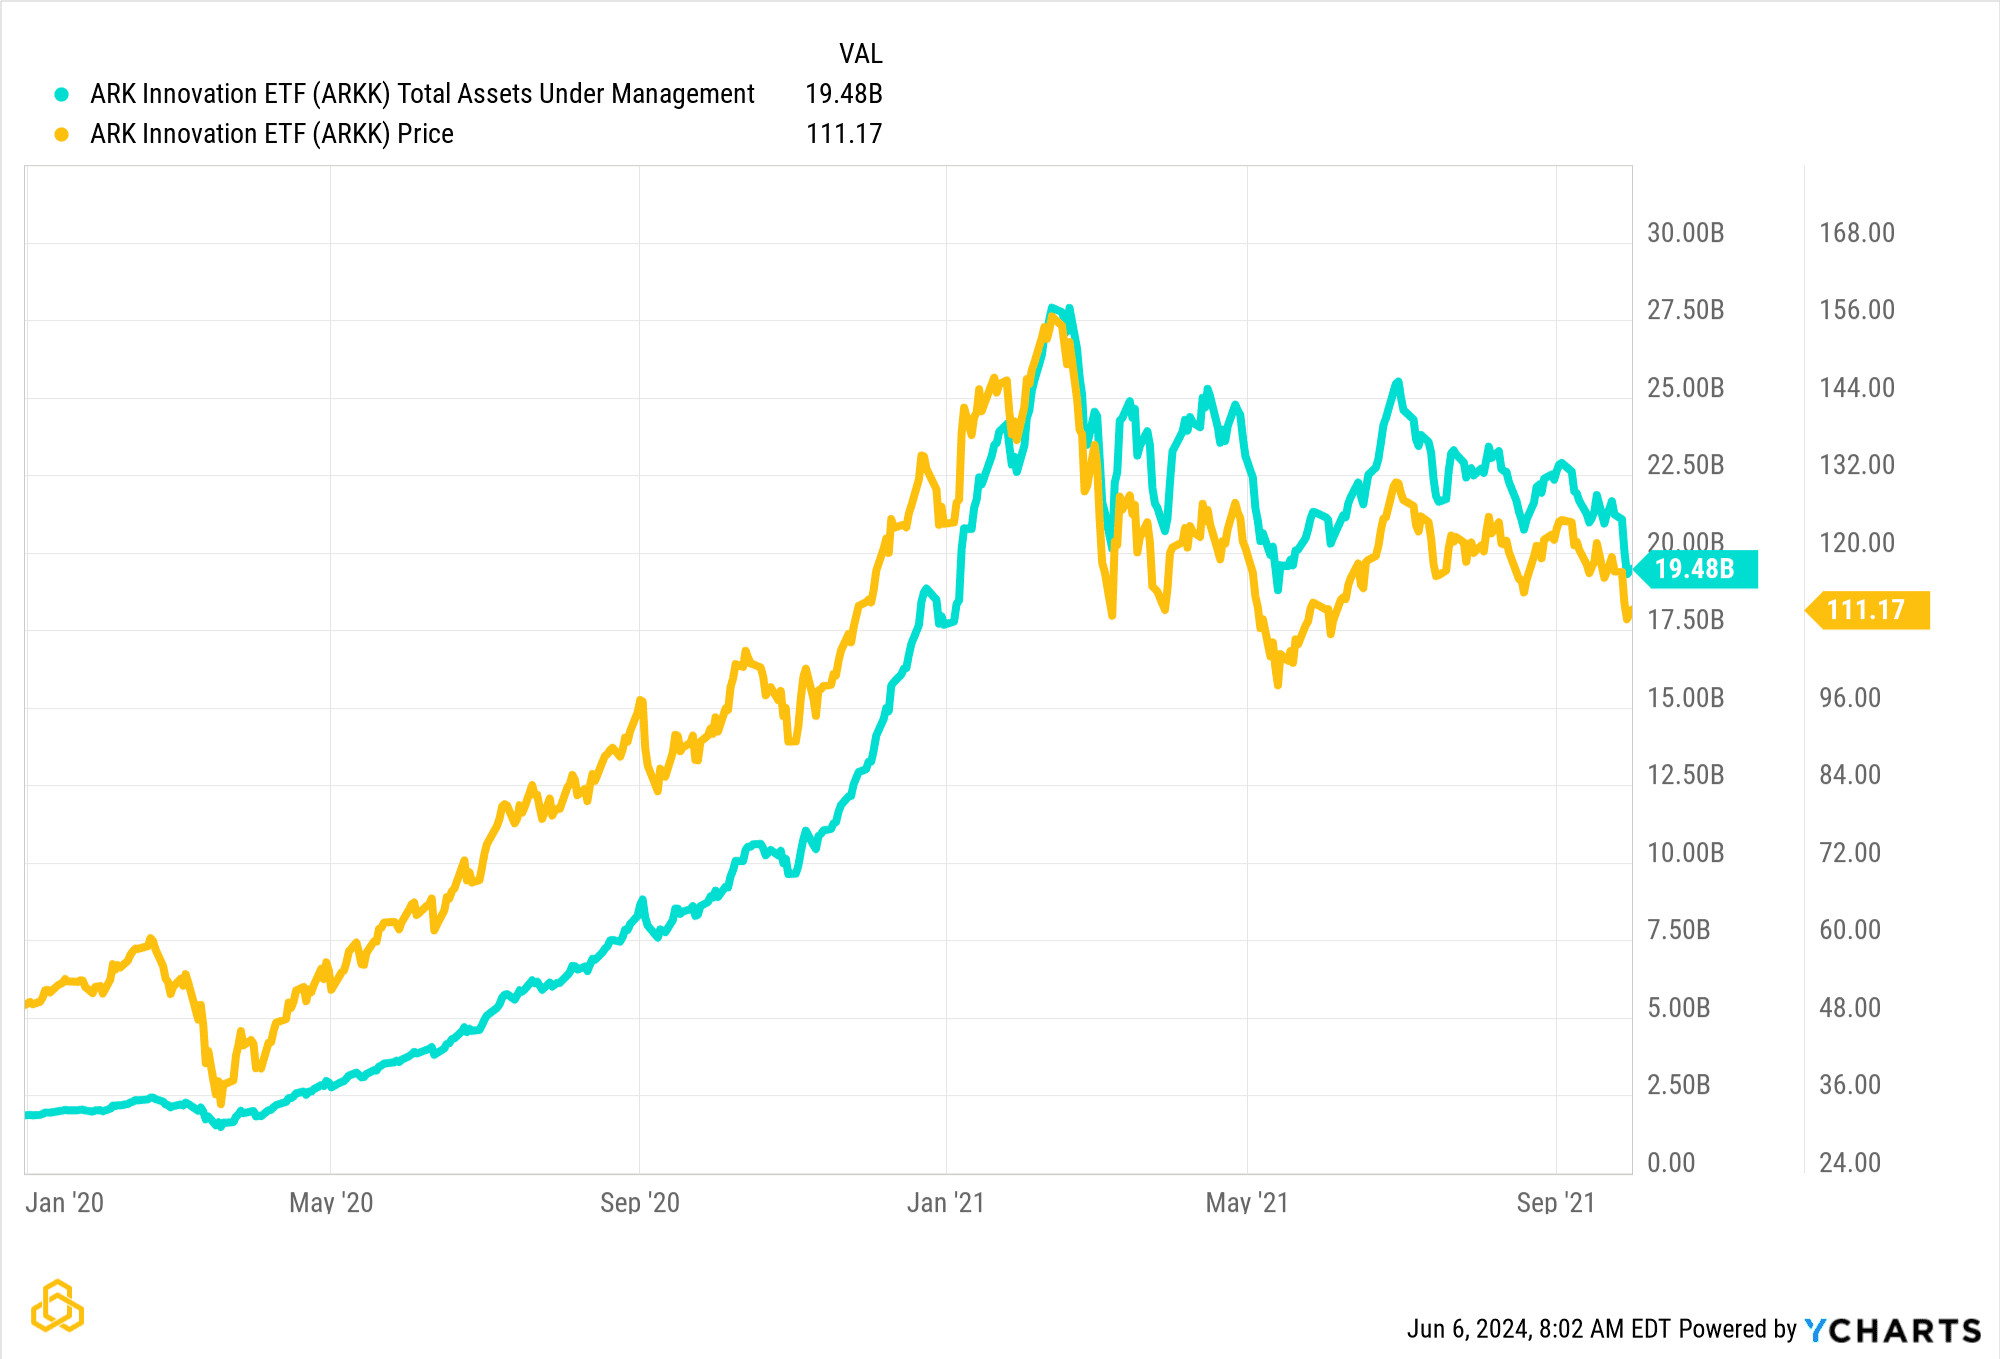
Throughout the stellar 2020 performance, investors added over $22 billion in assets to the fund.
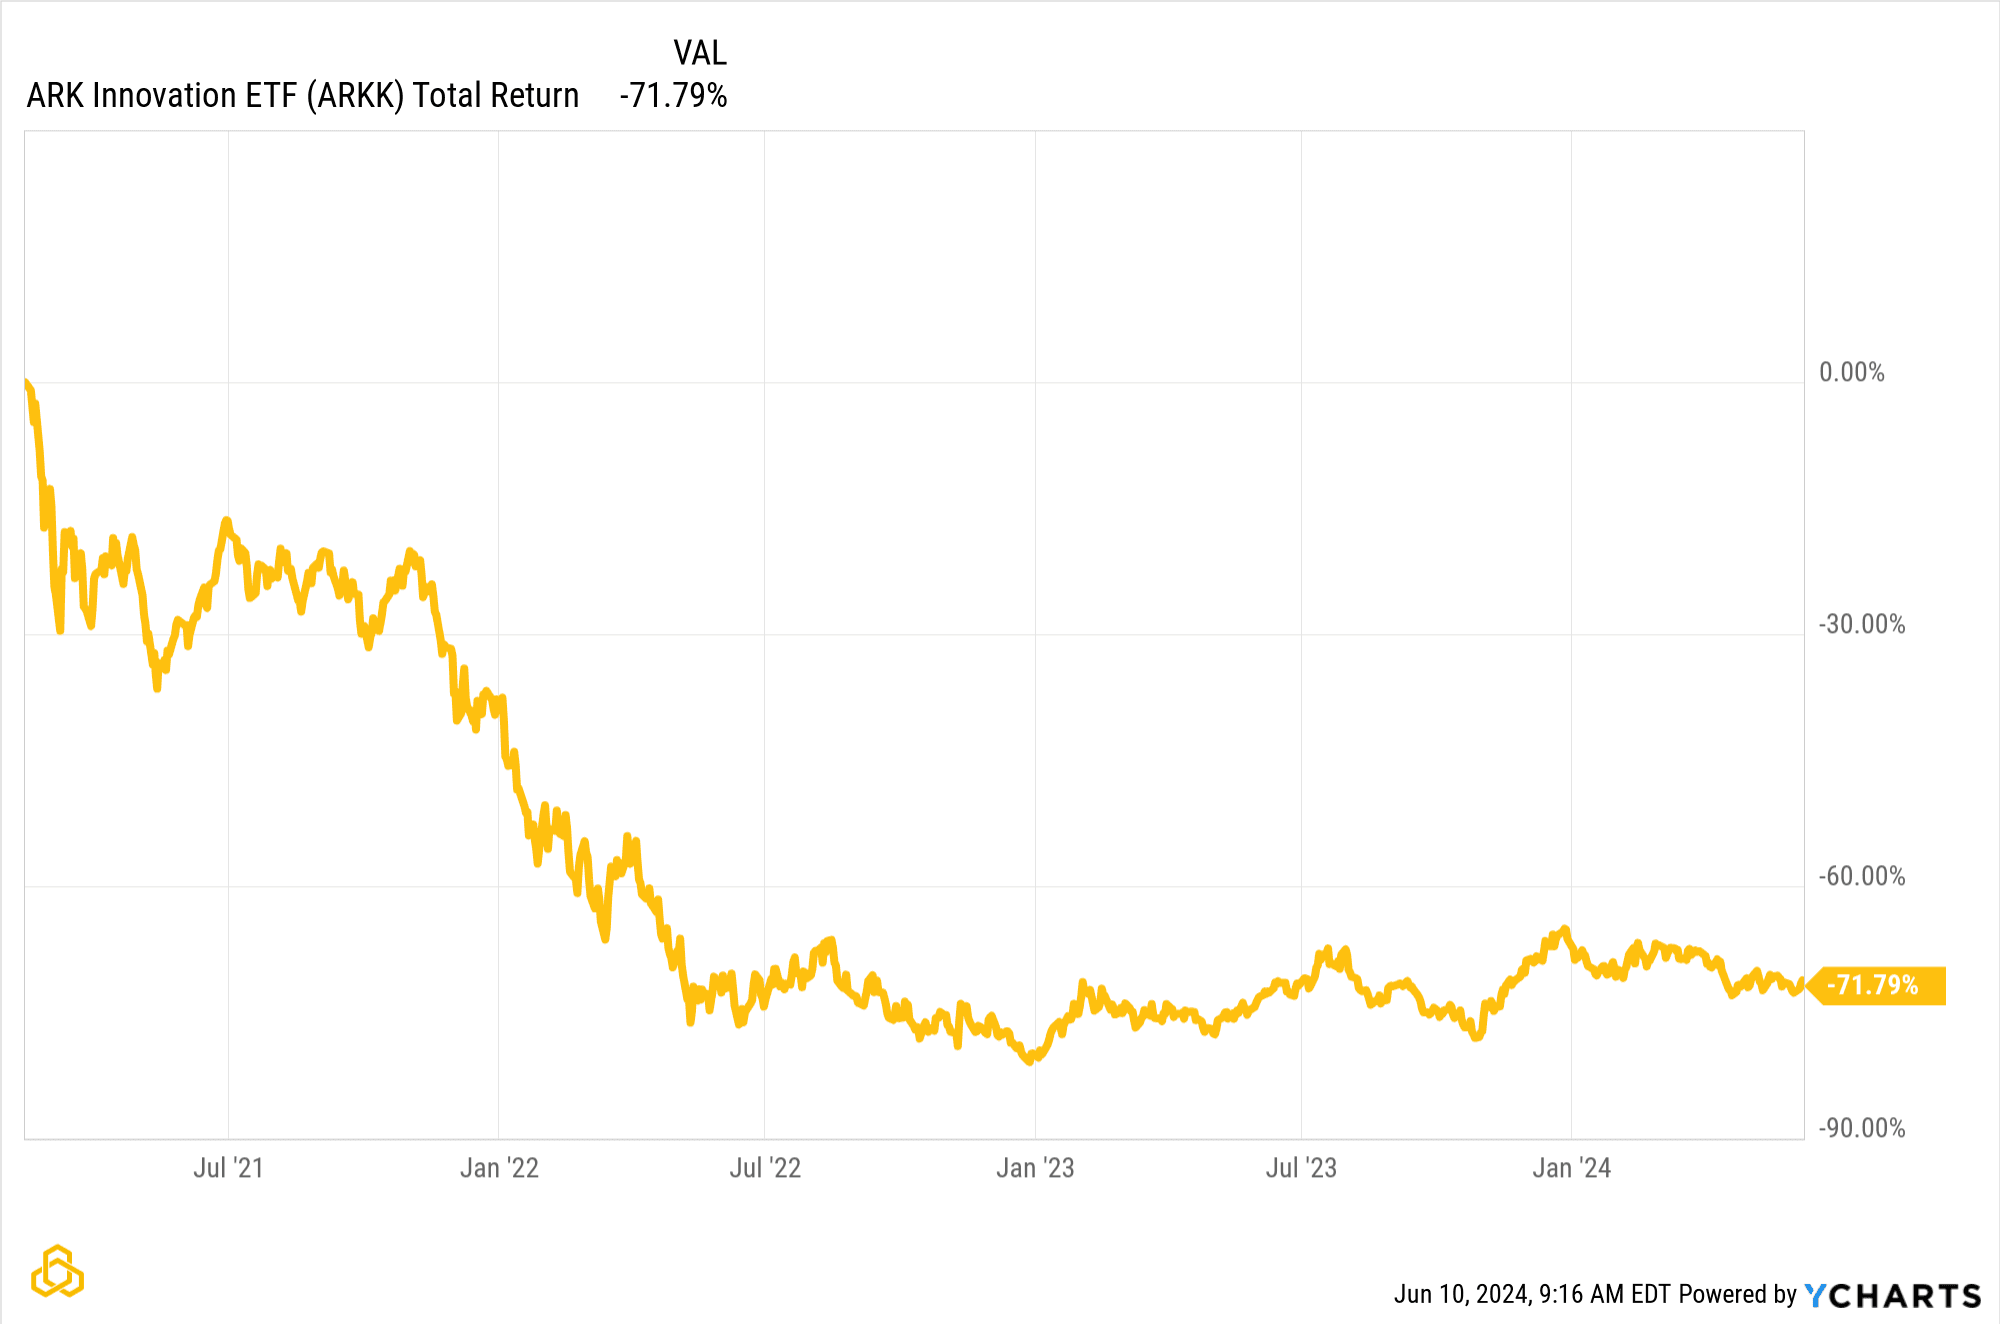
What followed? An 80% drawdown over the course of the next two years. The short-term performance drew investors in, resulting in a substantial drawdown that is still ongoing today.
60/40 Risk
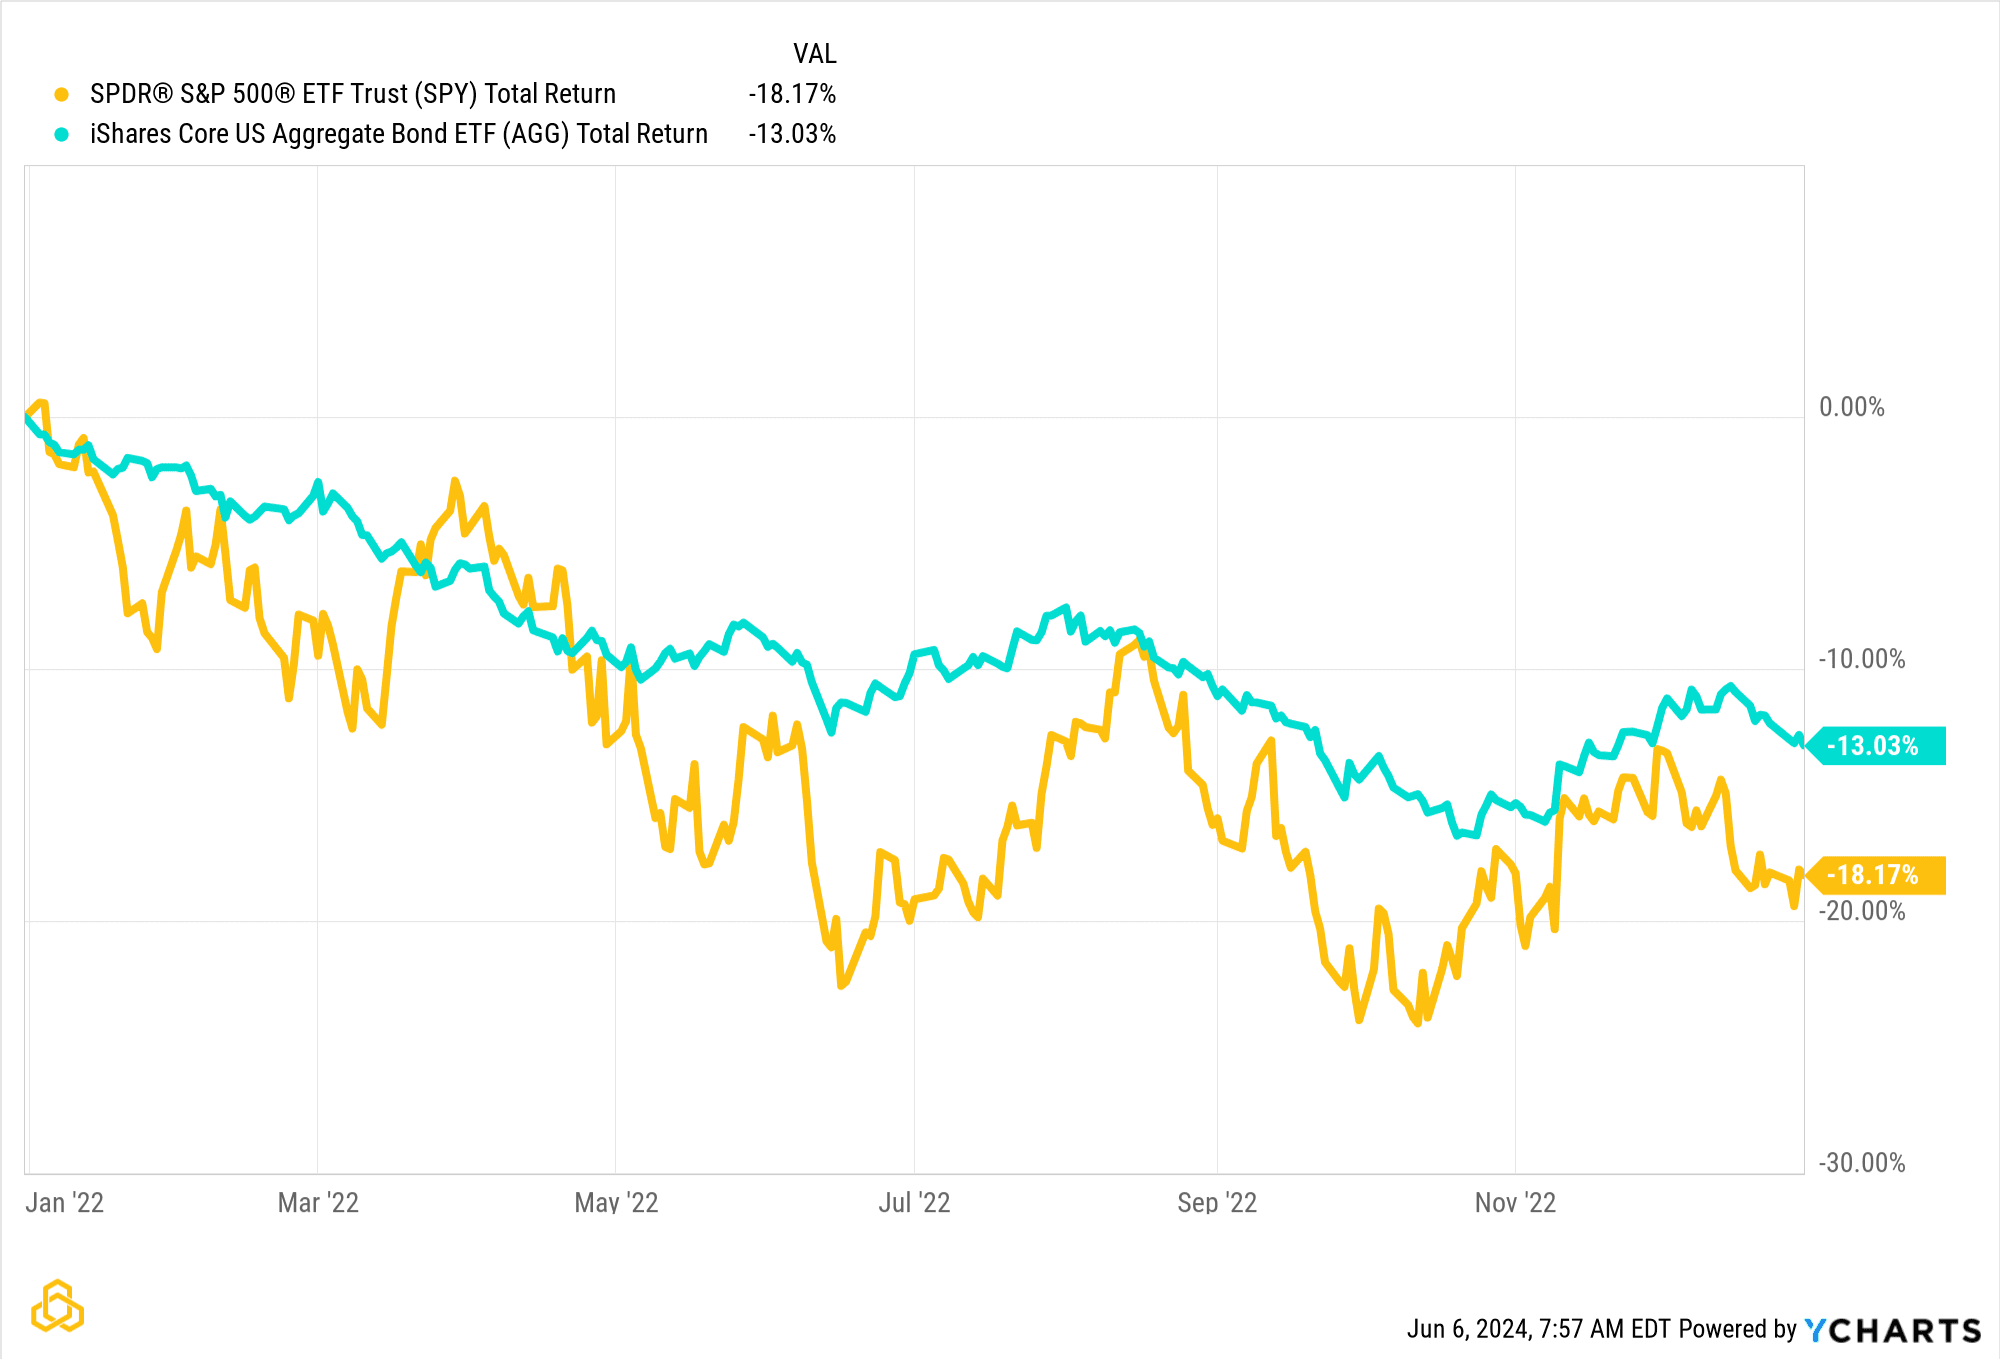
Another example of recency bias is with the 60% stock and 40% bond portfolio (60/40). From 2000 through 2021, investors in this allocation benefited from the negative correlation between stocks and bonds. However, this relationship changed in 2022 as they both declined together.
The following study aims to quantify recency bias, or "performance chasing" leading into 2022:
Evaluating the performance of a 60/40 portfolio using a three-year rate of change from 2000 to 2022 reveals that it ranked within the top 1% on January 1st, 2022.
Optimizing using modern portfolio theory likely would have suggested similar allocations, further adding to the recency bias.
What happened next? Both stocks and bonds declined together, and the 60/40 portfolio suffered.
The stock and bond decline in 2022 is shown below by the SPDR S&P 500 ETF Trust (SPY) in orange and the iShares 7-10 Year Treasury Bond ETF (IEF) in blue.
Final Thoughts
Academic methods such as modern portfolio theory rely on predicting forward return, volatility, and correlation of each asset in the portfolio. Correlations are ever-changing, and what was optimal in the past is not always likely to be optimal in the future.
Recency bias may skew investor decisions into performance chasing, and mean-variance optimization will reinforce that conclusion.
At Potomac, we understand that prediction comes with low accuracy. Objectively quantifying indicators on historical data is what we do.
Data for the study was from Norgate and computed internally via Excel as of 5/31/2024. The stock proxy was the S&P 500 Total Return Index ($SPXTR) and the bond proxy was the S&P US Treasury Bond 7-10 Year Total Return Index ($SPBDU10T).


