Key Takeaways:
Markets are more sensitive to major economic data when the Fed provides less explicit guidance about the policy path. CPI and employment reports have carried considerably more weight in both 2024 and 2026 than during Powell's more predictable 2018 hiking cycle, when the Fed provided more explicit forward guidance.
The increase in data sensitivity is not unique to Chair Warsh. Powell also shifted toward a more meeting-by-meeting, data-dependent approach by 2024, when rate expectations also moved sharply around CPI and payroll reports.
Less explicit forward guidance gives the Fed greater flexibility, but leaves markets with fewer guideposts. The August CPI report may be deemed cooler or hotter-than-expectations based on a few hundredths of a percent.
The Result of Less Forward Guidance
Fed Chair Warsh's desire to dismantle forward guidance has only intensified an obsession among investors. Every relevant incoming economic data point now commands extra attention and has the potential to materially shift rate hike expectations. The August jobs report serves as a prime example.
After beating expectations with 162,000 jobs added, the odds of a September rate hike moved from a virtual coin flip at 50/50 to 62%. That reaction makes sense. Investors viewed the report as another sign that the economy remains strong enough to handle a rate hike or two. But it was almost the exact opposite response to the prior month's report.
Following the July employment report, which showed the economy was shedding 23,000 jobs, investors lowered the odds of a September hike from just under 60% to below 50% and pushed the timing of a potential rate increase further into the year.
The difference? In July, local government education payrolls fell by about 58,000 before rebounding by 52,000 in August. Leisure and Hospitality employment fell by 43,000 in July and then bounced back by 62,000 in August.
Figure 1. Monthly Change in Nonfarm Payrolls During Summer 2026 (Thous.)

Sources: Bureau of Labor Statistics, Bloomberg L.P., and Potomac. Data as of August 2026. Note: June and July data are unrevised and reflect point-in-time estimates.
Was the economy really weak in July and then suddenly strong in August? Or were these simply seasonal anomalies rather than meaningful trends?
We suspect the latter. But when the Federal Reserve gives markets less guidance about the likely path of policy, investors are left to interpret each incoming data point on their own. It is not surprising, then, that major releases like the Consumer Price Index and U.S. Employment Report can create large swings in expectations for the Fed.
We can see the difference by looking at three different policy environments: former Fed Chair Jerome Powell's 2018 hiking cycle, Powell's 2024 easing cycle, and Chair Warsh's early tenure in 2026.
Using Bloomberg's World Interest Rate Probability, or WIRP, function, we tested how much expectations for the next Fed move changed on CPI and Employment Report days compared with normal trading days. The idea is that if investors have a relatively clear idea of what the Fed plans to do next, an individual economic report should have less influence on rate expectations. If the policy path is less explicit, incoming data matter more.
We chose 2018 as our starting point because it was a relatively conventional rate hiking cycle. The Fed was raising rates in 25 basis point increments while still providing markets with fairly explicit guidance about the likely direction of policy. The Fed itself identifies three changes to its forward guidance that year, and even after the September rate hike, the FOMC continued to say that it expected "further gradual increases" in the federal funds rate.
Figure 2. Forward Guidance about the Federal Funds Rate in 2018
January 31, 2018: The expression "gradual increases" is changed to "further gradual increases."
June 13, 2018: The FOMC drops the sentence indicating that the federal funds rate is "likely to remain, for some time, below levels that are expected to prevail in the longer run."
September 26, 2018: The FOMC drops a sentence indicating that "the stance of monetary policy remains accommodative," which had been in place since December 2015.
Sources: Federal Reserve Board - Timeline: Forward Guidance about the Federal Funds Rate and Potomac.
But by 2024, Powell had moved away from that type of explicit rate-path guidance.
At Jackson Hole in August, Powell said the direction of policy was clear, but emphasized that the timing and pace of rate cuts would depend on incoming data, the evolving outlook, and the balance of risks. In other words, investors knew rates were probably heading lower, but they had considerably less guidance about exactly when and how quickly the Fed would move.
That distinction shows clearly in the WIRP data. Under Powell in 2018, CPI and payroll releases changed the probability of the next Fed move by about 4.8 percentage points on average, compared with roughly 2.9 percentage points on normal trading days.
In 2024, when Powell was providing less explicit guidance about the timing and pace of future moves, the swings were considerably larger. CPI and payroll reports moved policy expectations by about 21.4 percentage points on average, compared with 8.6 points on normal trading days.
Under Warsh, those same releases have moved expectations by about 14.1 percentage points on average, compared with 5.7 points on normal days.
Figure 3. Average Absolute Change in Market-Based Odds of a Rate Cut or Hike (Percentage Pts.)

Sources: Bloomberg L.P., Bureau of Labor Statistics, Federal Reserve Board, and Potomac. Data as of September 8, 2026. Note 1: Data represent the average approximate absolute percentage-point change in target-meeting policy probability on CPI and Employment Situation release days versus normal trading days. Probability equivalents assume a 25-basis-point policy move. Changes are absolute and do not indicate direction. Note 2: The 2018 sample includes the Sept. 7, Oct. 5, Nov. 2 and Dec. 7 Employment Situation reports and the Sept. 13, Oct. 11 and Nov. 14 CPI reports. The 2024 sample includes the Sept. 6, Oct. 4, Nov. 1 and Dec. 6 Employment Situation reports and the Sept. 11, Oct. 10 and Nov. 13 CPI reports. The 2026 sample includes the June 5, July 2, Aug. 7 and Sept. 4 Employment Situation reports and the June 10, July 14 and Aug. 12 CPI reports.
The 2024 results are important because they suggest today's larger swings may not be exclusively a Warsh phenomenon.
Rate expectations also moved materially in 2024, after Powell had already moved away from the more explicit forward guidance used earlier in his tenure. In fact, CPI and employment reports produced even larger absolute shifts in policy expectations in 2024 than they have so far under Warsh. The relative importance of those reports was also remarkably similar. CPI and payroll days generated about 2.5 times the normal daily movement in Fed pricing in 2024, roughly the same as today.
That points to a broader explanation. When policymakers provide a fairly well-defined path, as they did during much of 2018, an individual CPI or payroll report has less work to do. Investors already have a pretty good idea of where policy is headed.
When the Fed provides fewer guideposts about the timing and pace of the next move, as Powell increasingly did in 2024 and Warsh is doing today, the market has to do more of that work itself. Every major inflation or employment report becomes another opportunity to reassess the Fed's reaction function.
That does not mean forward guidance is the only thing driving the difference. The economic backdrop, the level of rates, the proximity of the next Fed meeting, and the amount of uncertainty already priced into markets all matter. Our sample is also admittedly small.
Still, the contrast with 2018 is noticeable. Less explicit forward guidance appears to come with a tradeoff. It gives policymakers more flexibility, but it can also leave financial markets more sensitive to each new piece of economic information.
We suspect the August CPI report due out this Friday, September 11, will be no different. Market participants are likely to view it as the final major piece of the Fed puzzle before the September 16 FOMC meeting.
Currently, consensus estimates call for headline inflation to remain unchanged at 3.4% year-over-year and rise 0.4% month-over-month. Core inflation is expected to come in around 2.4%.
At Potomac, we don't typically do economic forecasts, but we think the prior week's ISM business surveys may provide a useful signal. Expectations were for input prices among both manufacturing and services companies to decline somewhat in August. Instead, services prices ticked higher while manufacturing prices were unchanged.
Figure 4. ISM Weighted Prices Paid Index vs. Inflation
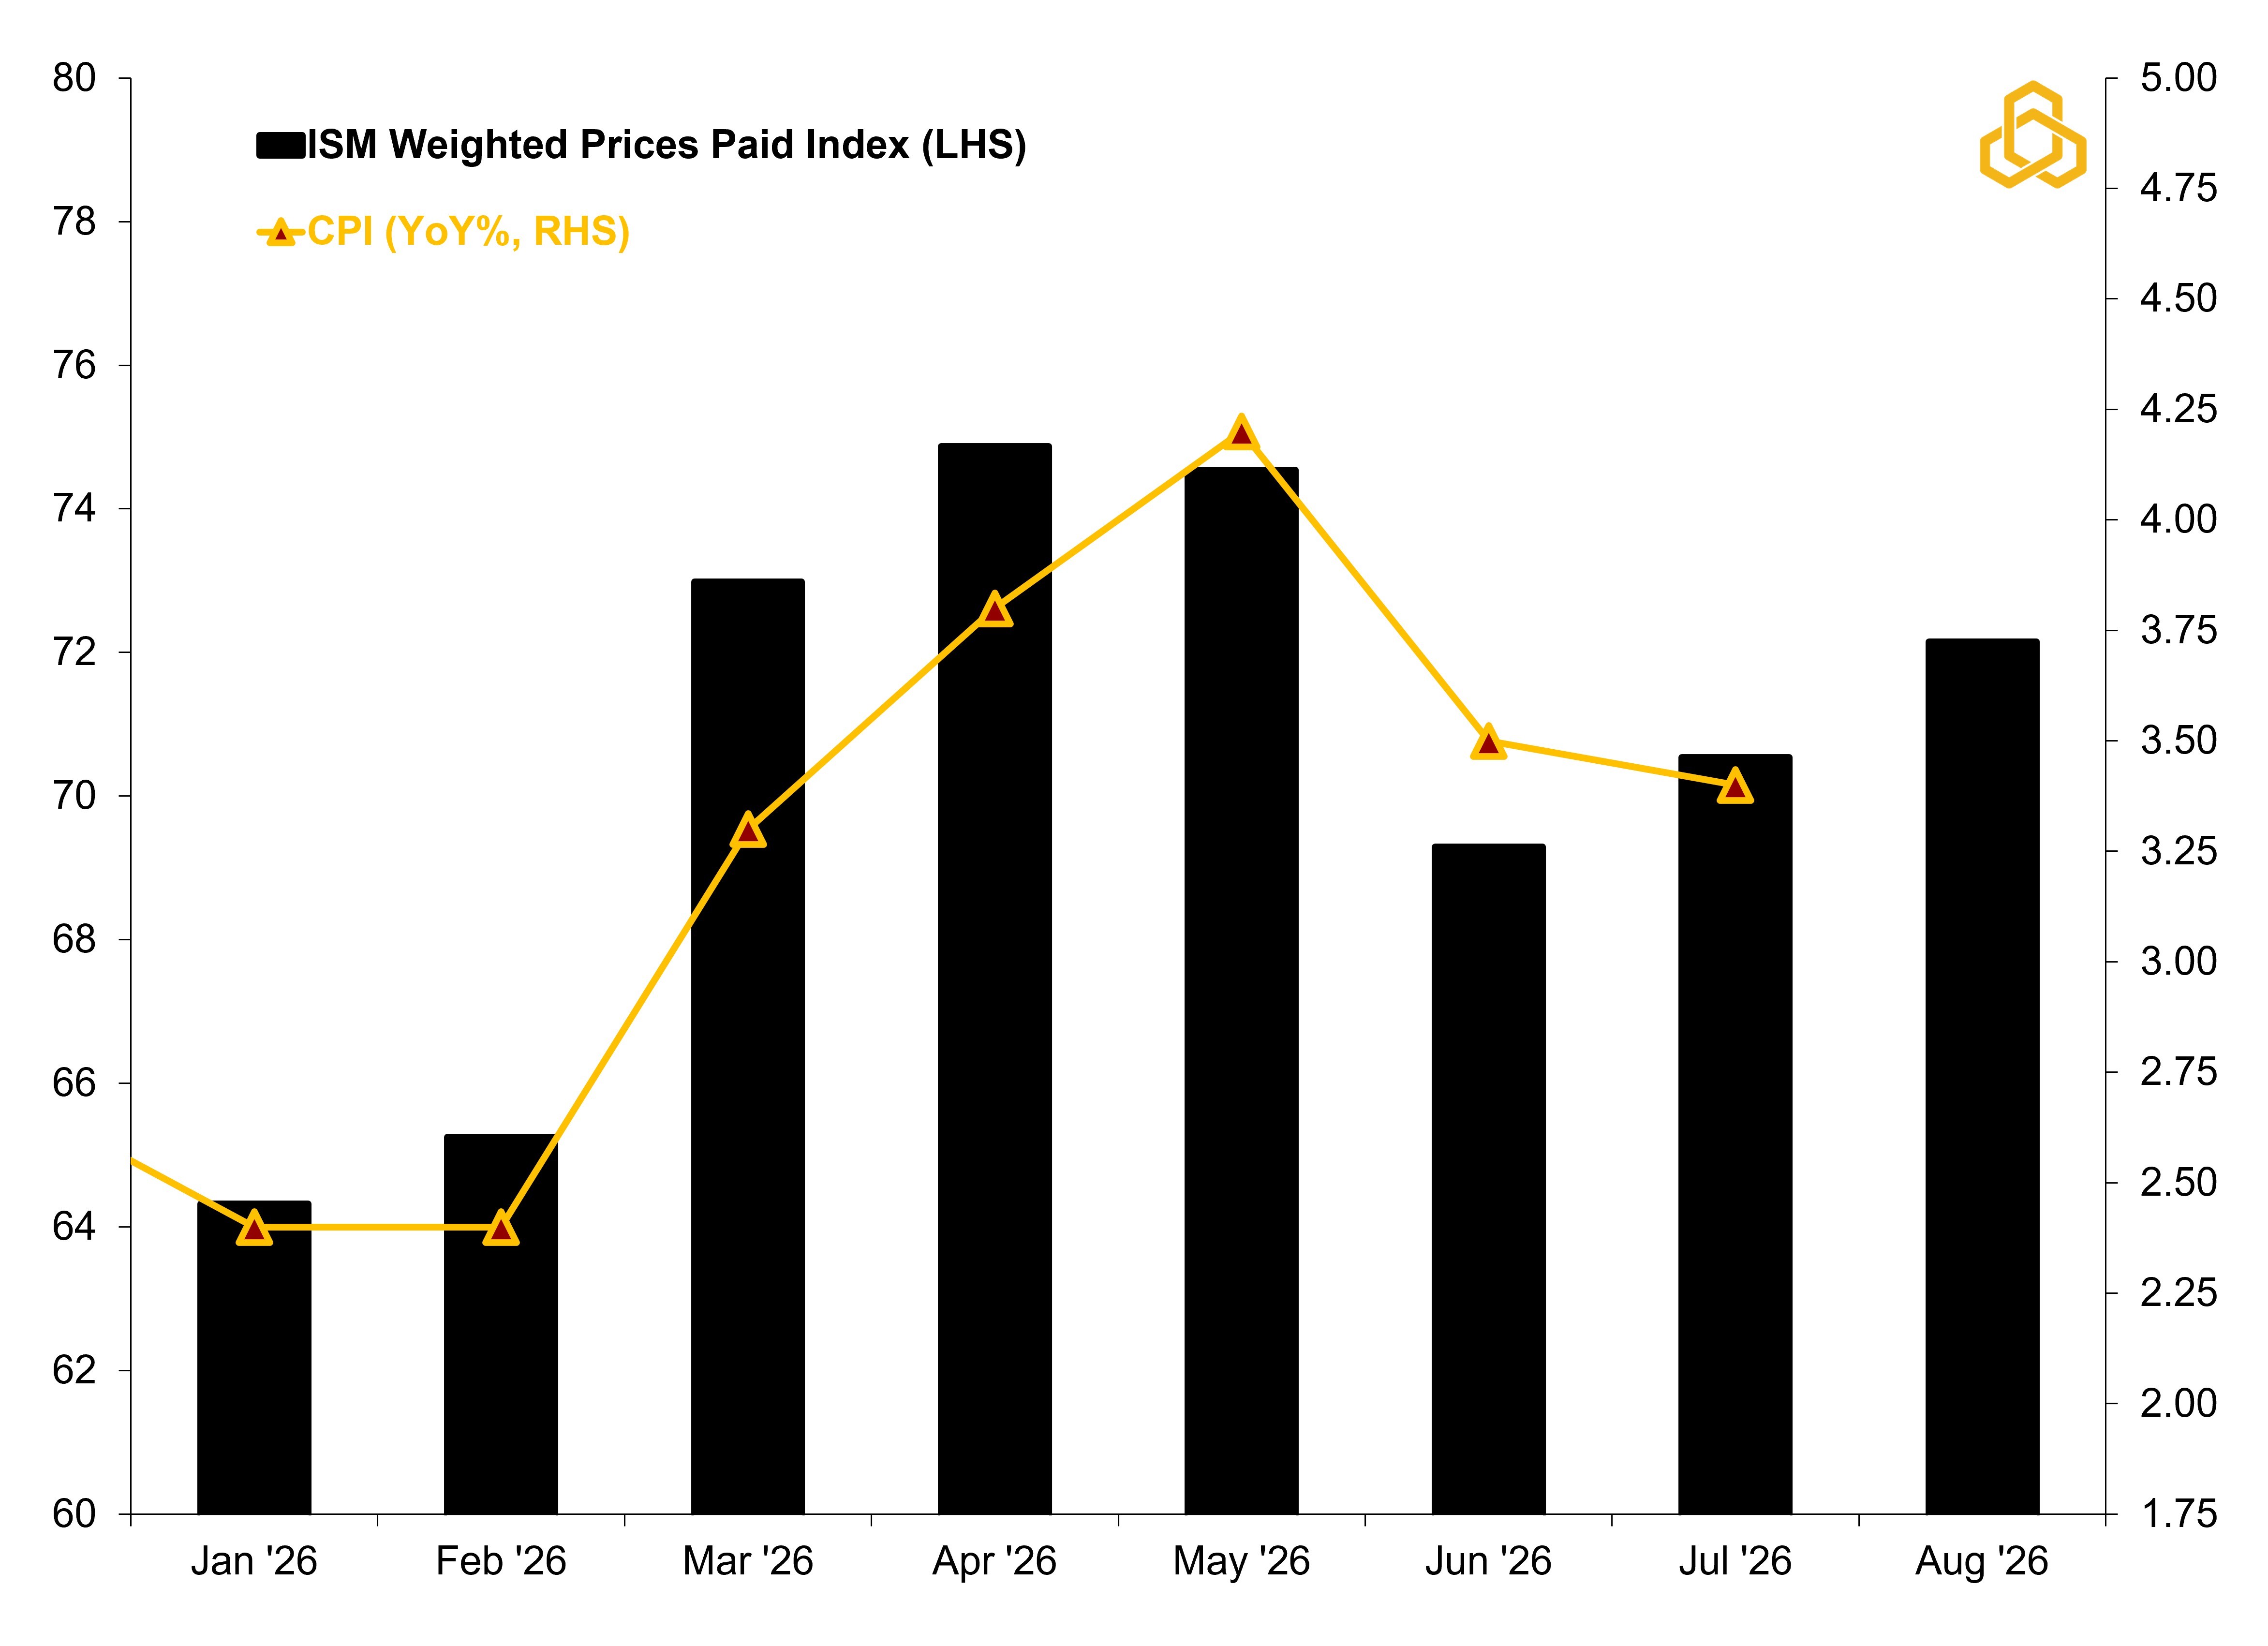
Sources: Institute for Supply Management, Bureau of Labor Statistics, Bloomberg L.P., and Potomac. Data as of August 2026 for ISM; July for CPI. Note: The ISM weighted prices paid index is 70% services and 30% manufacturing.
Separately, Potomac's own internal inflation pressures model, which uses the ISM data as an input, is predicting a month-on-month print of 0.35% for headline CPI and 3.35% for year-on-year. Notice the decimal points here.
When rounded up, the forecast matches the market consensus, but just a few hundredths lower and the estimates round to 0.3% and 3.3%, respectively. Were that to be the case, the market may see it as coming in below expectations, even though it should probably be viewed as more of a stalling out after a couple months of improvement as oil prices push upward once again.
Conclusion
None of this guarantees an upside surprise in Friday's CPI report, but it does suggest that inflation pressures have not disappeared as quickly as investors might like. And in the current Fed environment, that distinction matters for investors as bond yields become increasingly sensitive to the macro backdrop.
A few tenths in either direction could meaningfully change the market's expectations for September and the meetings that follow. That appears to be one of the tradeoffs that comes with less explicit forward guidance. The Fed gains policy flexibility, but markets are left with fewer guideposts and every major economic release carries more weight.
The experience of both 2024 and 2026 suggests that this sensitivity is not unique to Chair Warsh. Instead, it may be a broader feature of a Fed that prefers to keep its options open and allow incoming data to determine the path ahead.
For investors, that means the obsession with the data probably isn't going away anytime soon unless the Fed's reaction function becomes clearer.
Weekly “Keeping it Strait” Highlights:
The U.S. – Iran stalemate continues with discussions of exacting economic force on Iran through sanctions and Iran targeting U.S. assets, which has caused oil prices to head toward $100 a barrel again. Gas prices have also perked back up.
The U.S. economy added 162,000 jobs in August, unwinding much of the losses of the prior month. As a result, rate hike expectations have picked back up again, but traders are waiting for the August inflation print and the FOMC meeting for more clarity. Ironically, with oil trending higher, the August print may already be somewhat stale.


