
A peace deal between the United States and Iran is in the works with details being ironed out at a Burgenstock resort in Switzerland and oil tankers are openly entering the Strait of Hormuz. Oil prices are down some 22% since June 11th as geopolitical tensions are easing, but the stock market has been trading sideways (see figure 1). Why?
Figure 1. S&P 500 vs. West Texas Intermediate Crude Oil Price ($/BBL)

Sources: Standard & Poor’s, Department of Energy, Bloomberg L.P., and Potomac. Data as of June 23, 2026. An investor cannot directly invest in an index. Past performance is not a guarantee of future results.
At first glance, the market appears to have escaped the economic consequences of the conflict. Investors quickly looked beyond the disruption in the Strait of Hormuz and focused on the prospect of a diplomatic resolution. Yet while geopolitical risk premiums have faded, the economic consequences of the conflict may be arriving with a lag.
When ships pass through major waterways, they often pay a toll for the privilege. Markets work in a similar way. While investors largely avoided a deep equity selloff, they may only now be paying the toll through higher inflation, higher real yields, and a more hawkish Federal Reserve.
We think a key reason for this is the sharp pivot in Fed expectations. In 2022, the Fed's unexpected tightening cycle triggered a persistent and rapid rise in the 10-year real Treasury yield (adjusted for inflation), which appears to have been a major driver of the roughly 41% decline in the Magnificent 7 (Apple, Microsoft, Nvidia, Alphabet, Amazon, Meta Platforms, and Tesla, see figure 2).
Figure 2. Bloomberg Mag-7 Price Index vs. the 10-Year U.S. Treasury Real Yield

Sources: Bloomberg L.P., U.S. Department of Treasury, and Potomac. Data as of June 23, 2026. An investor cannot directly invest in an index. Past performance is not a guarantee of future results.
The reason is straightforward. Technology stocks are long-duration assets, meaning that a large share of their expected earnings lies far in the future. When real yields rise, the discount rate used to value those future cash flows increases, mechanically reducing their present value. Higher real yields also make risk-free alternatives more attractive relative to equities. For example, a 2-year Treasury yielding 4.2% becomes a much more compelling competitor for investor capital.
Higher real yields can also affect the economics of the AI investment cycle itself. As the risk-free rate rises, investors may demand higher returns on the hundreds of billions of dollars being invested in data centers, semiconductors, and related infrastructure. This raises the hurdle rate for capital spending and may lead investors to scrutinize the return on those investments more closely. Though a far cry from 2022, there are some tentative signs of this happening again with tech-stock volatility surging relative to the broader market (see figures 3-4).
Figure 3. Tech Volatility Relative to the S&P 500 vs. 10-Year Real Yield

Sources: Chicago Board of Exchange, Bloomberg L.P., U.S. Department of Treasury, and Potomac. Data as of June 23, 2026. Note: The VXN relative to VIX metric has been rebased so that January 1, 2021 = 100.
Figure 4. Tech Volatility Relative to S&P 500 Volatility (2021 – June 21, 2026)
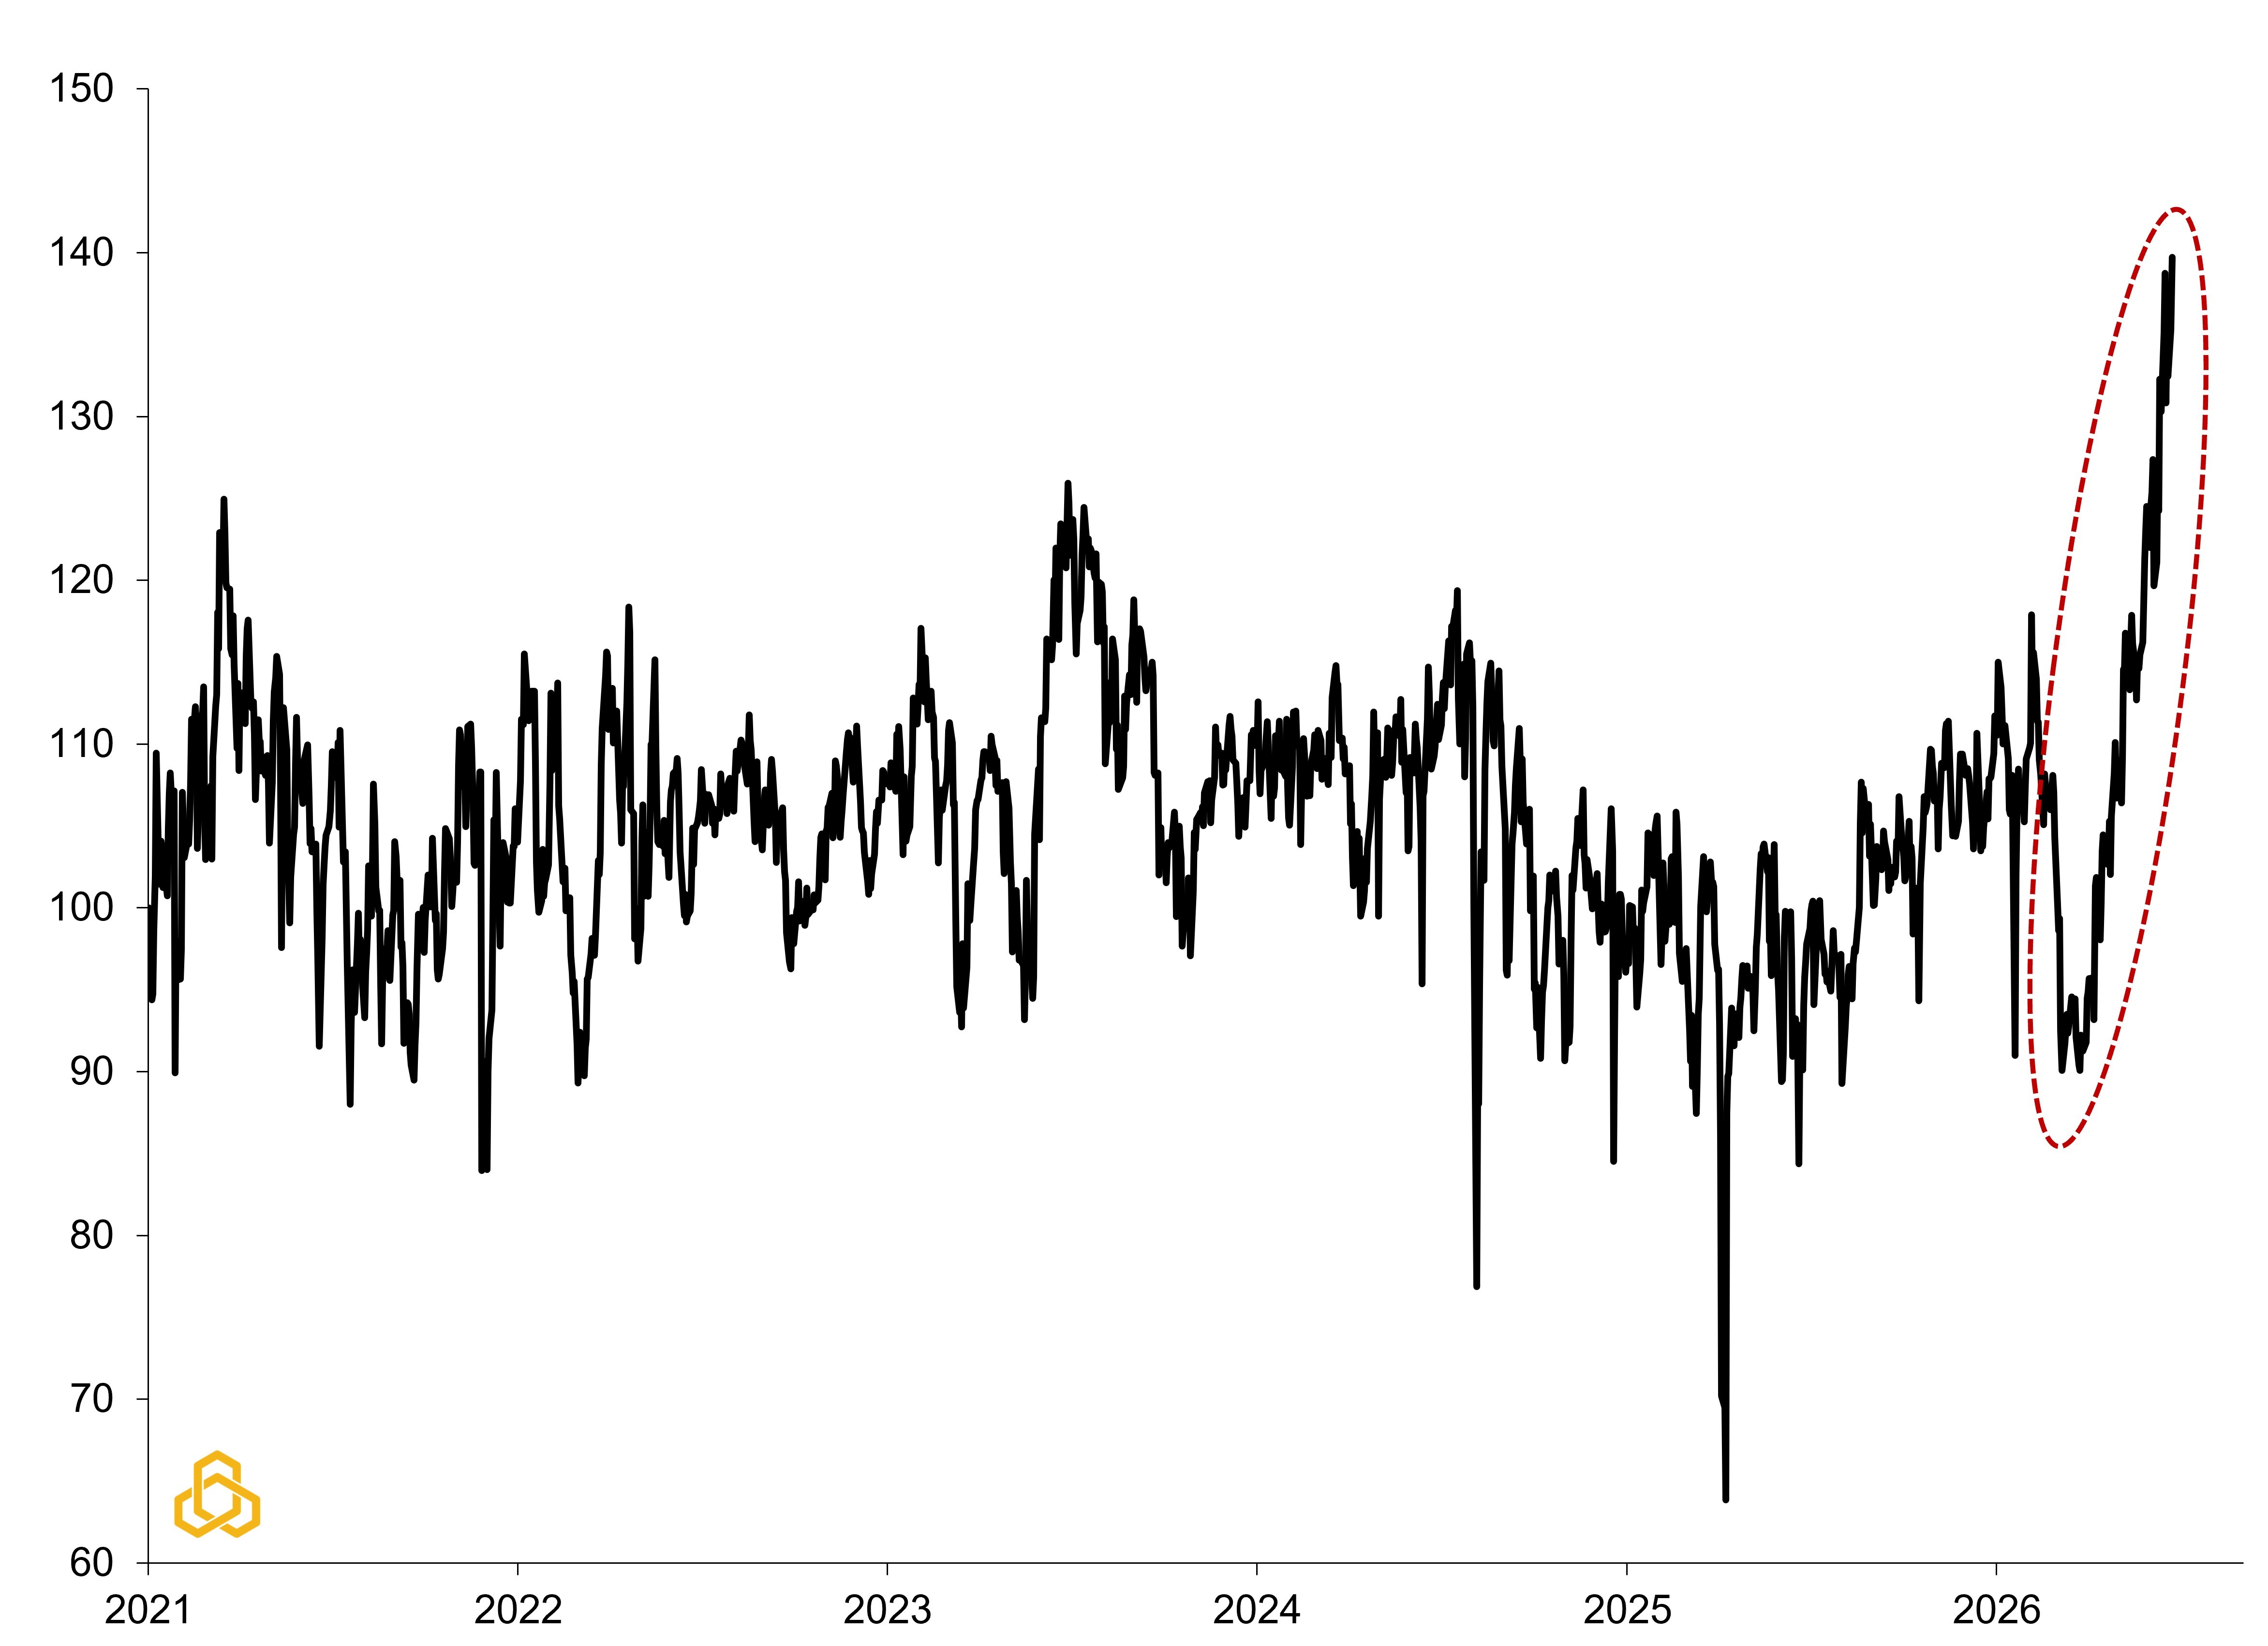
Sources: Chicago Board of Exchange, Bloomberg L.P., U.S. Department of Treasury, and Potomac. Data as of June 23, 2026. Note: The VXN relative to VIX metric has been rebased so that January 1, 2021 = 100.
While the recent rise in real yields creates a headwind for technology stocks, we do not believe that the recent selloff is likely to mirror the magnitude of the 2022 decline. During that period, the Federal Reserve embarked on one of the most aggressive tightening cycles in decades, pushing real yields sharply higher for nearly a year, and weighing heavily on equity valuations. Today, earnings growth remains considerably stronger, AI-related investment continues to support revenue expectations, and the market is pricing a far more gradual path for additional tightening. As a result, the current environment appears more consistent with a valuation adjustment than a repeat of the 2022 technology bear market.
Looking forward, it will be interesting to see if the pickup in volatility proves to be lasting because of less guidance from the Fed and if economic data releases come under even more scrutiny as a result. The first two weeks of July could prove a key test with manufacturing input prices being released on July 1st, employment data released on July 2nd, and the June consumer price index coming out on July 14th. If any of these metrics suggest a peak in headline inflation, the upward pressure on yields and downward pressure on technology stocks could ease. Until then, investors may wish to take this opportunity to re-allocate to less correlated assets with both stocks and bonds increasingly moving together (see figure 5).
Figure 5. Rolling Stock / Bond Correlation vs. U.S. Inflation
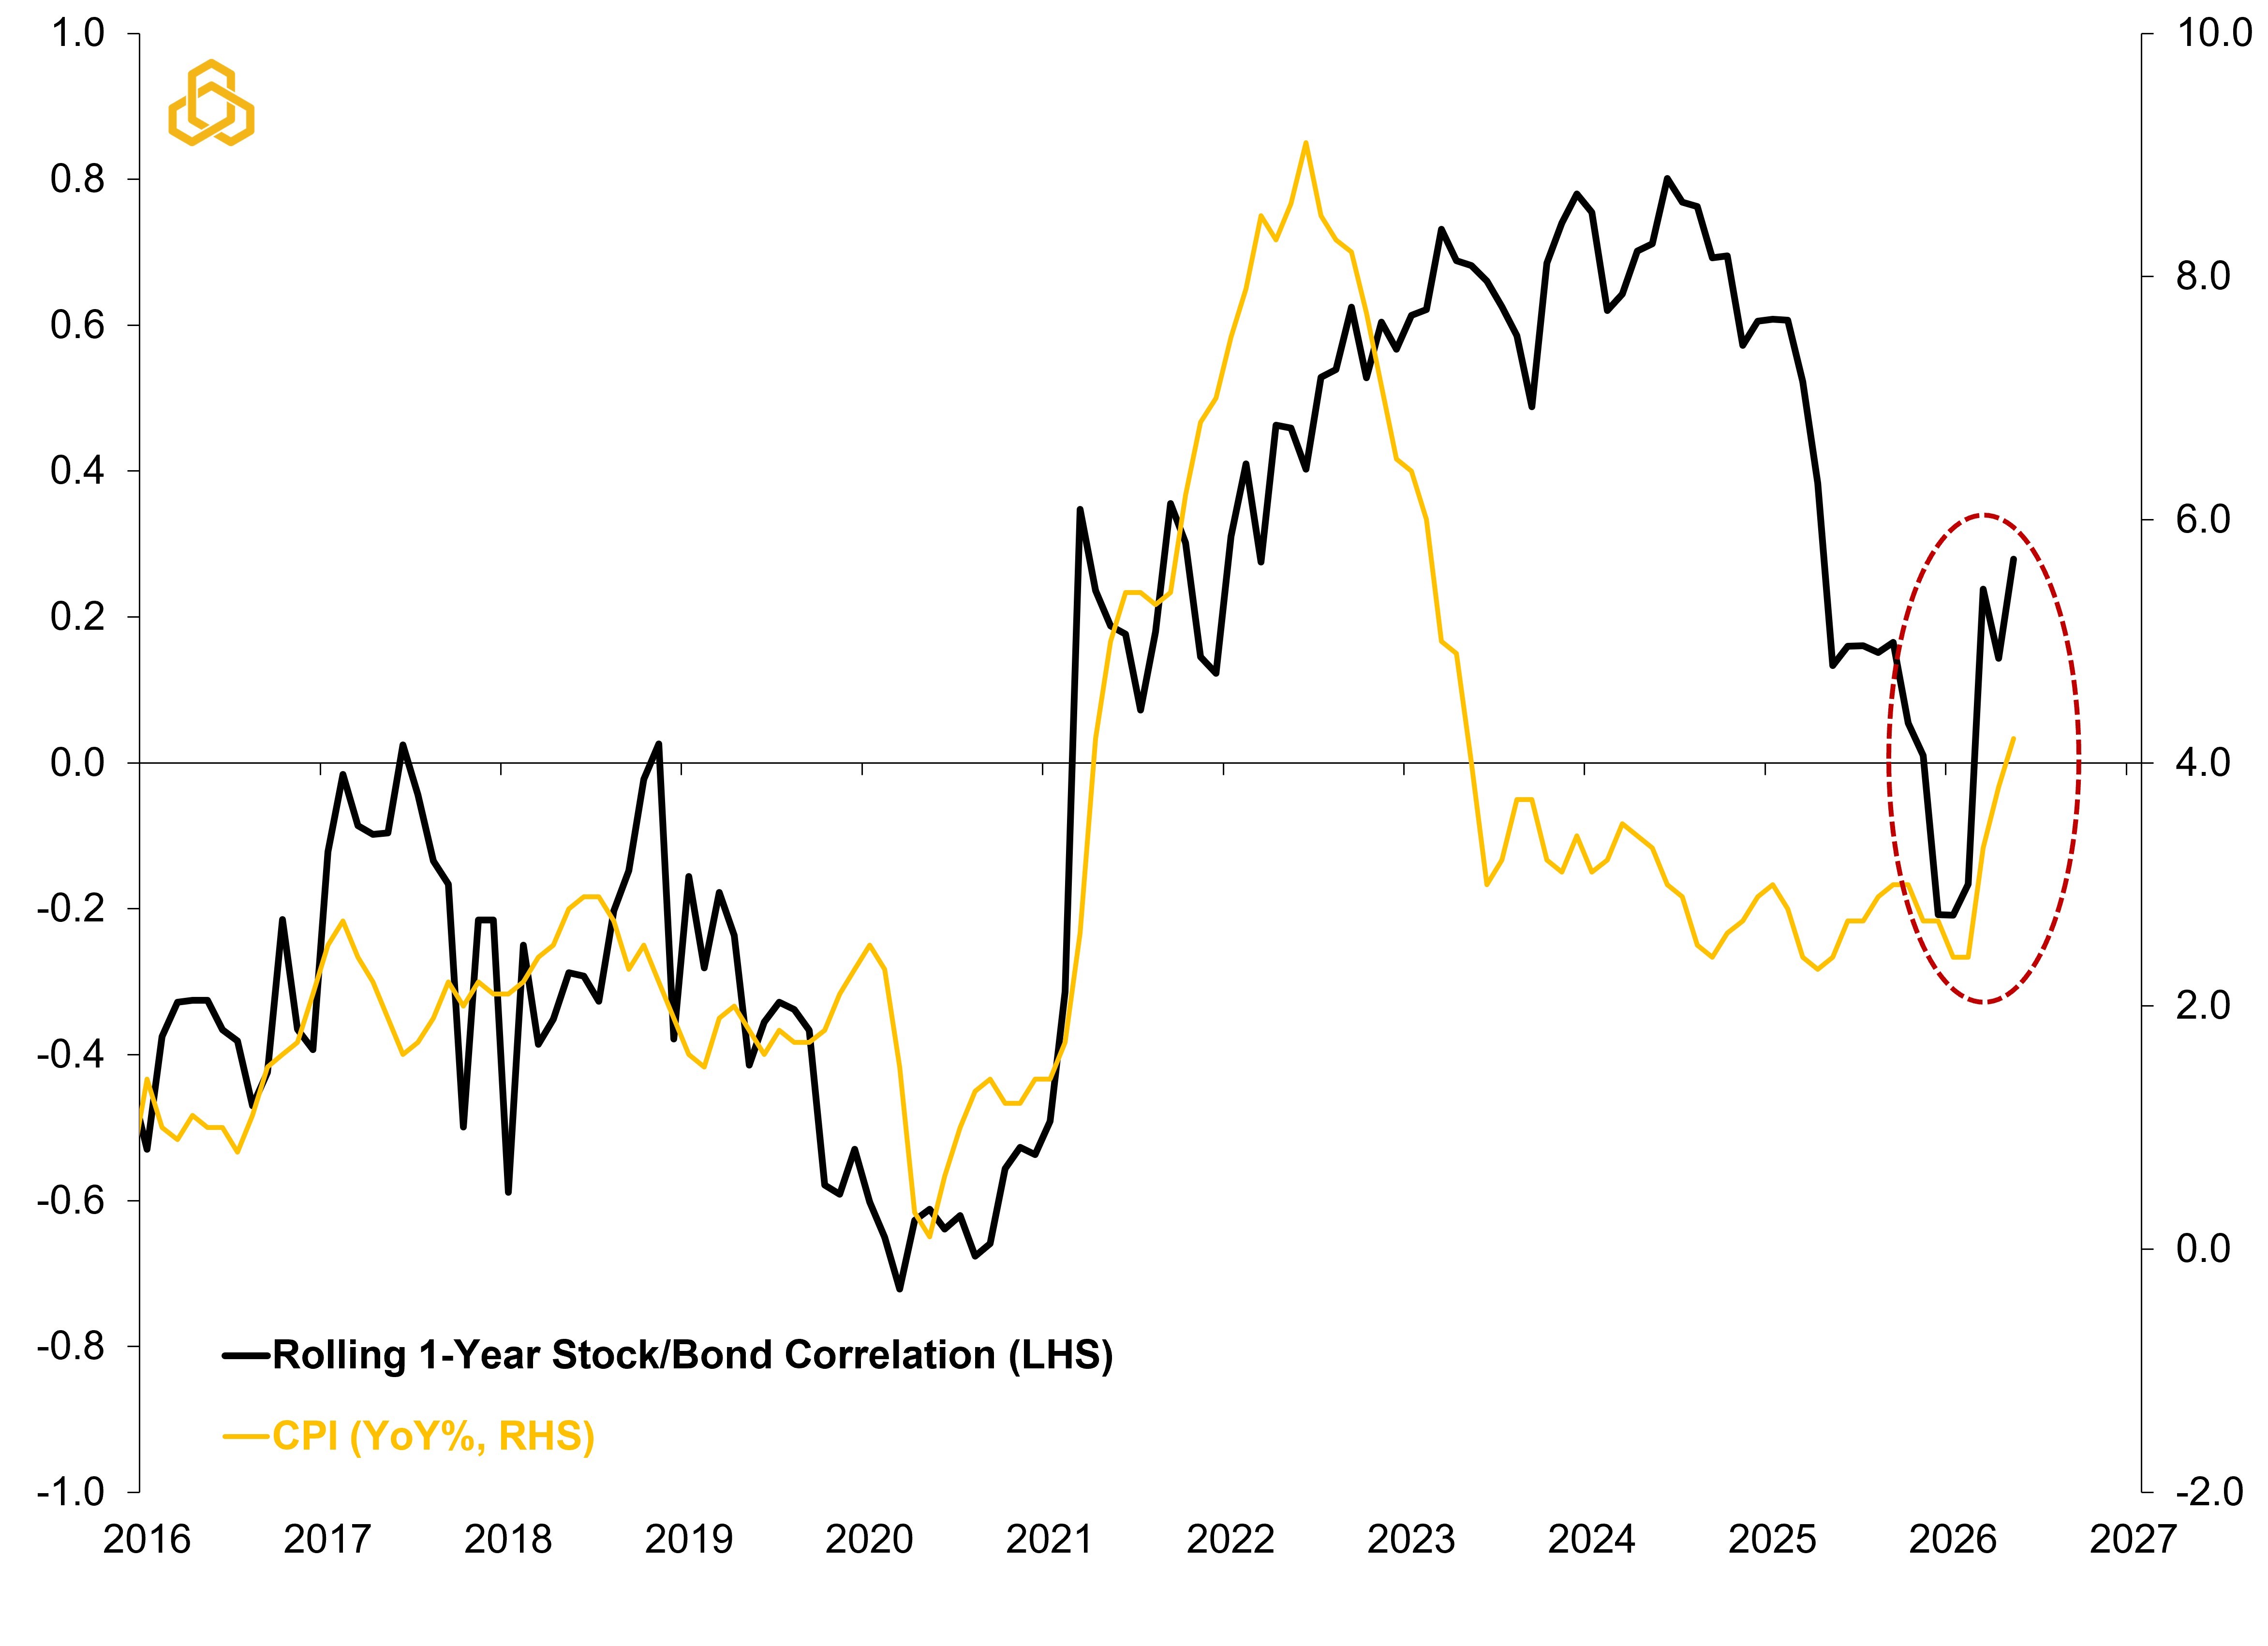
Sources: Standard & Poor’s, U.S. Department of Treasury, Bureau of Labor Statistics, Bloomberg L.P. and Potomac. Data as of June 23, 2026.
Investors may have assumed that avoiding a prolonged disruption in the Strait of Hormuz meant avoiding the economic costs of the conflict altogether. Yet markets often settle their bills with a delay. While oil prices have retraced and geopolitical risk premiums have faded, inflation pressures appear to have lingered long enough to alter the Fed's reaction function. In that sense, the market may still be paying the toll, not through higher oil prices, but through higher real yields and a more challenging environment for long-duration assets. Whether that toll proves temporary or more lasting will depend largely on whether inflation begins to ease in the weeks ahead.
Weekly “Keeping it Strait” Highlights:
· Oil tanker traffic has returned to the Strait of Hormuz, though it remains below pre-war levels. As a result, risk premium is fading from oil quickly with oil prices down from around $90 a barrel last week to $70 a barrel this week. This is good news as it should help to alleviate headline inflation pressures over time.
· Precious metal prices fell during the week with both gold and silver retracing. Gold is now trading below $4,000 as the U.S. dollar strengthened and U.S. Treasury yields climbed on the back of a more hawkish tone from the Fed.
· Surprisingly, the Dow Transports fell last week. While counterintuitive, several shipping stocks were dragged lower as the Strait of Hormuz reopened as it could signal lower revenues for those benefiting from higher shipping rates.


