Media pundits and headlines remain fixated on the daily swings in oil prices and bond yields, but what are the forward-looking economic indicators actually telling us? There is some science to it, with surveys and real-world decisions underlying the data, but reading the economic tea leaves also involves a bit of artistic license, where gut feelings can sometimes creep into the mix. We will try to avoid that and focus on the data.
So, what are the tea leaves suggesting in our admittedly somewhat subjective opinion?
Persistent inflation with persistent growth. For now.
Persistent Inflation
In terms of inflation, the Institute for Supply Management’s (ISM) manufacturing and services surveys each reported input prices rising further in September. Manufacturing prices paid jumped from 71.1 in August to 77.9 in September, while the services prices paid component ticked up from 72.6 to 74.0 over the same timeframe.
Combined, the sentiment data point to a modest reversal in the recent improvement in inflation pressures. At the very least, the data are not consistent with the sustained decline the Federal Reserve is hoping to see.
Figure 1. Input Prices Picked Up in September
ISM Weighted Prices Paid Index vs. the Consumer Price Index

Sources: Institute for Supply Management, Bureau of Labor Statistics, Bloomberg L.P., and Potomac. Data as of September 2026. Note 1: An ISM reading above 50 is thought to be consistent with rising prices while below implies falling. Note 2: The ISM prices paid composite is 30% manufacturing and 70% services. Note 3: Shaded regions denote periods of U.S. recession.
That sentiment was also reflected in the survey comments, with one agricultural service provider stating, “The high cost of diesel fuel has increased the cost of freight dramatically,” while another in retail trade commented that, “Shipping containers from overseas are double the cost, causing price increases.”
Real people, real data.
Investors, though, often care less about sentiment data (or “soft” data) and more about “hard” data like the actual Consumer Price Index (CPI) inflation report. That report also showed inflation backing up with headline inflation rising from 3.4% in August to 3.7% in September. Core inflation, which excludes food and energy, climbed from 2.4% to 2.6%. Most signs, however, still point to the Federal Reserve waiting until December to raise rates again.
There is some positive news, however. Saudi Arabian oil exports have recovered sharply, with the nation now exporting 6.1 million barrels per day compared with just 3.4 million barrels per day in August. By using the East-West Pipeline, Saudi Arabia has been able to bypass the Strait of Hormuz for some of its exports. The country has also been ramping up shipments through the Strait, albeit at high transportation and insurance costs. Figure 2. Saudi Oil Exports Have Rebounded
Saudi Arabia Oil Exports (Thousands of Barrels Per Day)

Sources: Bloomberg L.P., and Potomac. Data as of September 2026.
This is certainly a welcome development and may be one of the reasons the futures market has dialed back its Fed rate hike expectations for this tightening cycle from four hikes to just three hikes currently. Though it should be noted that these expectations can change quickly, and the improvement in shipments can be quickly offset if energy infrastructure falls under attack again.
This leaves us hopeful, but the data still seem to suggest that inflation is likely to remain sticky for some time.
Persistent Growth
On the growth front, the economy remains on solid footing despite several headwinds. Looking at the ISM surveys once again, both sides of the economy – manufacturing and services – are in expansion territory, with readings of 54.5 and 54.9, respectively.
As a reminder, an ISM reading above 50 is thought to be consistent with a sector that is expanding, while below 50 is thought to be consistent with contraction.
Separately, the new-orders components of both surveys also remain positive. This matters because orders eventually turn into production or services rendered, which in turn become measured economic activity. For this reason, the new-orders component of the ISM manufacturing index is officially recognized as a leading economic indicator. Currently, new orders remain consistent with steady growth.
Figure 3. U.S. Economic Growth Remains Resilient
Weighted ISM New Orders Index vs. Real U.S. GDP
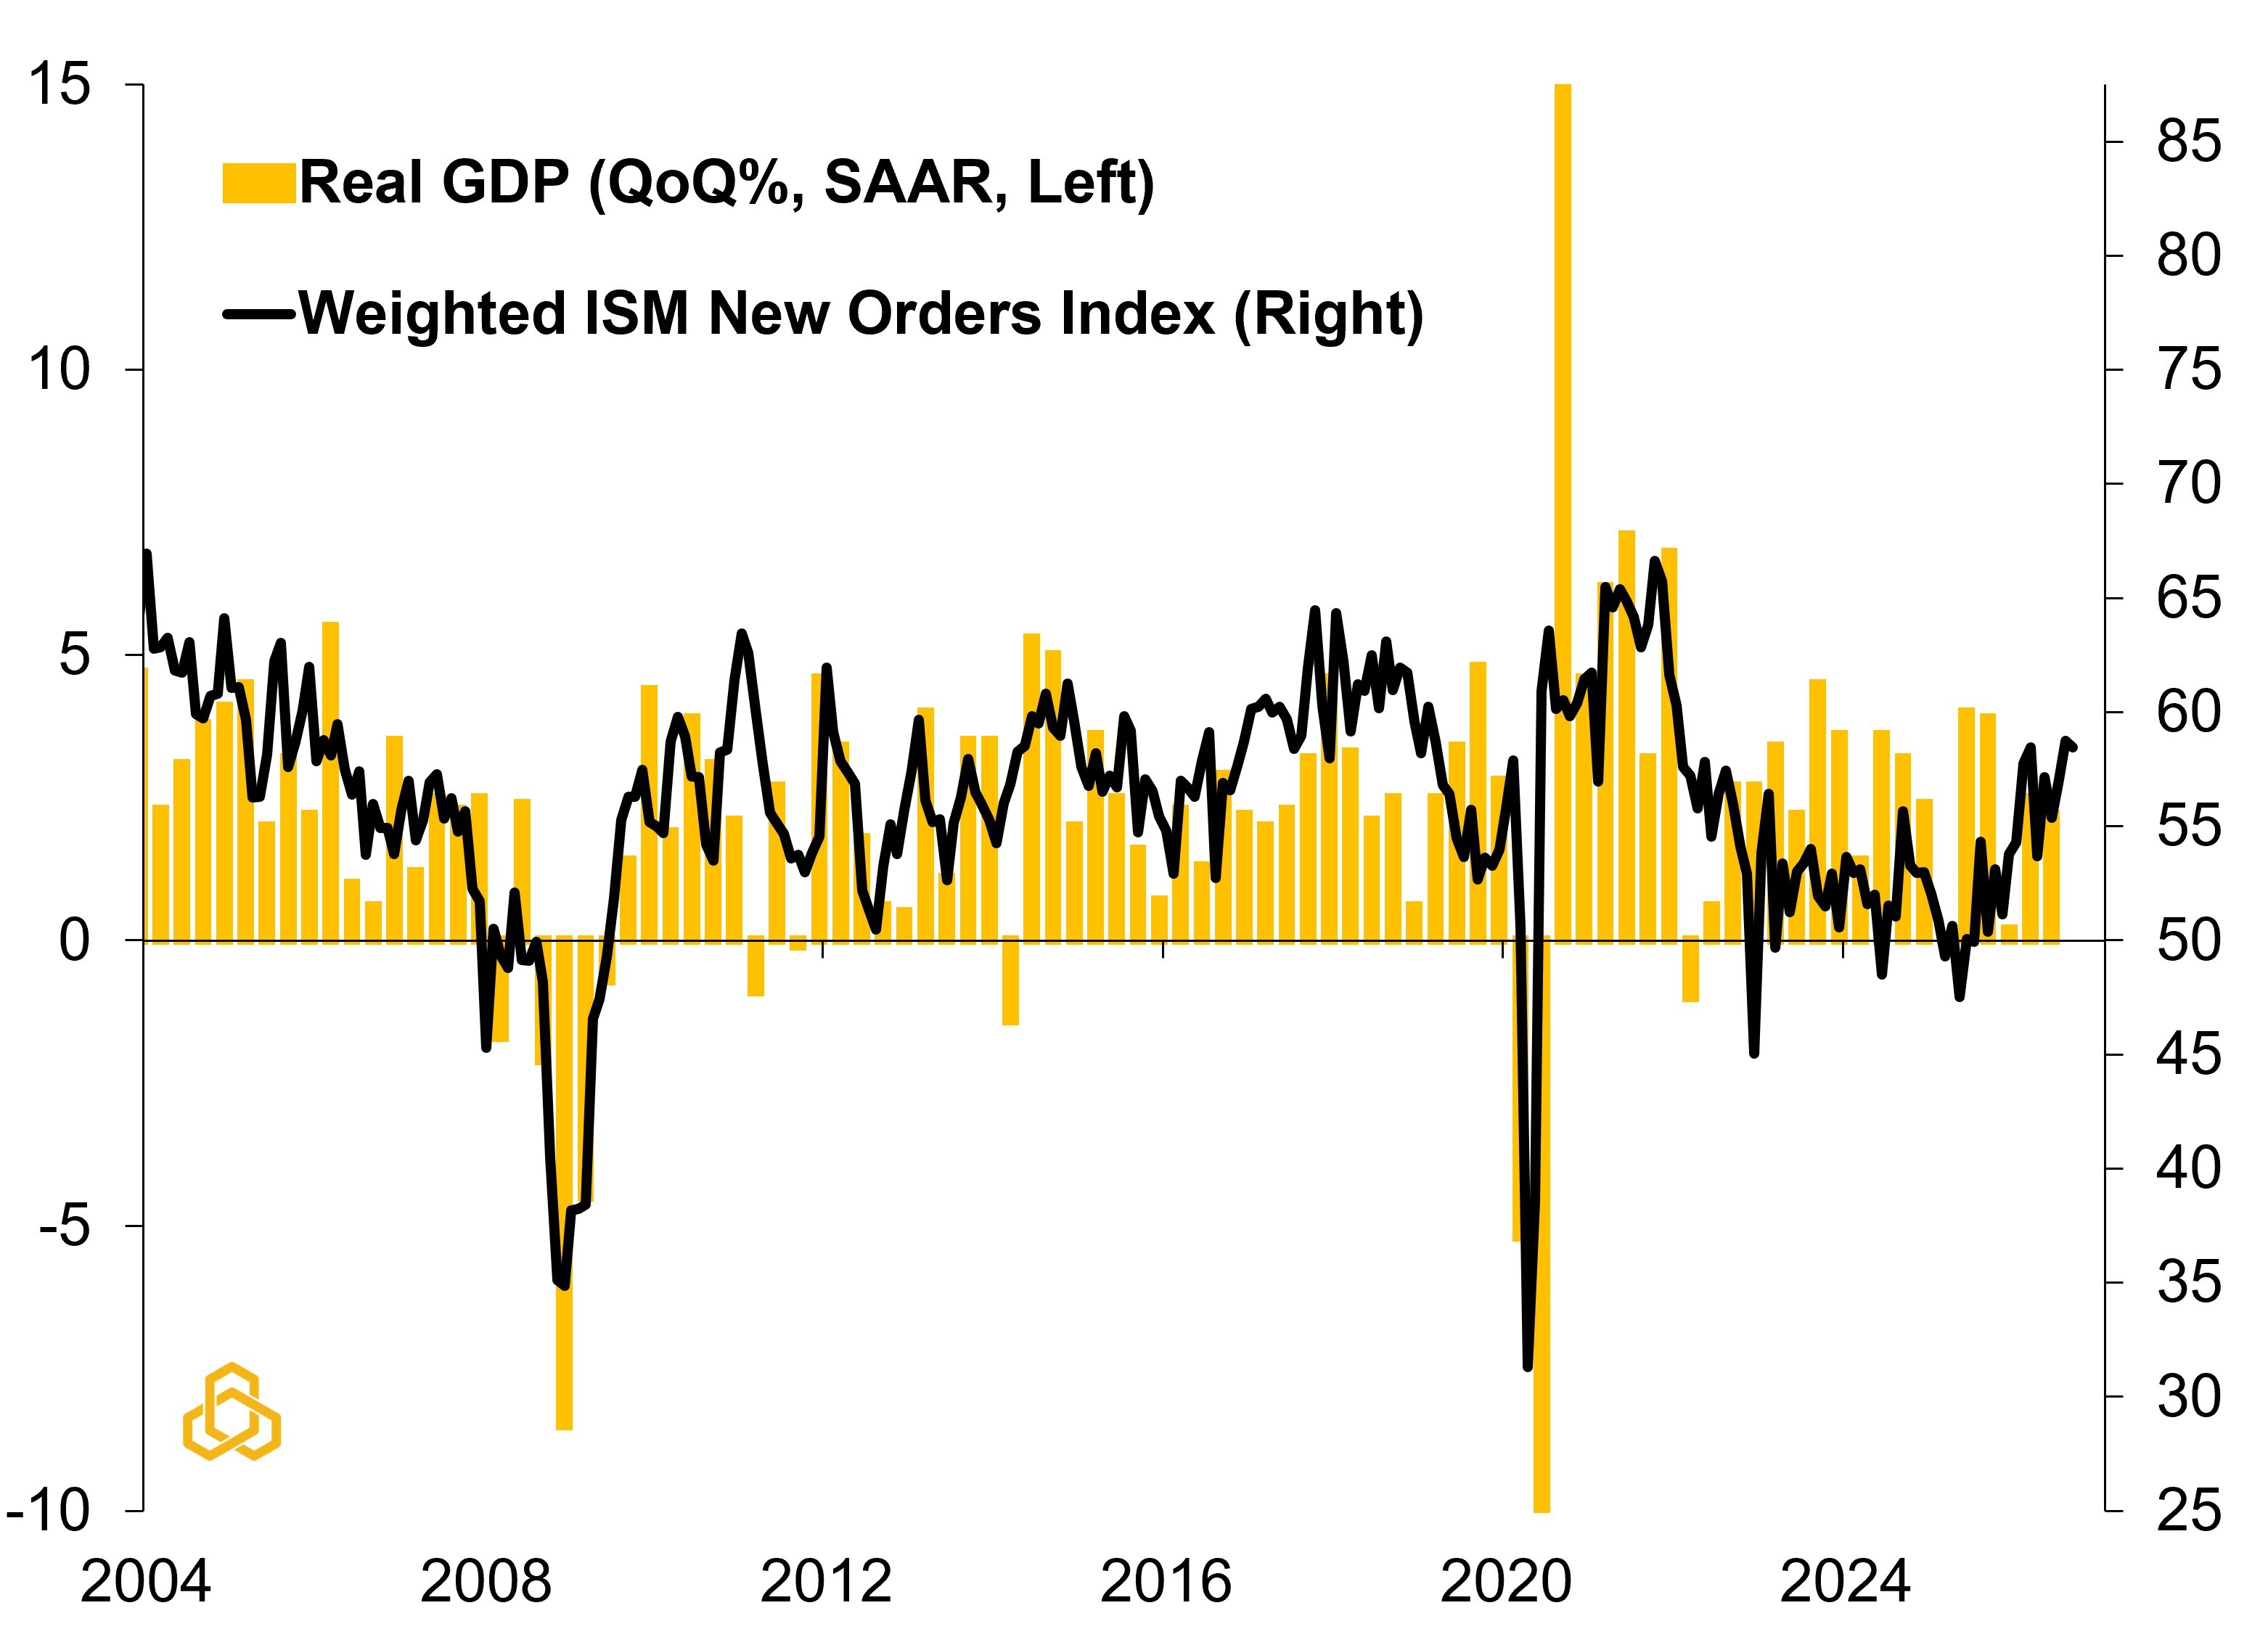
Sources: Bureau of Economic Analysis, Institute for Supply Management, Bloomberg L.P., and Potomac. Data as of September 2026 for ISM and 2Q 2026 for GDP.
On the surface, the economy remains resilient. That does not mean, however, that there are no headwinds. Elevated gasoline prices, rising mortgage rates, and tighter monetary policy are likely to weigh on growth with a lag. In fact, our leading growth composite, which combines measures of energy costs, financing conditions, and equity-market momentum, points in exactly this direction.
Historically, the composite has tended to lead our weighted ISM activity measure by roughly eight months, with a correlation of 0.63 over the available sample. Right now, it suggests a cooling in growth over the next six to twelve months.
The measure is not, by itself, signaling a recession, but it does suggest that today’s headwinds may increasingly take their toll over time.
Higher interest rates cannot directly lower the price of oil. They can, however, weaken demand elsewhere in the economy through higher borrowing costs and tighter financial conditions. Our composite suggests those channels are beginning to work, with rising mortgage rates and weaker equity-market momentum increasingly weighing on the outlook.
That is, after all, what tighter monetary policy is supposed to do.
Figure 4. Growth May Cool Over the Medium-term
Weighted ISM Composite Index vs. Potomac Leading Growth Composite

Sources: Institute for Supply Management, Bloomberg L.P., and Potomac. Data as of September 2026. Note: The ISM weighted index is 30% manufacturing and 70% services.
Having worked in financial markets for a long time, we know the world never stays static. Forecasting even a month ahead is extremely difficult, much less several quarters.
Still, based on the data today, it is not hard to envision the potential for a growth scare over the year ahead, even as growth currently remains remarkably resilient.
This may be the price we pay for lower inflation.

