The Future Ain’t What It Used to Be: What $100 Oil Really Means
Baseball legend Yogi Berra once joked, “The future ain’t what it used to be.” The quote is meant to be funny, but it also captures something important about financial markets: investors often assume the worst when uncertainty rises.
The outbreak of the U.S./Israel–Iran conflict has sparked renewed discussion of stagflation, with some fearing that an energy shock could weaken demand and push the economy toward recession. Maybe. But at this stage, we are not convinced.
A quick glance at financial or social media feeds would suggest the outlook is dire. Our LinkedIn feed, for example, is inundated with charts that look like this:
Figure 1. West Texas Intermediate (WTI) Crude Oil Spot Price ($/Barrel)
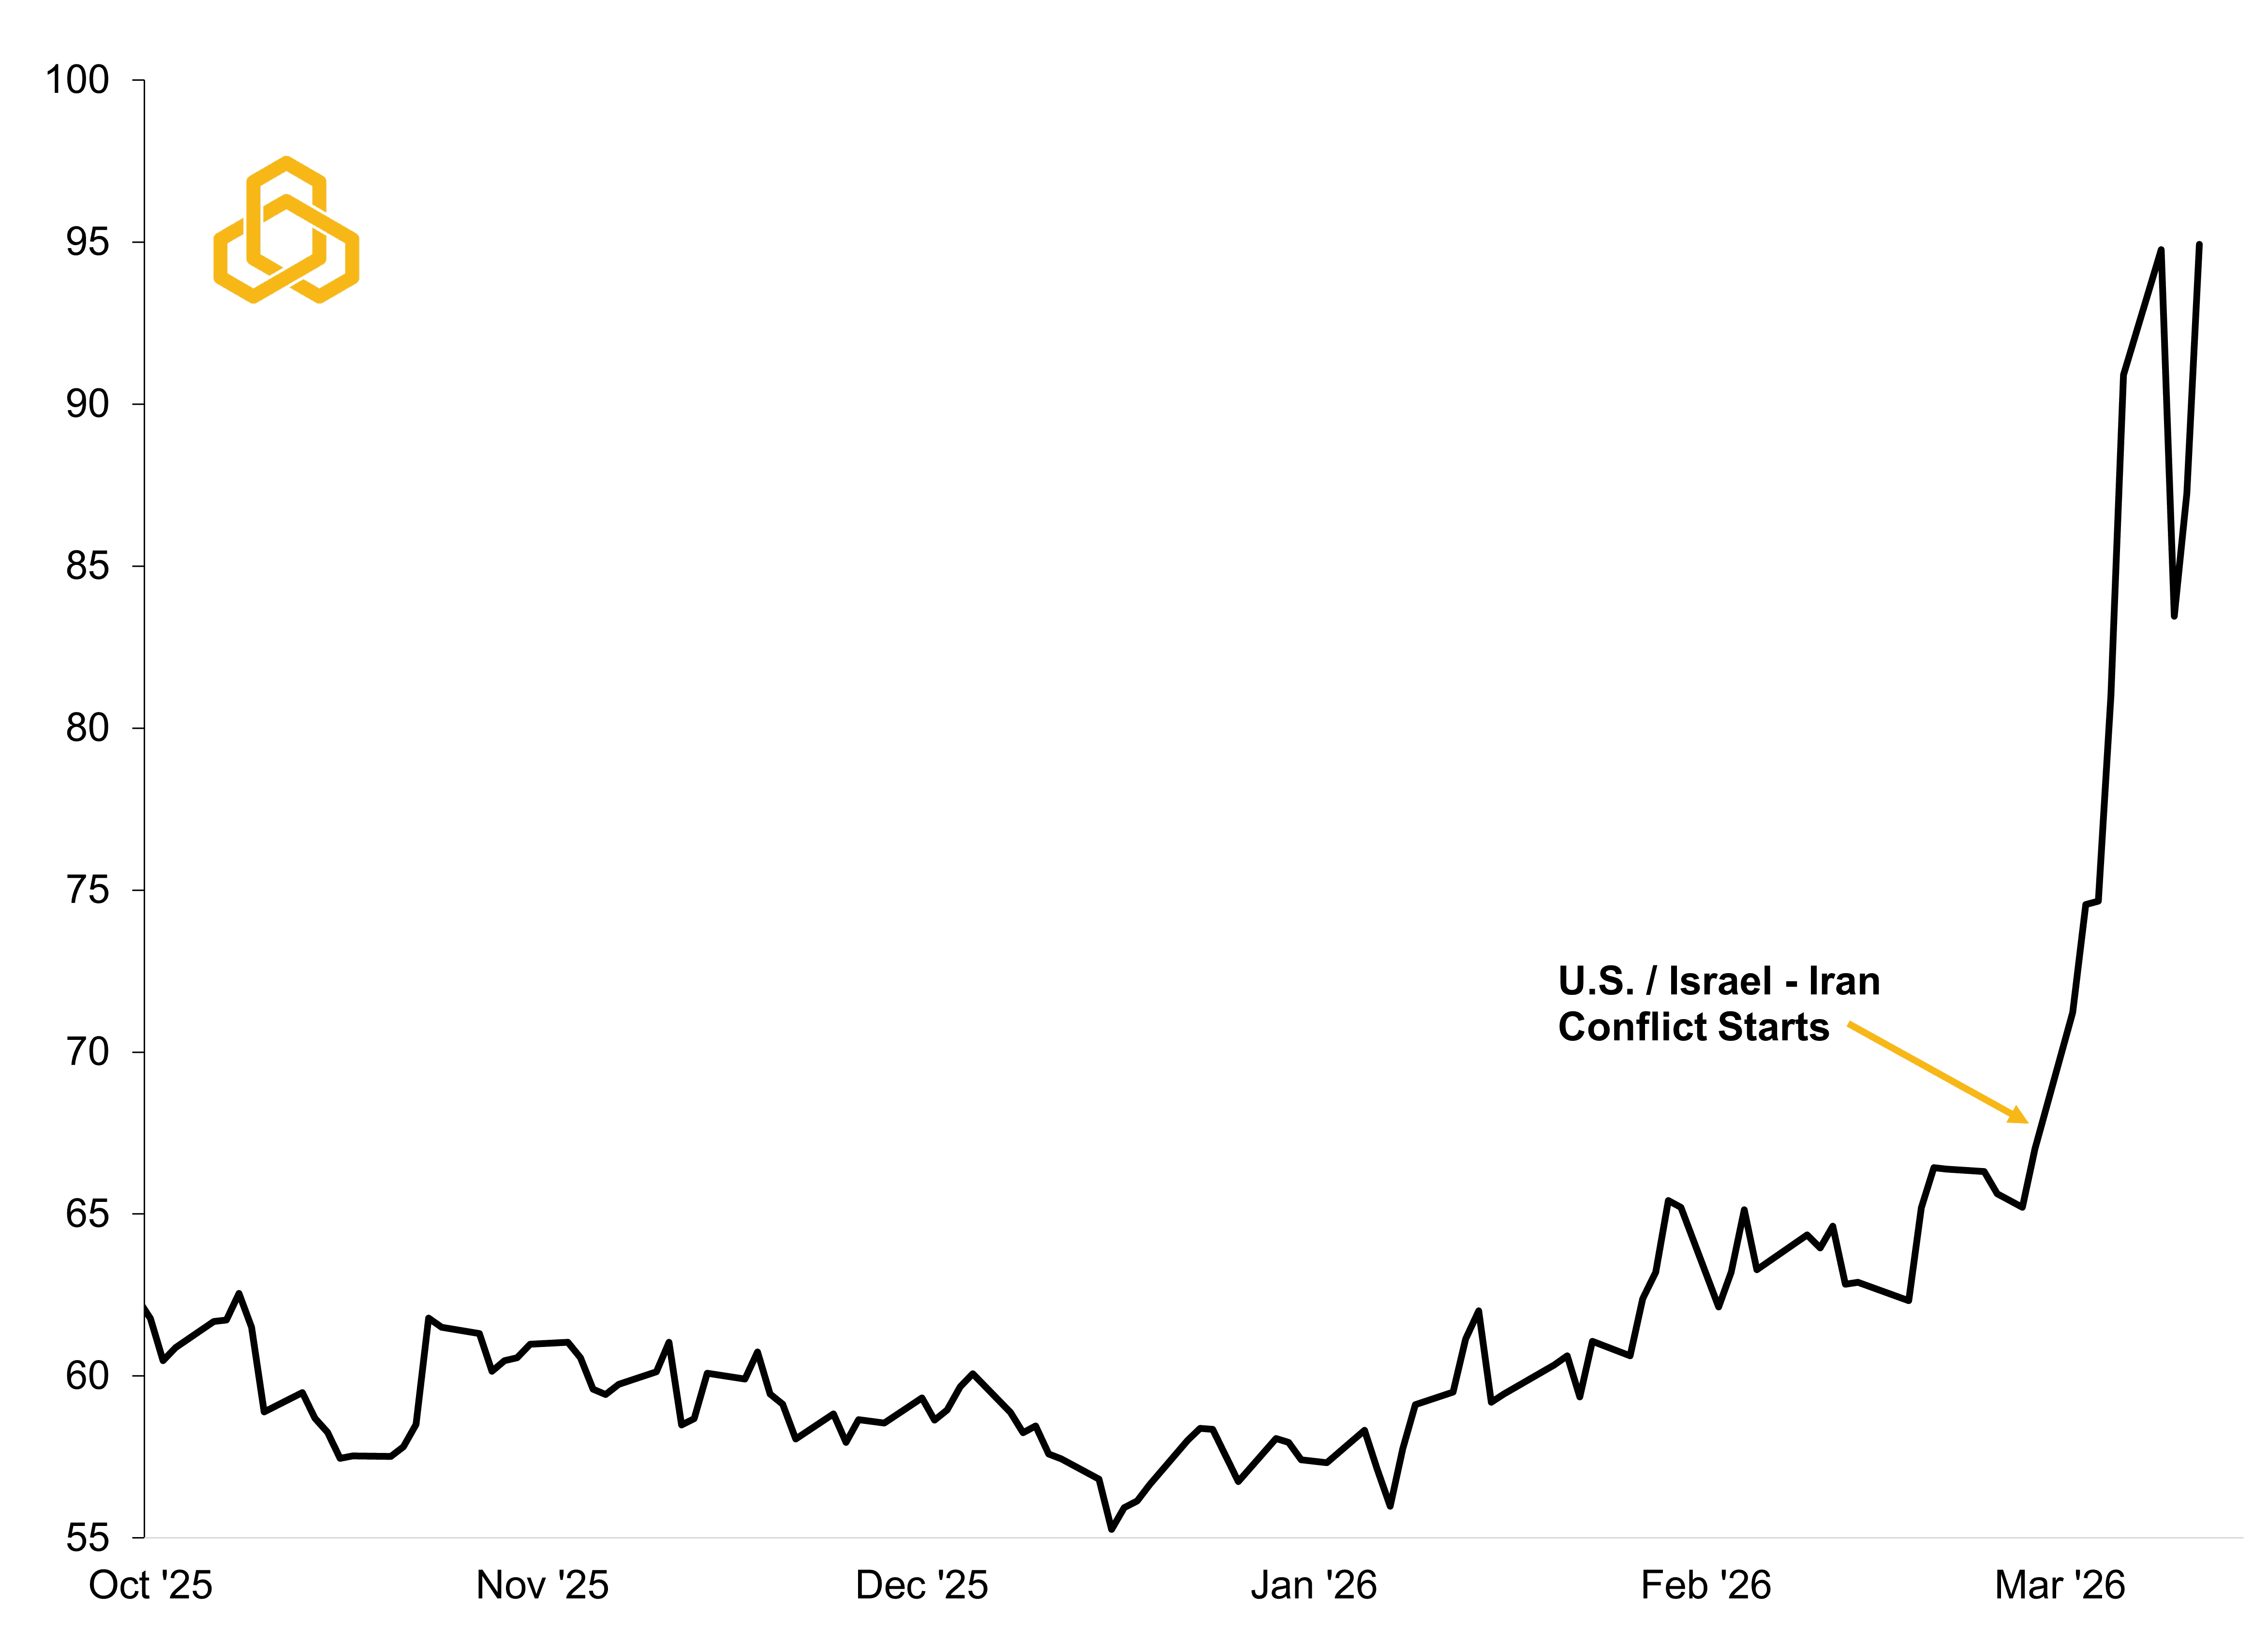
Sources: Department of Energy, Bloomberg L.P., and Potomac. Data as of March 12, 2026.
At first glance, the move is alarming. The conflict represents a real shock to the energy complex, and the surge in U.S. crude oil prices is translating into higher prices at the pump – something most Americans care about a lot. Thus far, the national average price of unleaded gasoline has risen from roughly $2.83 per gallon at the start of the year to about $3.60 today (see figure 2).
Figure 2. Daily National Average Gasoline Prices ($/Gallon)
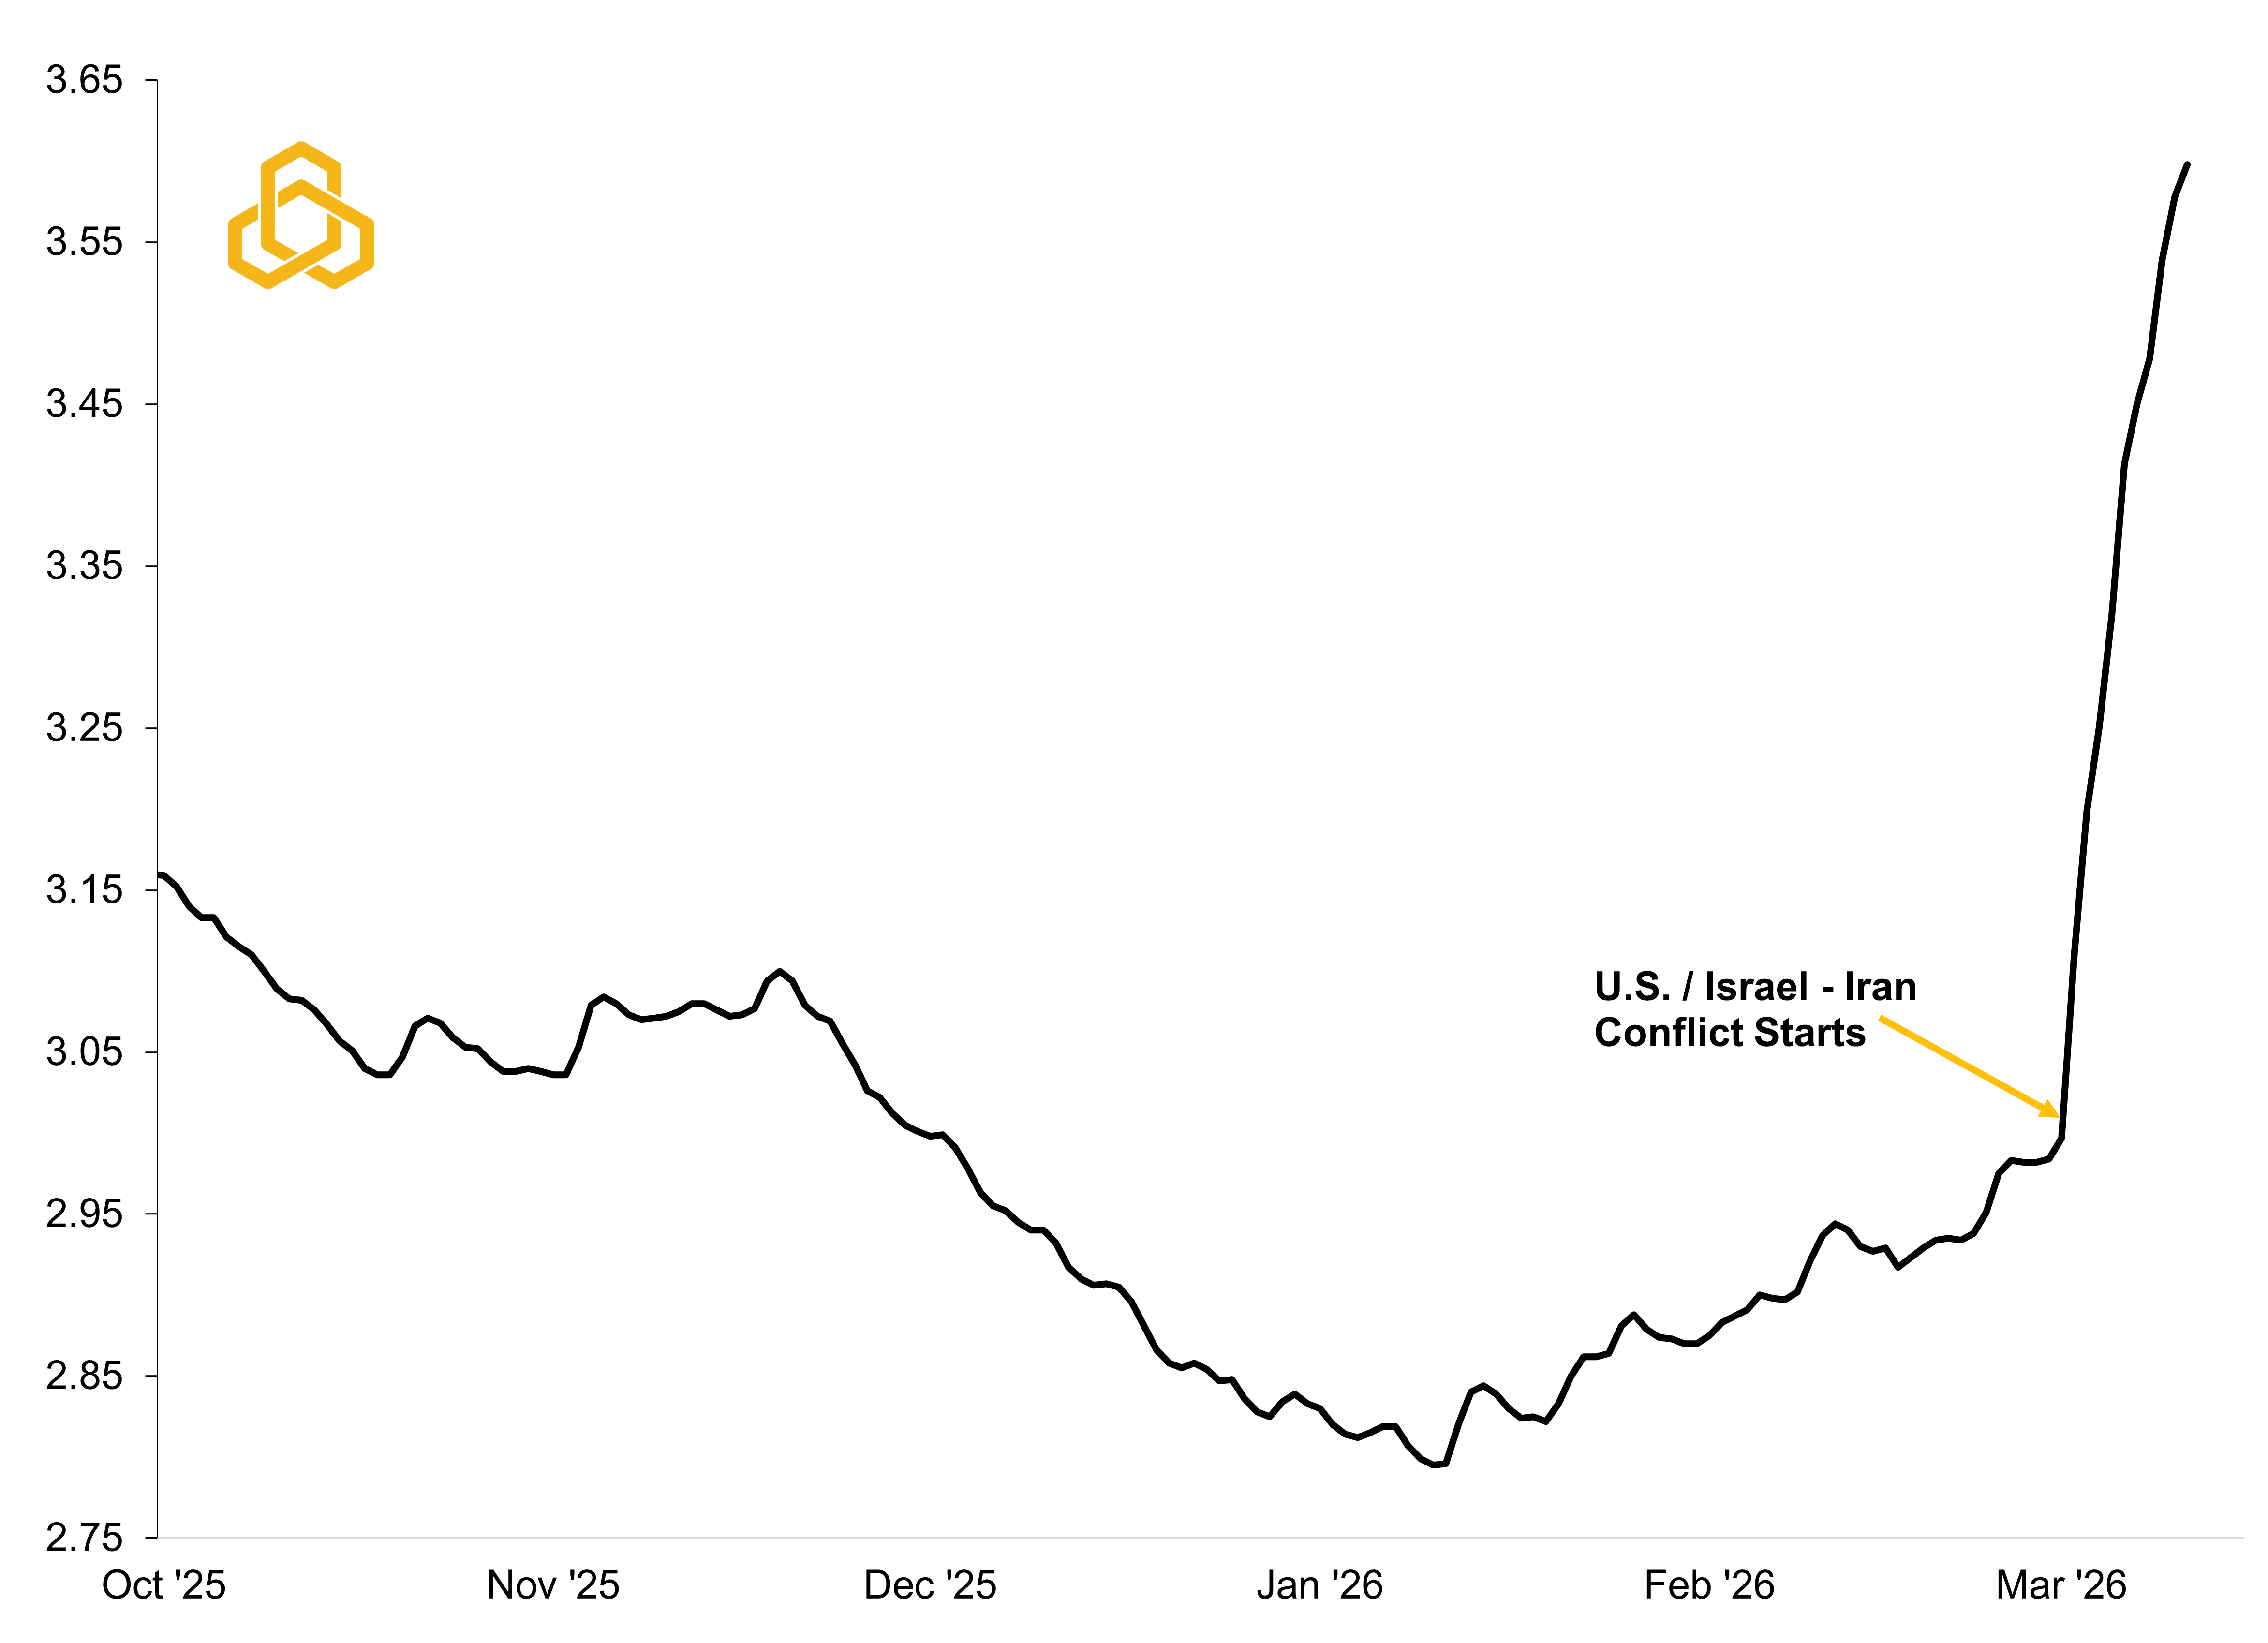
Sources: Department of Energy, Bloomberg L.P., and Potomac. Data as of March 9, 2026
This matters. A common rule of thumb is that every $0.10 increase in gasoline prices acts like roughly a $13–$14 billion hit to U.S. consumer purchasing power, based on total gasoline consumption of about 135–140 billion gallons per year.
If gasoline prices were to remain at today’s level for a full year, the recent increase would amount to roughly a $104 billion hit to household spending power at a time when many consumers are already stretched thin.1
[1] “Tax” is not technically precise; the increase represents more of a transfer, with some of the additional spending flowing to domestic oil producers, refiners, and foreign producers rather than the U.S. Treasury.
Were prices to rise by a full $1.00 per gallon for an entire year, the impact would be roughly comparable in magnitude to the individual tax relief contained in the Administration’s “One, Big, Beautiful Bill Act.” Essentially offsetting an expected tailwind that investors were anticipating coming into the year.
Zooming Out
However, zooming out helps put today’s headlines into perspective. On an inflation-adjusted basis, U.S. crude oil prices look less alarming. Oil prices were higher throughout 2010–2014, most of 2018, and much of 2022, yet the U.S. economy did not experience stagflation or fall into recession as a result (see figure 3).
Figure 3. Inflation-Adjusted West Texas Intermediate Crude Oil Price ($/Barrel)

Sources: Department of Energy, Bloomberg L.P., and Potomac. Data as of March 9, 2026. Note: Shaded regions denote periods of U.S. recession.
If the estimated $104 billion hit to consumer spending proves accurate, that would amount to roughly 0.5% of total consumer spending. Using Bloomberg’s Economics Forecast Model (SHOK), such a shock would reduce real GDP growth by roughly 0.2% to 0.3% and lift inflation by approximately 0.4% to 0.6% (see Figure 4).
Figure 4. Bloomberg’s Forecast Model for Headline CPI Inflation (YoY%)

Sources: Department of Energy, Bloomberg L.P., and Potomac. Data as of March 9, 2026. All forecasts are expressions of opinion and are subject to change without notice and are not intended to be a guarantee of future events.
This would represent a modest stagflationary shock, but not an economic collapse. Moreover, such an outcome would only occur if oil prices remained elevated for a full year. That seems unlikely with betting markets like Polymarket signaling that most investors expect a ceasefire around the April-to-June timeframe (see Figure 5). Roughly one quarter, not a full year.
Figure 5. Polymarket Odds of U.S. – Iran Ceasefire By Select Date

Sources: Polymarket.com, Bloomberg L.P., and Potomac. Data as of March 12, 2026. All forecasts are expressions of opinion and are subject to change without notice and are not intended to be a guarantee of future events.
Duration is the Key
Ultimately, the duration of the conflict will matter far more than the initial shock.
Looking at several past geopolitical disruptions in the Middle East and elsewhere, oil markets tend to follow a remarkably consistent pattern with the worst-case scenario being priced in very quickly.
Since the United States became a net petroleum exporter in 2020, oil prices have peaked, on average, about 11 days after the onset of a geopolitical shock.
At the time of this writing, it has been 13 days since the initial strikes on February 27, and it is increasingly possible that the intra-day spike in West Texas Intermediate to $119.48 on March 9 will ultimately prove to be the peak. Once again, history appears to be rhyming.
Normalization also tends to occur quickly, but we acknowledge that this episode may take longer. On average, it takes just under two months for the geopolitical risk premium to fade, with oil prices declining roughly 20% from their peak (see figure 6). However, front-month WTI futures contracts are not showing a 20% decline from the March 9 settlement price until approximately October or November. This would be roughly 7-to-8 months, but these contracts are known to adjust quickly as new information comes in.
Figure 6. Select Geopolitical Events and the Impact on WTI Oil Prices

Sources: Energy Information Administration, Bloomberg L.P., and Potomac. Data as of March 9, 2026. Note 1: Oil prices are West Texas Intermediate from Cushing, Oklahoma. Note 2: Event start oil prices reflect the WTI price on the event date, or the next trading day when the event occurred on a non-trading day. Peak prices are the highest daily WTI price within 60 days of the event. Risk premium fade dates represent the first decline of at least 20% from the peak within 120 days; if no such decline occurred, the lowest price within that 120-day window was used.
Bottom Line
Uncertainty remains high. But at Potomac, we try to focus on data over feelings. If historical patterns prove reliable, the peak in oil prices may already be behind us and fears of a prolonged stagflationary shock are probably being overstated. Our team will continue to monitor developments closely and keep you informed as conditions evolve.
PFM-315-20260304