Another week, another record for the widely followed equity indices. Strength in the market is broad. The "generals" are leading and the "army" is charging into battle with them.
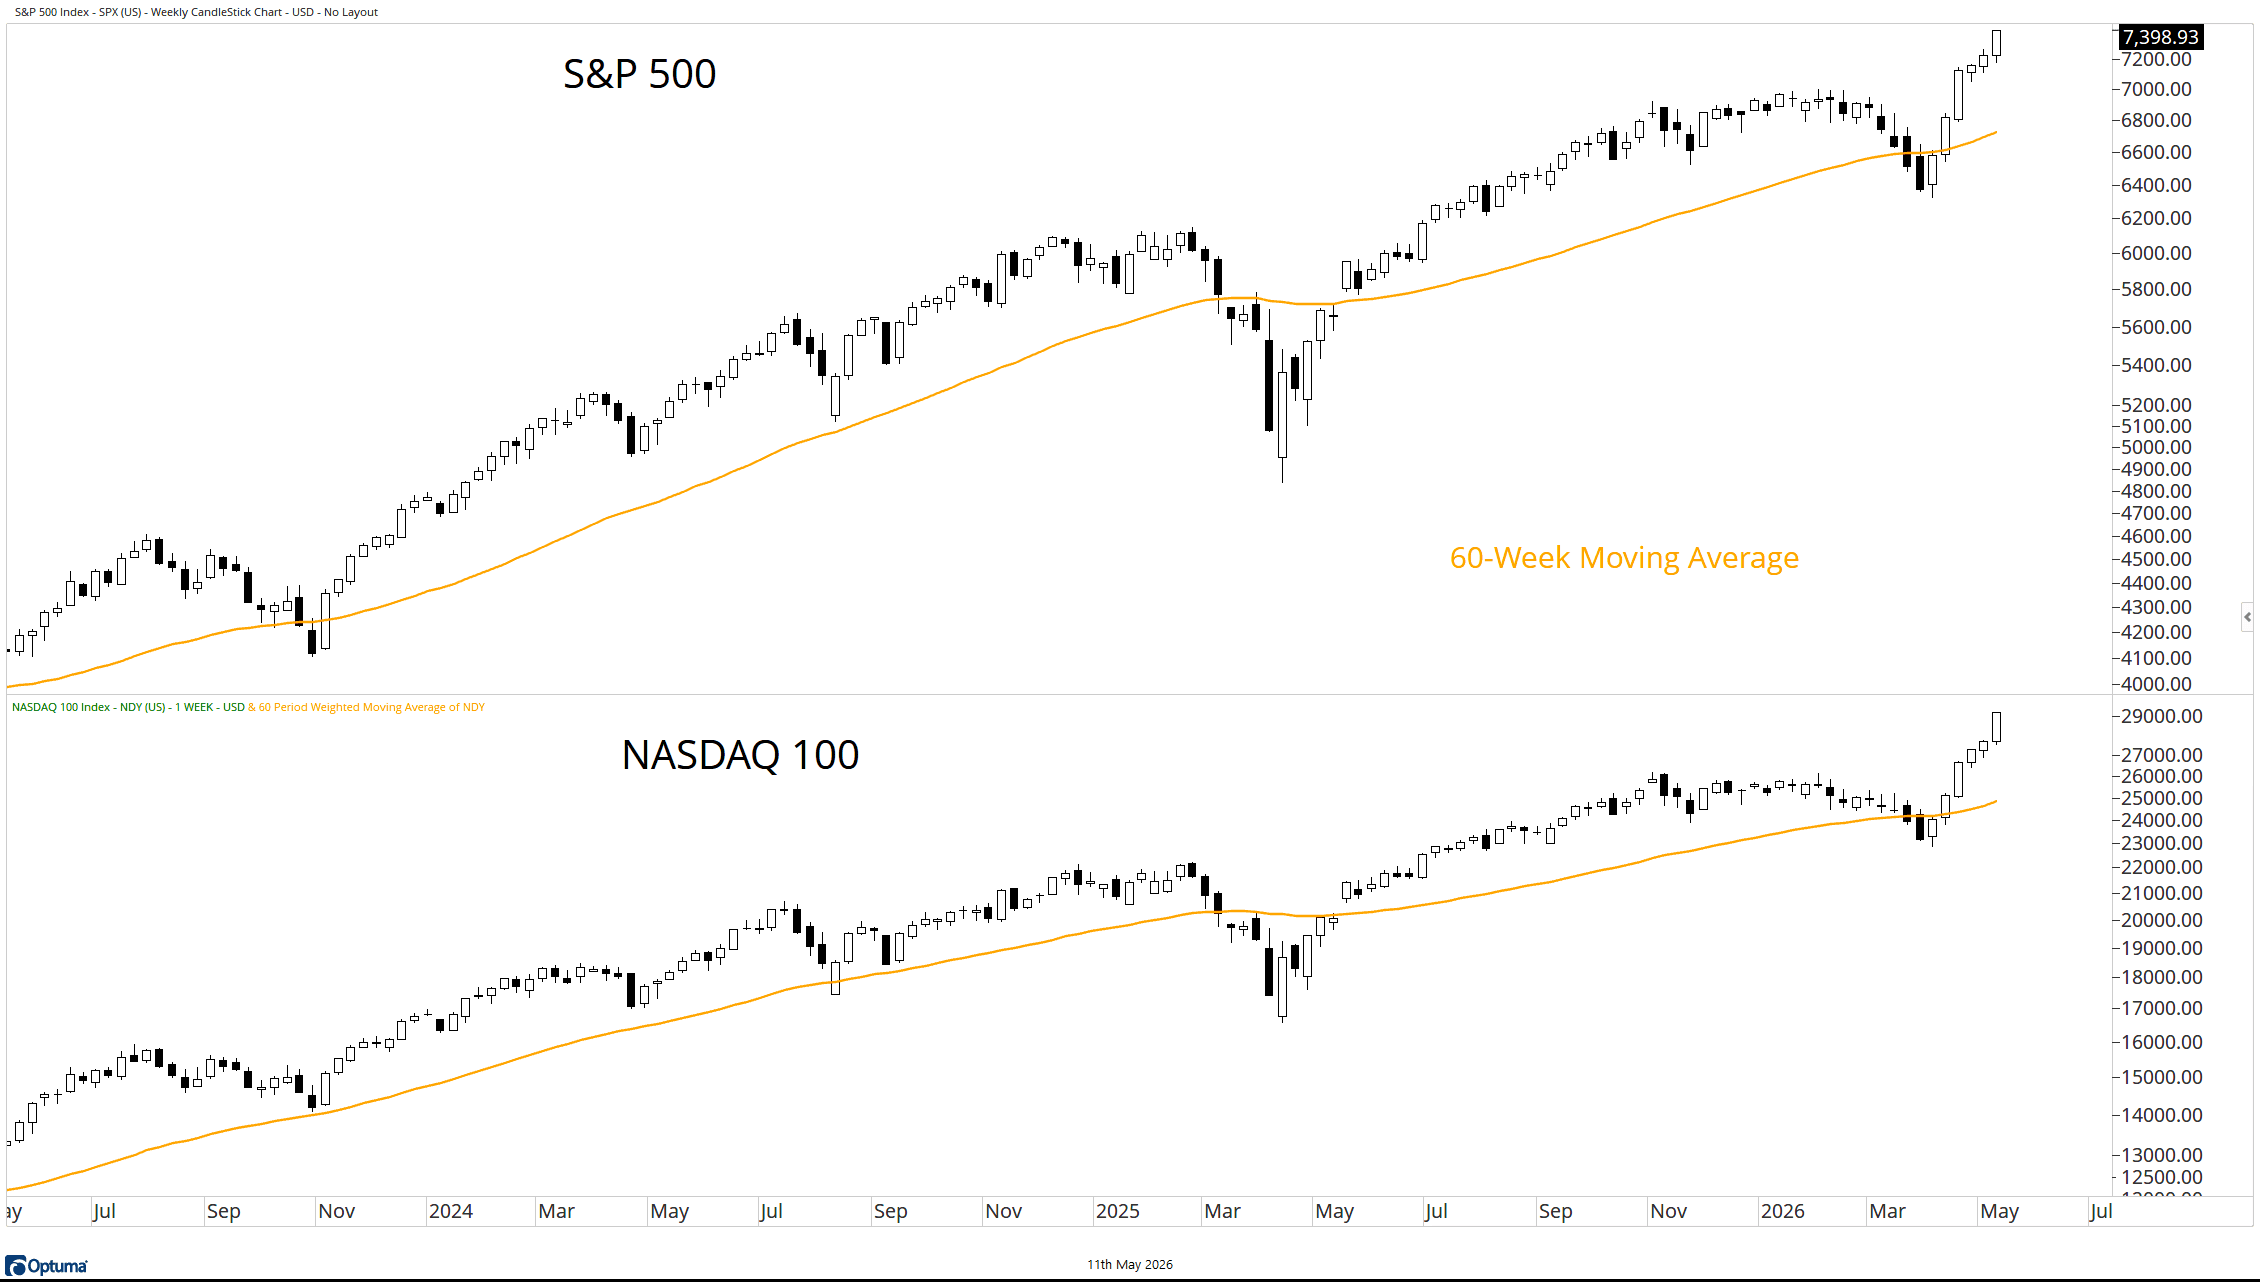
S&P 500 AND NASDAQ 100
Both the S&P 500 and the NASDAQ 100 closed at record levels...again! That makes six in a row for the two most closely-watched indices in the U.S. which by definition are above their rising 60-week moving averages.
As always, we like to see where in the weekly range they close, and in both cases Friday's closing print was the top of the weekly range.
Source: Optuma
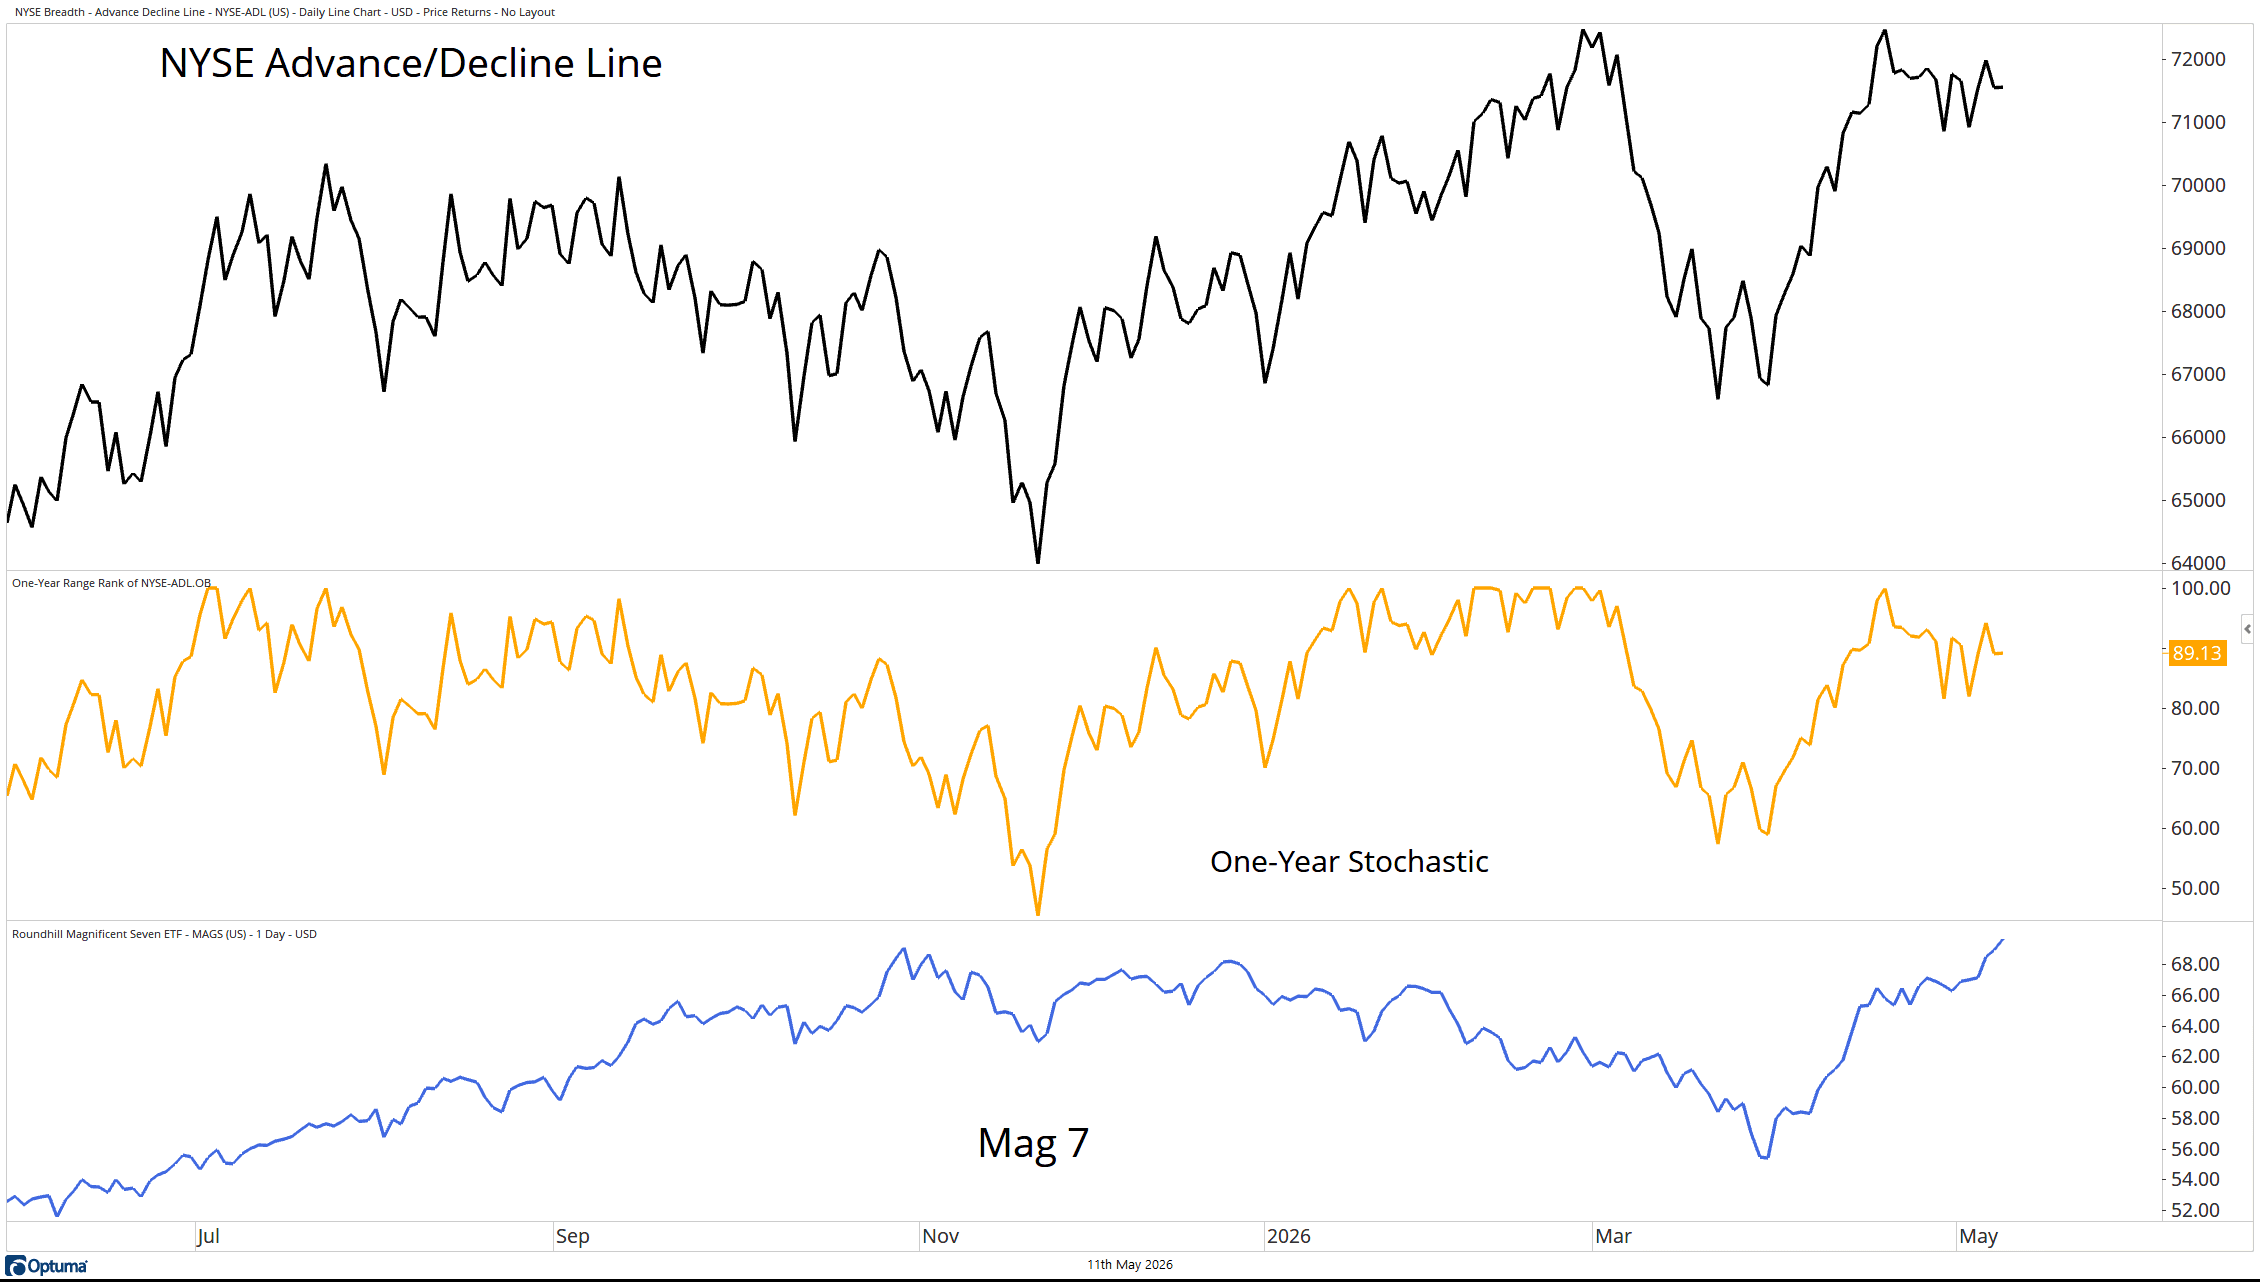
THE GENERALS ARE CHARGING
The NYSE Advance/Decline has a one-year stochastic that closed the week at ~89%. At the same time, the Roundhill Magnificent Seven ETF (MAGS) closed the week at record levels.
Said differently, the generals are charging into battle, and the rest of the army is charging with them.
Source: Optuma
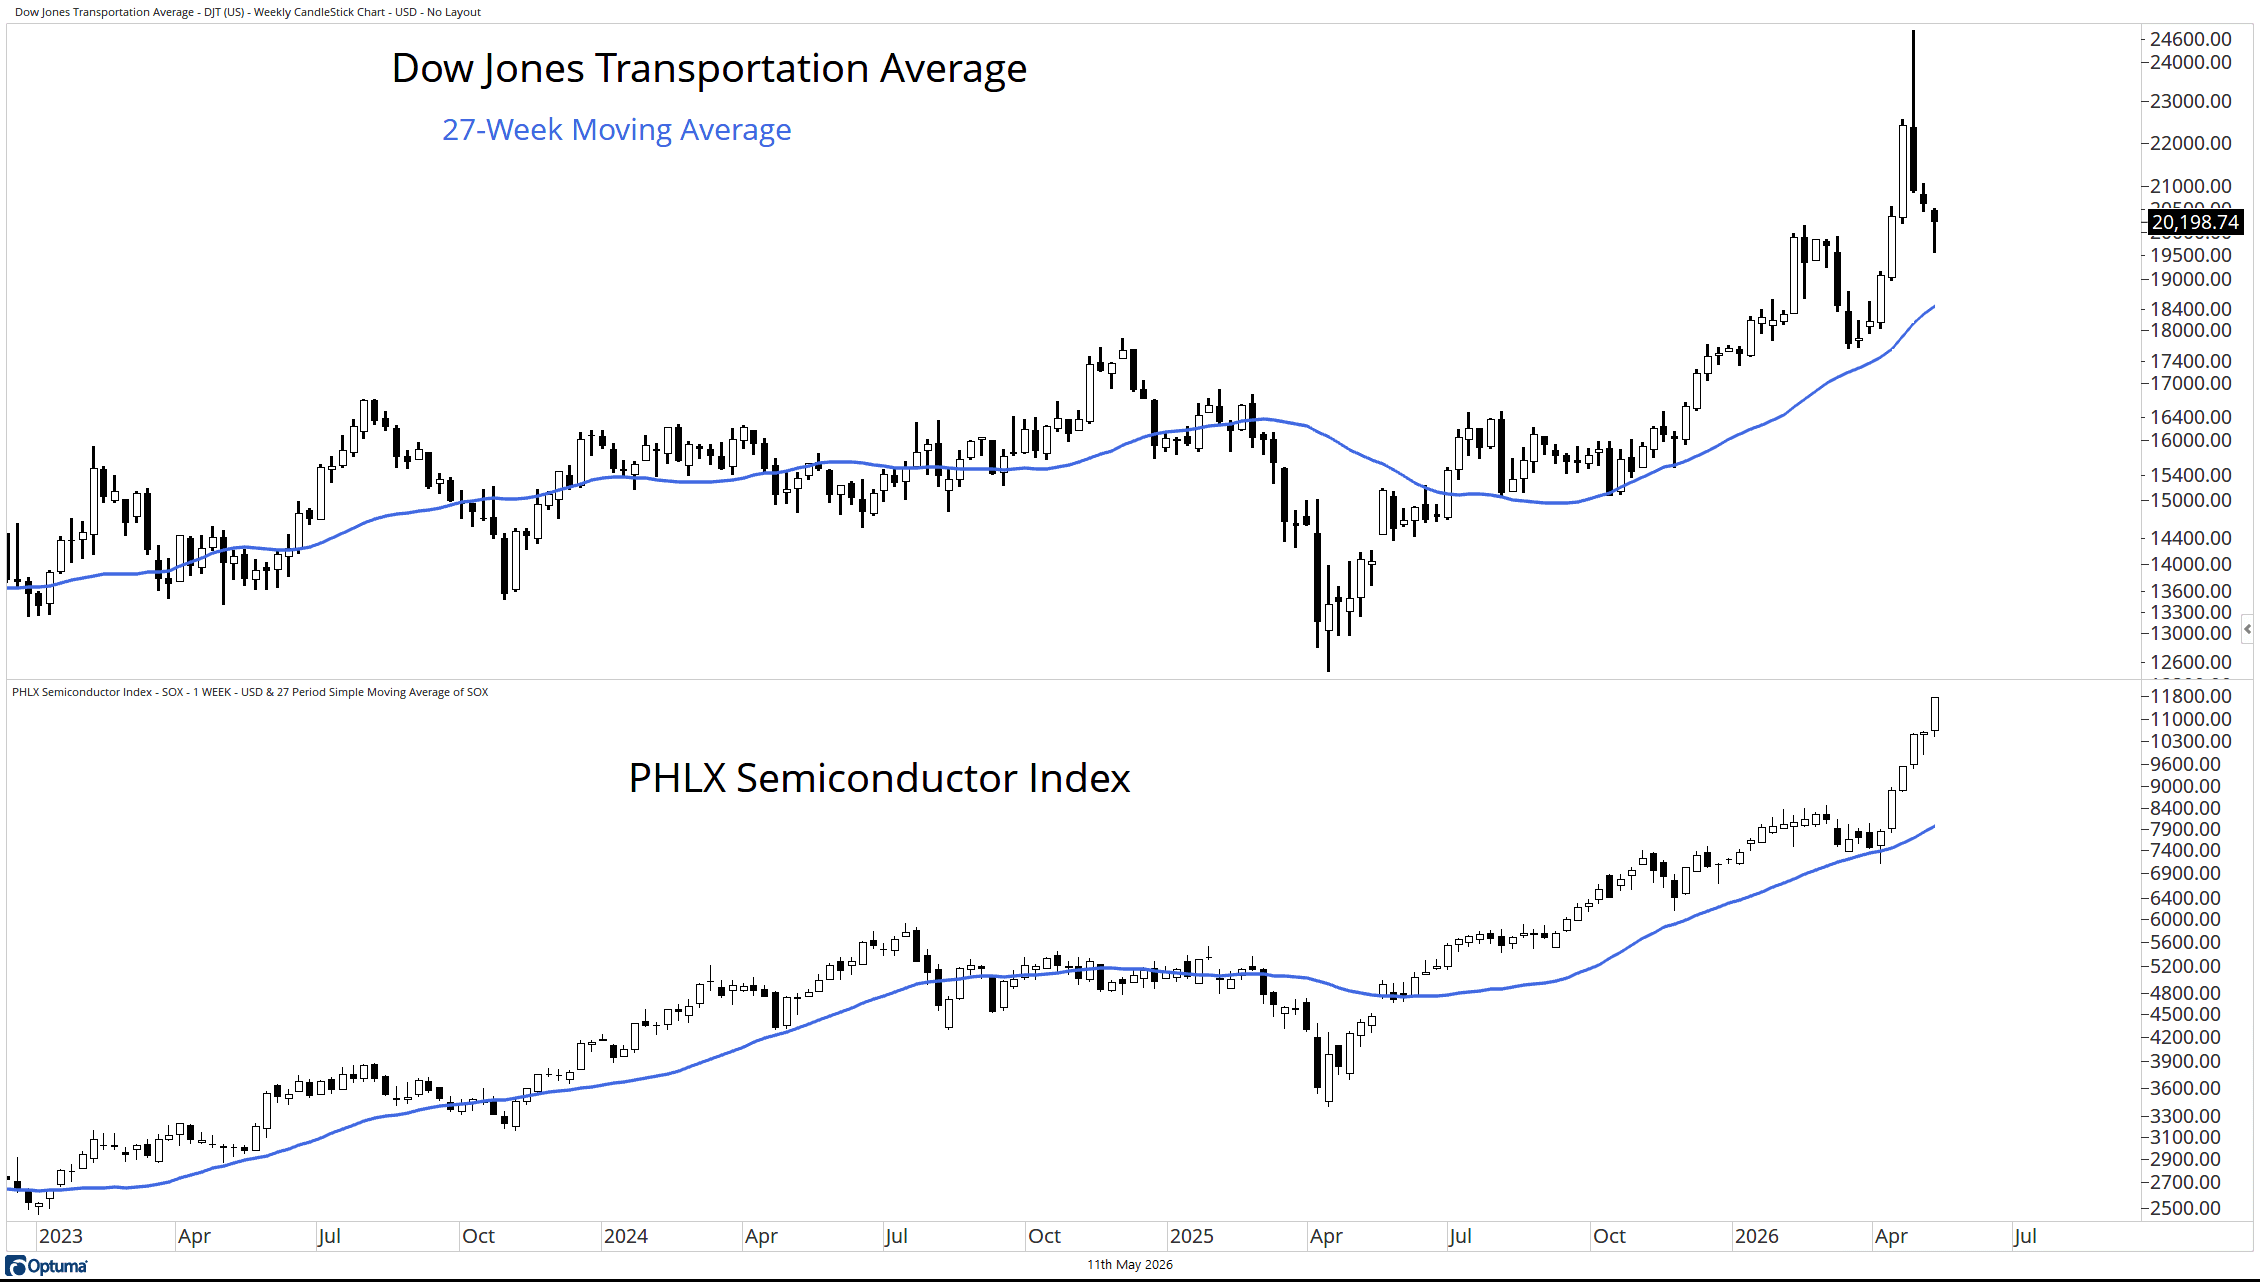
INTERMARKET THEMES ARE STRONG
We pay a lot of attention to intermarket themes. In particular, the Dow Jones Transportation Average, which has begun to rebound from its Avis Budget Group induced volatility. The Transports remain above the rising 27-week moving average keeping the trend bullish.
However, we also have a keen interest in the semiconductor industry. The PHLX Semiconductor Index has rallied for four consecutive weeks, is above its 27-week moving average, and sits at record levels.
Source: Optuma
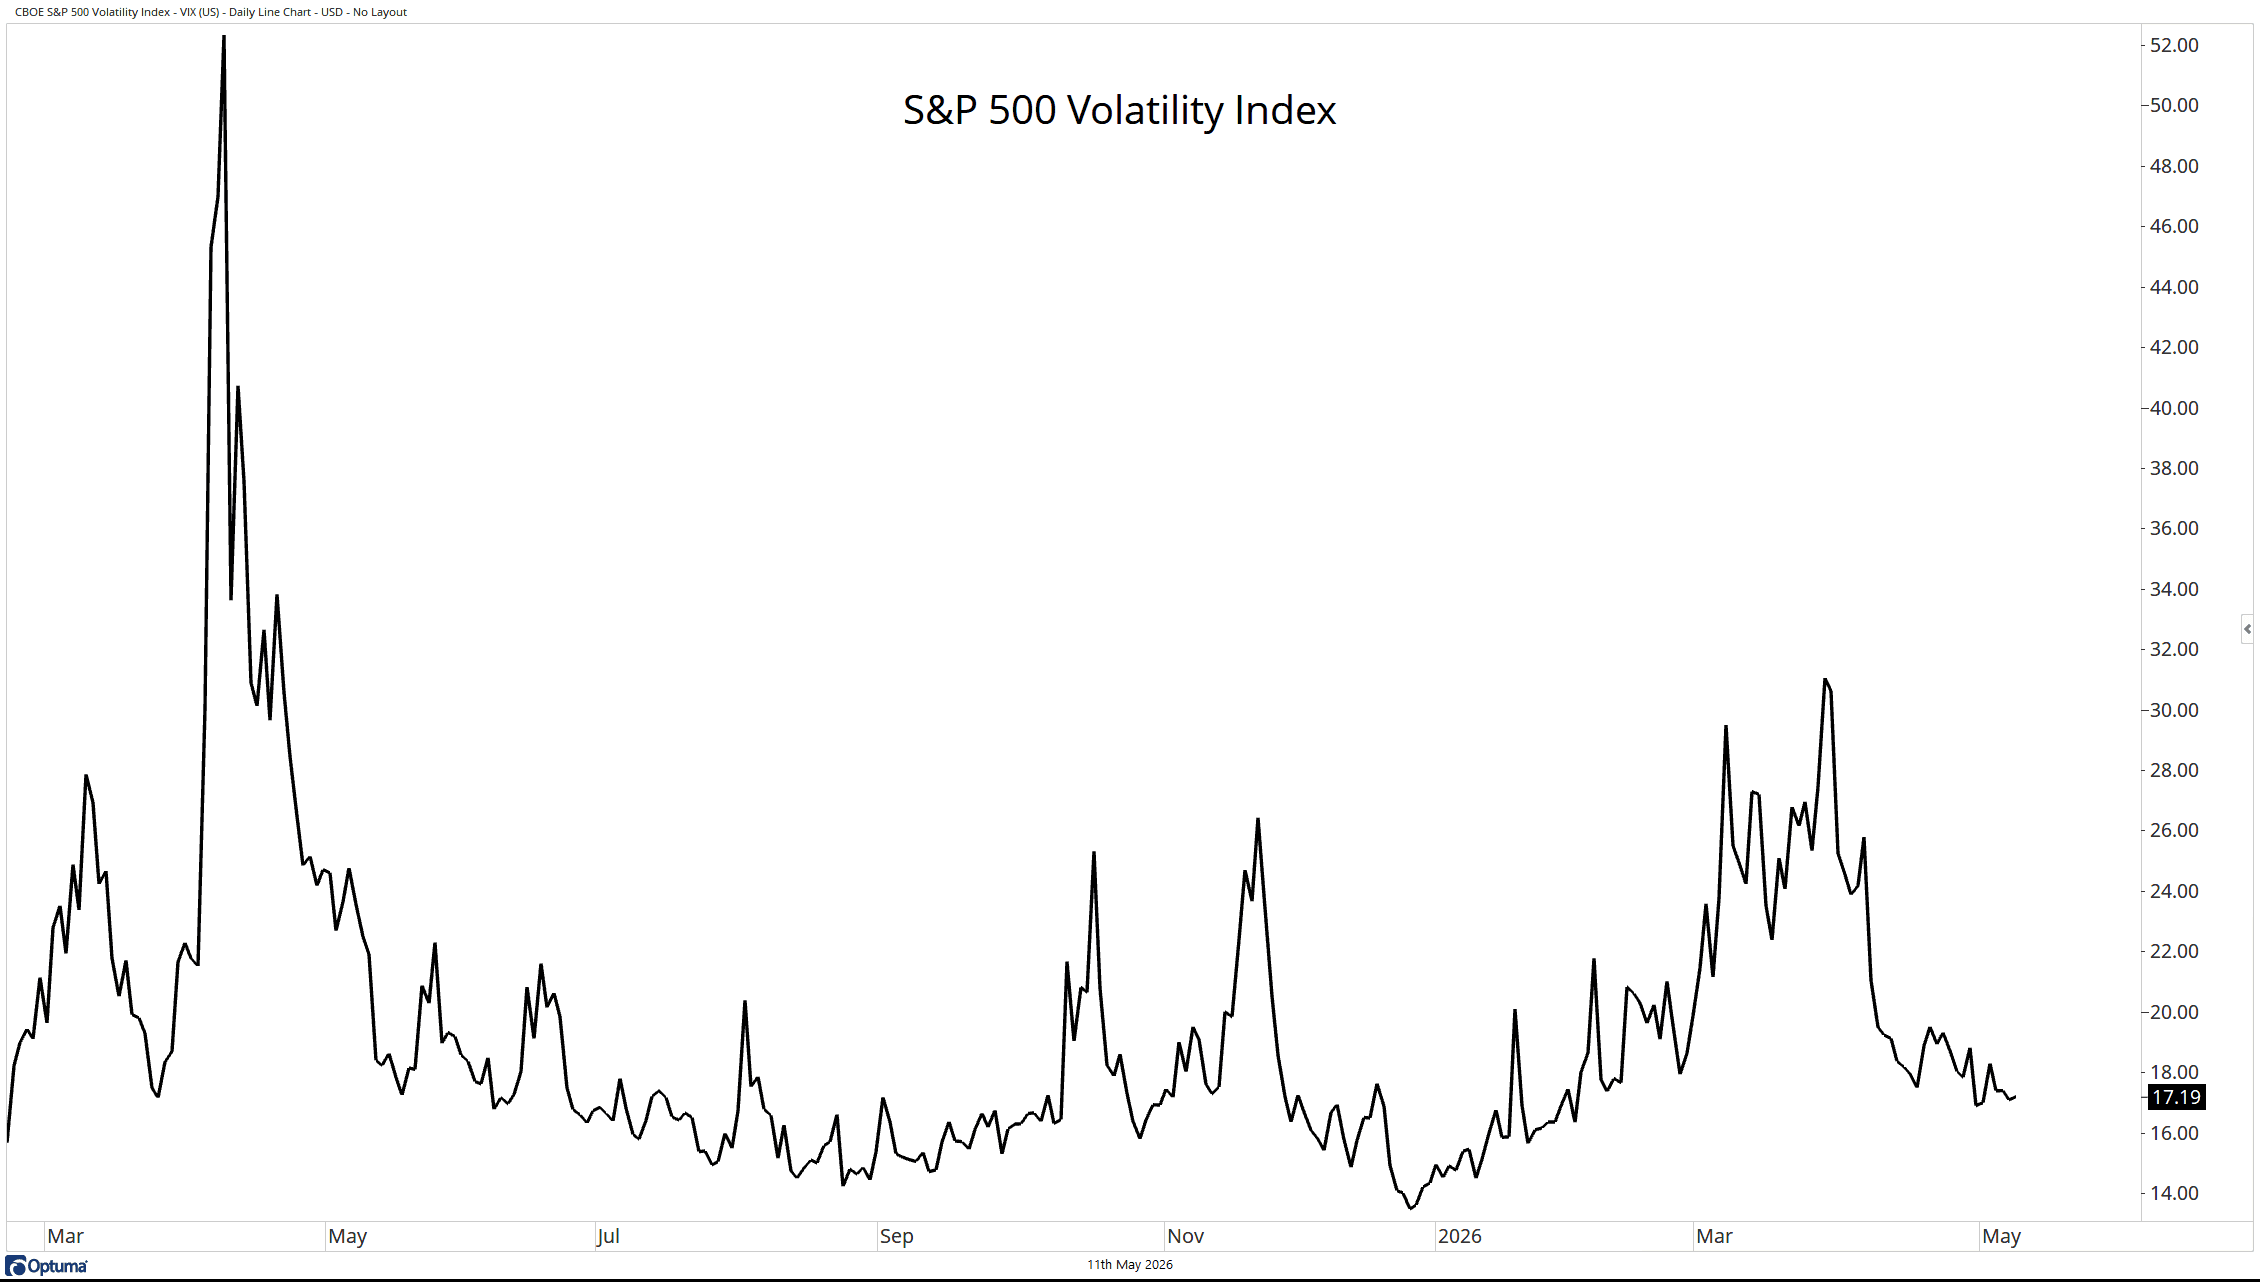
WE WOULD LIKE TO SEE A LOWER VIX
The S&P 500 Volatility Index has reverted from the March highs, but it is a bit surprising that it remains near 17. For context, a VIX at 17 means that investors expect the S&P 500 to move about 1.07% over the next month. I would have expected more calm given current index levels.
Source: Optuma
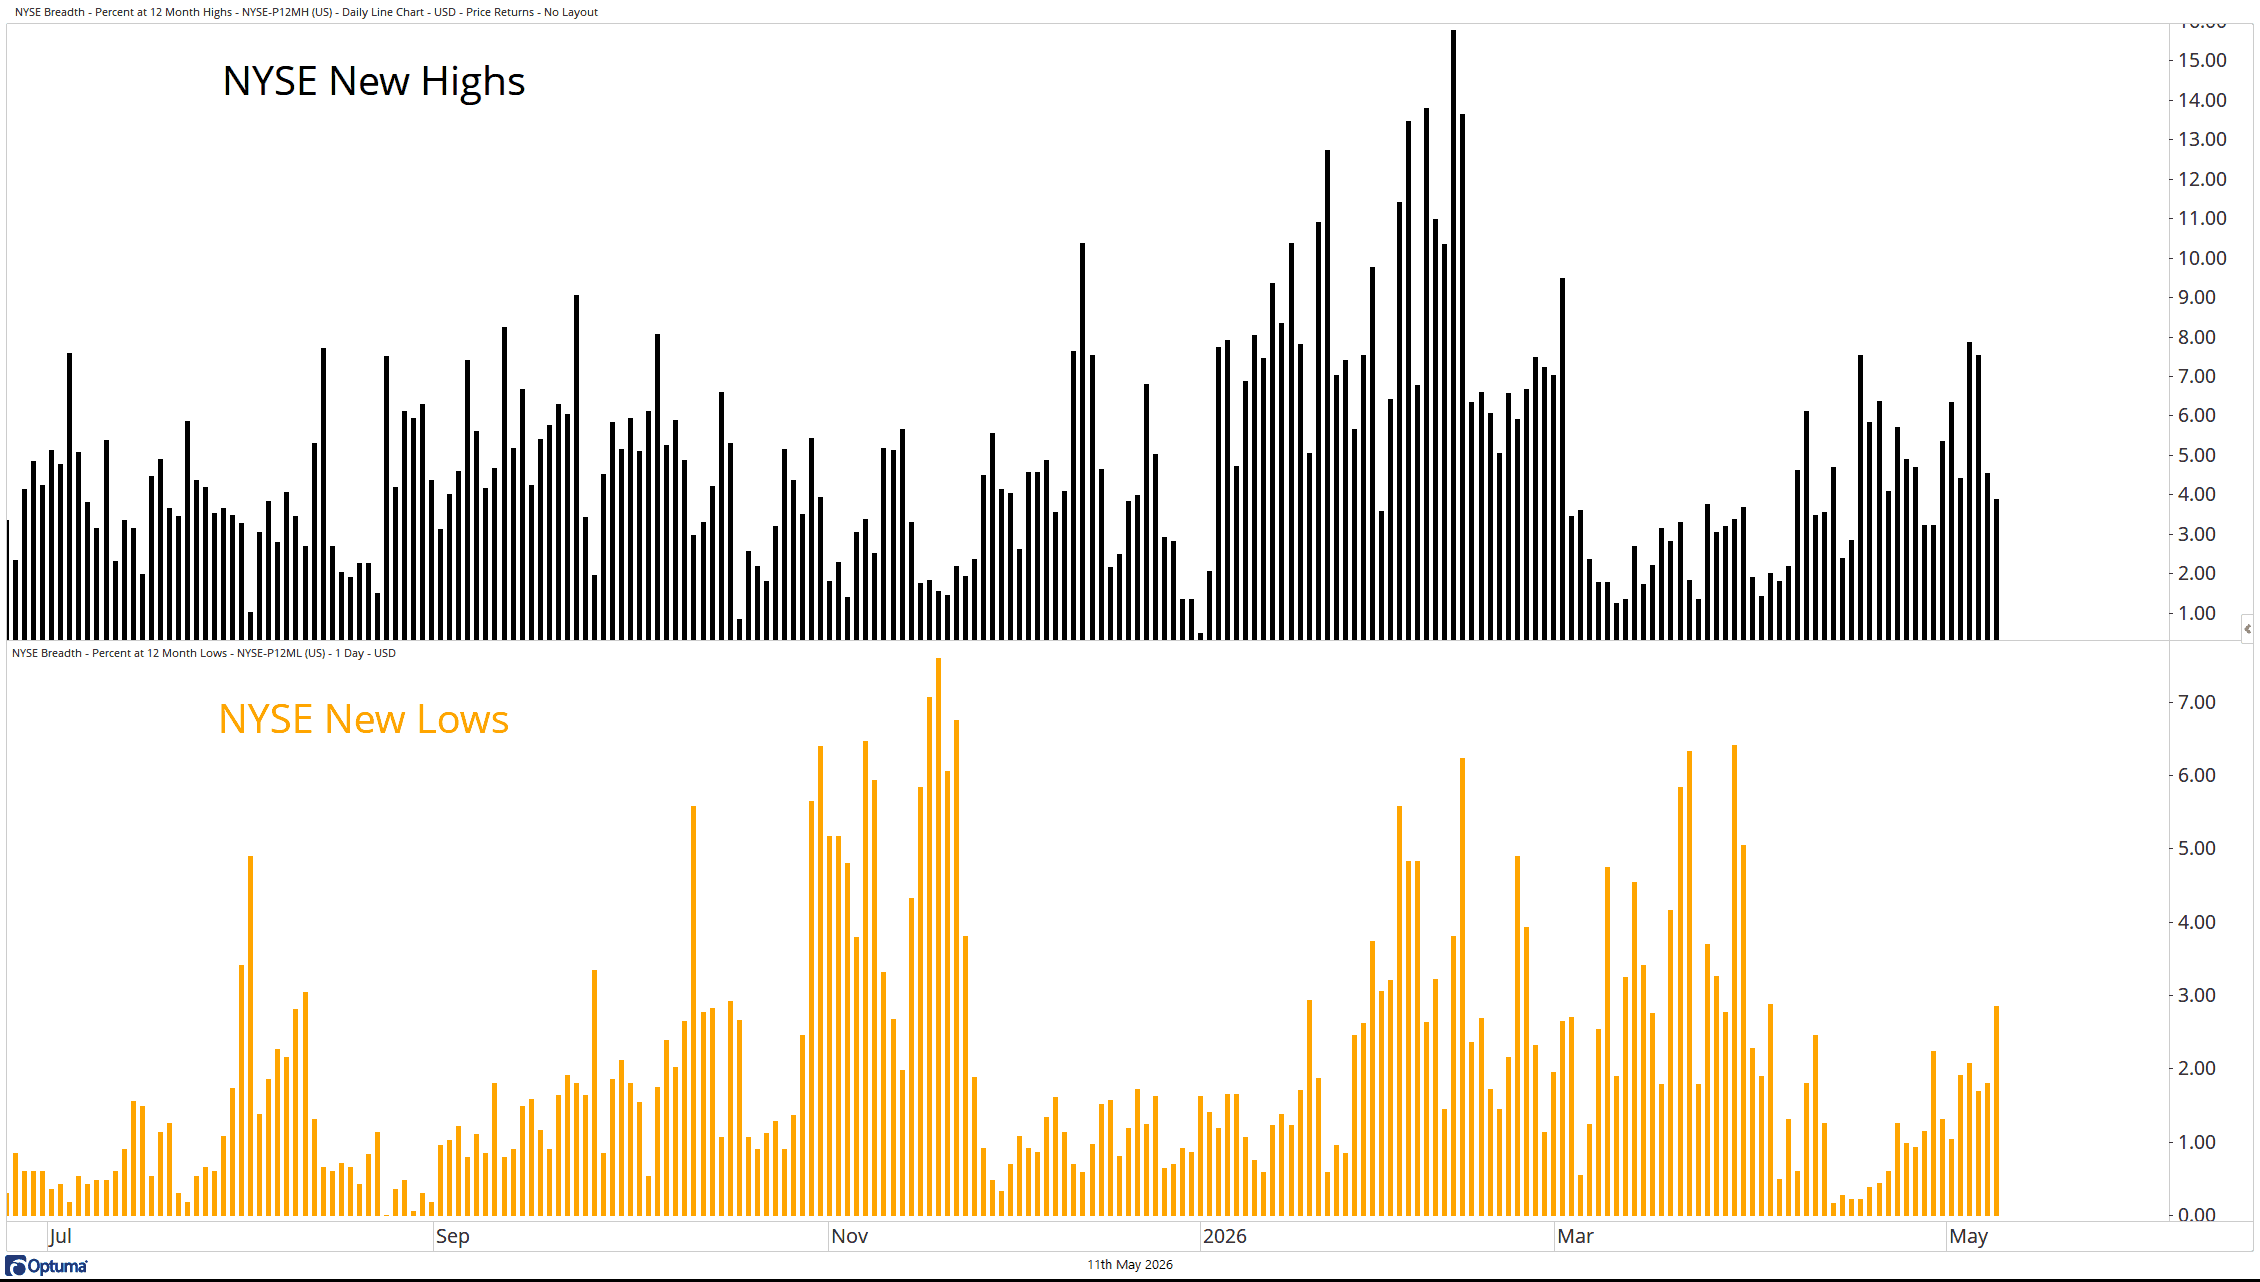
NYSE NEW HIGHS AND NEW LOWS
There is a lesser-known indicator that came to mind as I was doing my work this weekend. It comes from a book that you may not have heard of, "Stock Market Logic: A Sophisticated Approach to Profits on Wall Street." The author is a man that many do not know, Norman Fosback. As you can imagine, I have the book.
In it Fosback introduces the High-Low Logic Index. The index seeks to identify times when both new highs and new lows are expanding as this could signal a regime change of some kind. A strong bull market has a lot of new highs and few new lows; the reverse is true for a strong bear. It is rare to see a market where there are many new highs and new lows, which is why I am taking note of recent activity in the market.
Source: Optuma
FINAL THOUGHTS
Let this sink in; in order to make the semblance of a bearish case, we had to pull up an indicator from a book that was published in the mid-1970’s by an author that many do not know. That speaks to the strength of the current trend, but it also provides a thread for the contrarian in me to pull.


