We are not in the business of making an “inflation call.” The recent dissent of three Federal Open Market Committee (FOMC) members at the April meeting, who wanted to remove language that implied “additional adjustments” in favor of a more neutral stance, highlights that even the experts remain undecided on the path of inflation. That does not mean, however, that we cannot look at what the data are telling us.
Our preferred measure remains our weighted ISM prices paid index, which tends to lead the official consumer price index (CPI). The business sentiment survey asks supply managers on the ground whether they are seeing higher or lower input costs. When they do, companies often pass at least some of those costs on to consumers. In the latest readings, those input prices have jumped sharply. While the circles in figure 1 highlight that our metric tends to overshoot actual inflation near peaks, the latest data point toward headline CPI moving closer to 4.0%.
Figure 1. ISM Weighted Prices Paid vs. the Consumer Price Index
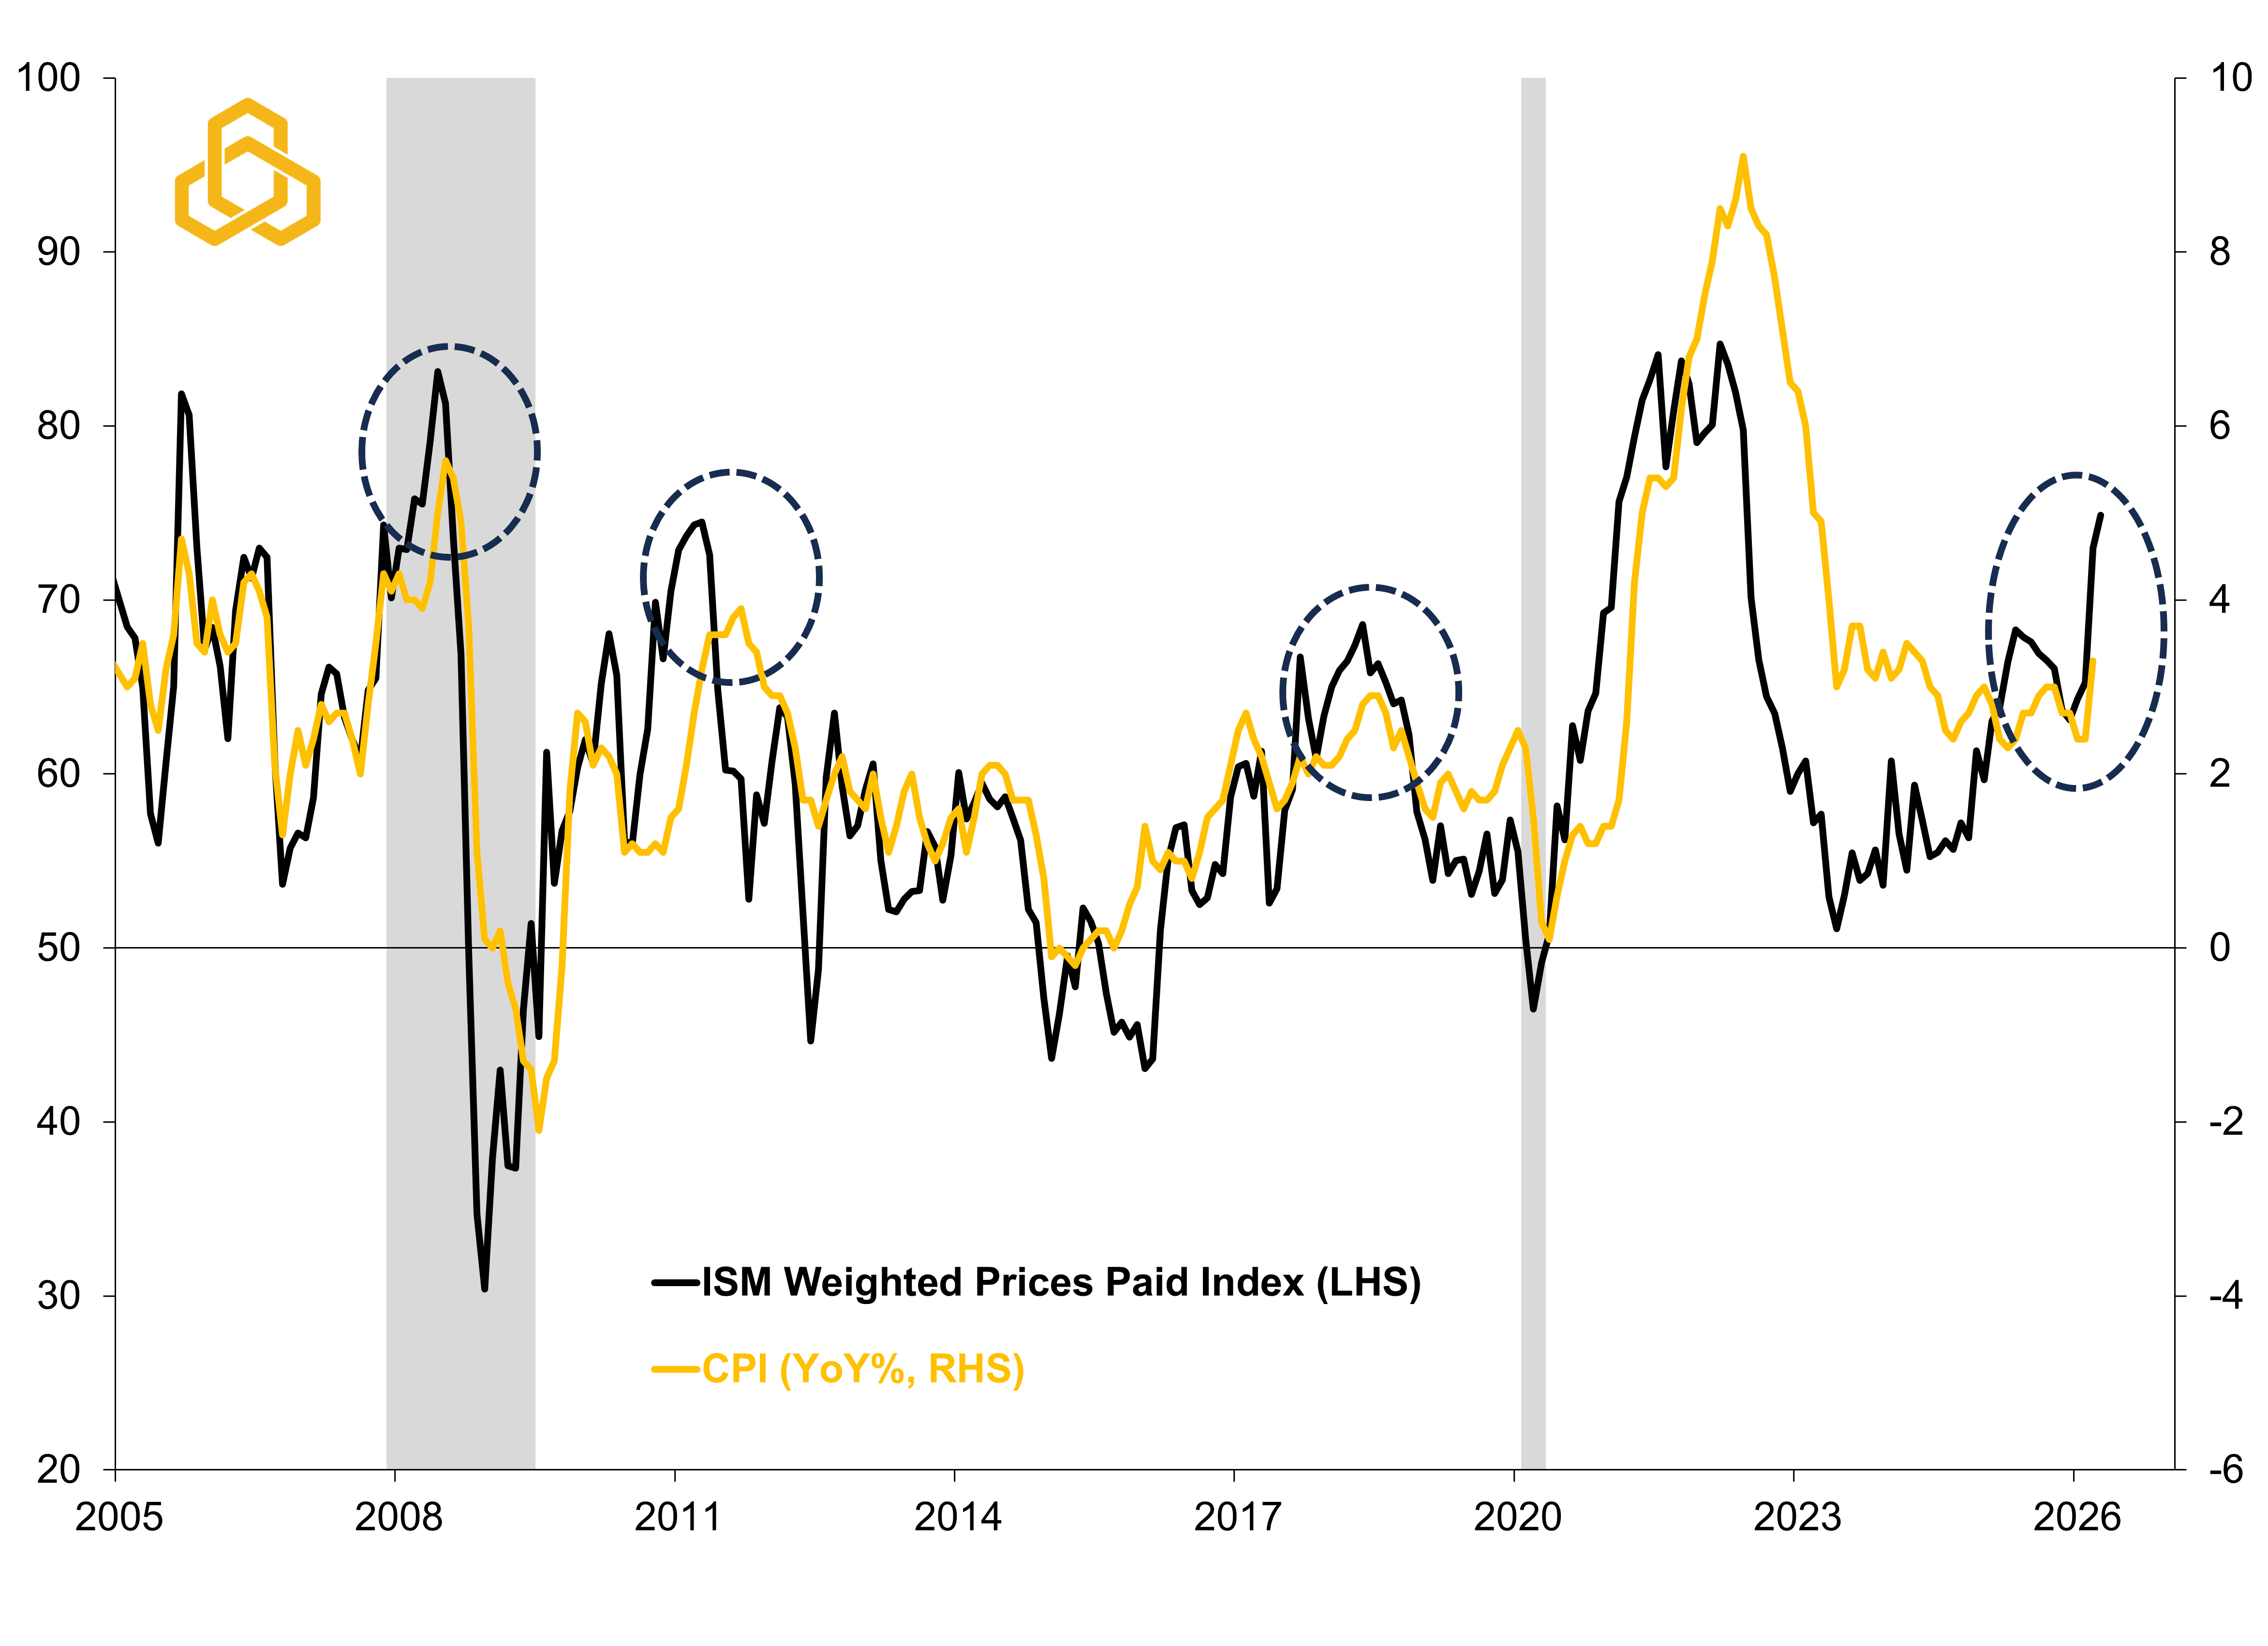
Sources: Institute for Supply Management, Bureau of Economic Analysis, National Bureau of Economic Research, and Potomac. Data as of April 2026 for ISM and March 2026 for CPI. Note 1: The weighted ISM index is 70% services and 30% manufacturing. Note 2: Shaded regions denote periods of U.S. recession.
This is not surprising given that crude oil and gasoline prices have surged roughly 80% and 58%, respectively, since the start of the year. This effectively acts as a tax on the U.S. consumer, offsetting much of the expected tailwind from the One, Big, Beautiful Bill.
It also complicates the outlook for monetary policy, because the Federal Reserve has an official mandate from Congress to aim for price stability in the economy. In the past, the central bank’s mantra has been to look through inflation spikes caused by energy or food, as they were typically viewed as “transitory” shocks that did not reflect the underlying dynamics of the economy. However, the inflation surge during the pandemic appears to have shifted that mindset, with policymakers now more cautious about dismissing early signs of rising inflation.
This dynamic can be seen clearly in the two-year U.S. Treasury yield, which tends to lead actual changes in the federal funds rate. At the start of the year, investors expected at least two additional rate cuts from the Federal Reserve. Today, the market assigns a greater than 50% probability that the Fed could hike rates by this time next year.
Figure 2. Two-Year U.S. Treasury Yield vs the Federal Funds Rate (Upper Bound)
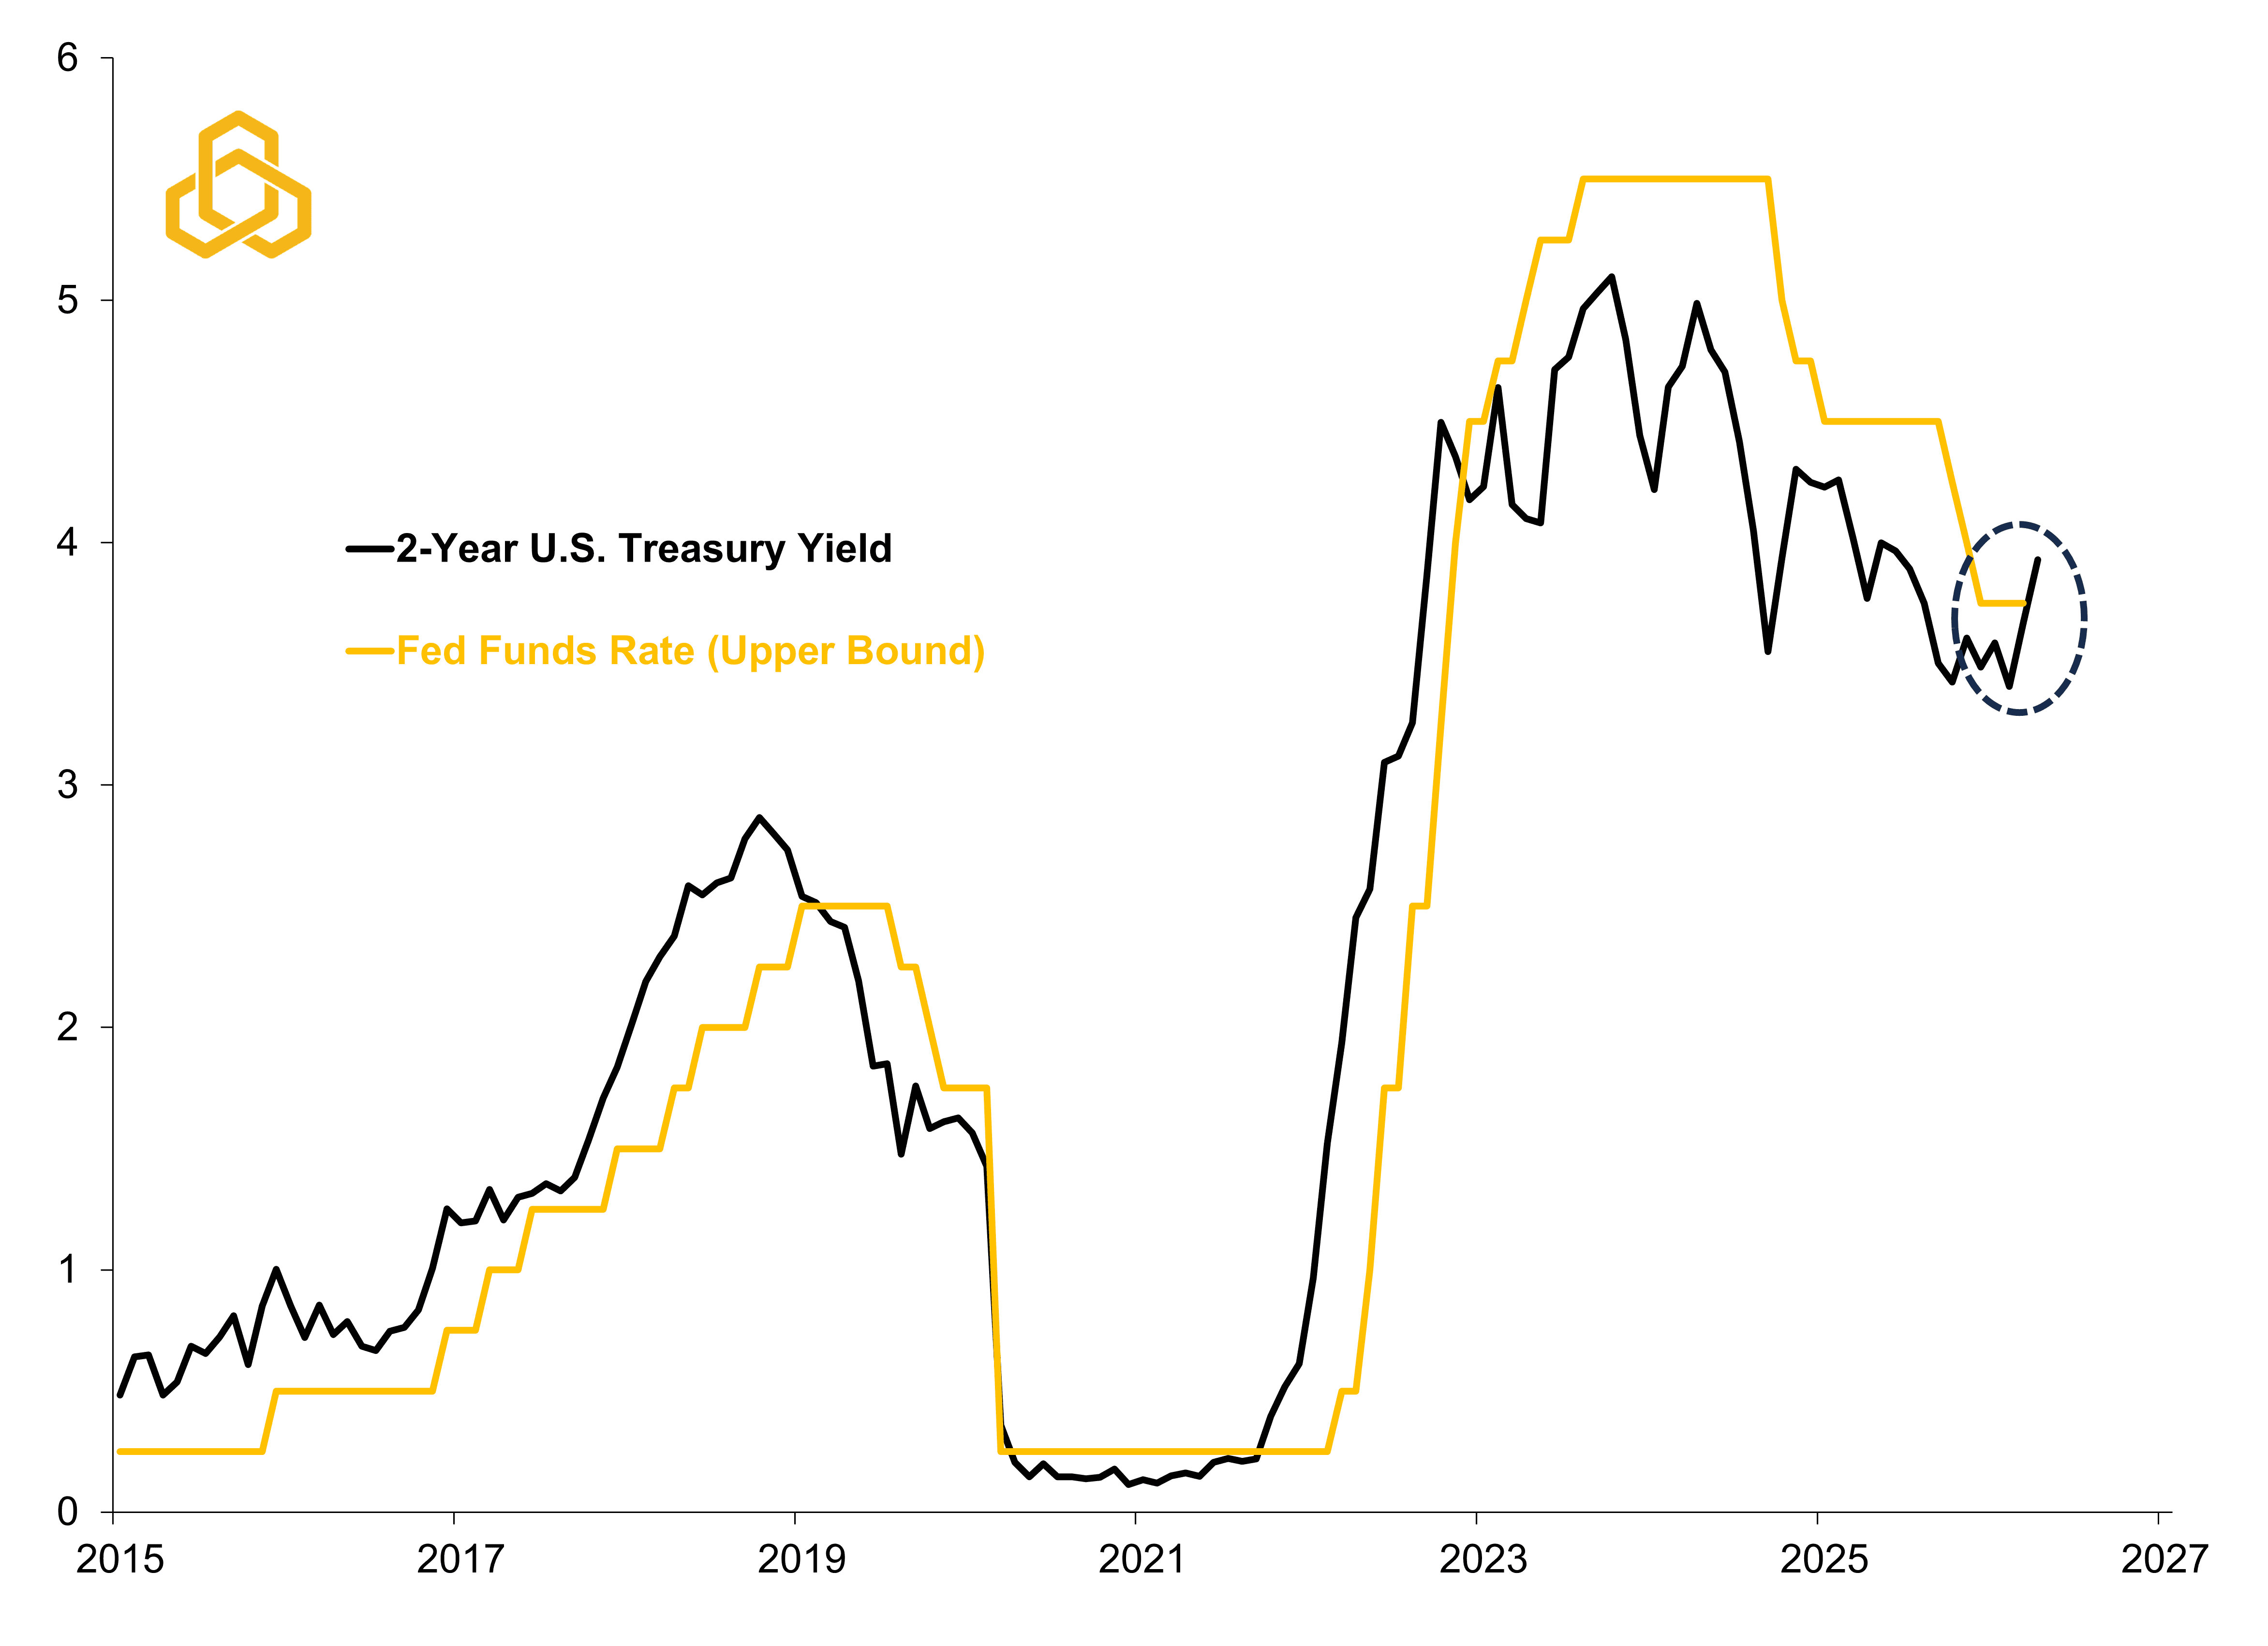
Sources: U.S. Treasury, Federal Reserve Board of Governors, and Potomac. Data as of May 5, 2026 for ISM.
That said, the market gets things wrong, and much will depend on whether rising energy prices eventually push through to core inflation metrics, which would imply that inflation is becoming more rooted in the economy. Thus far, there is little sign of that according to our inflation dashboard. While 60% of the metrics we track are coming in hotter, core inflation gauges and wage measures such as average hourly earnings and the employment cost index were either unchanged or even cooler in March (see figure 3). This is encouraging, but the longer the conflict persists, the less likely this dynamic is to hold.
Figure 3. Potomac’s U.S. Inflation Dashboard (January 2026 to Present)
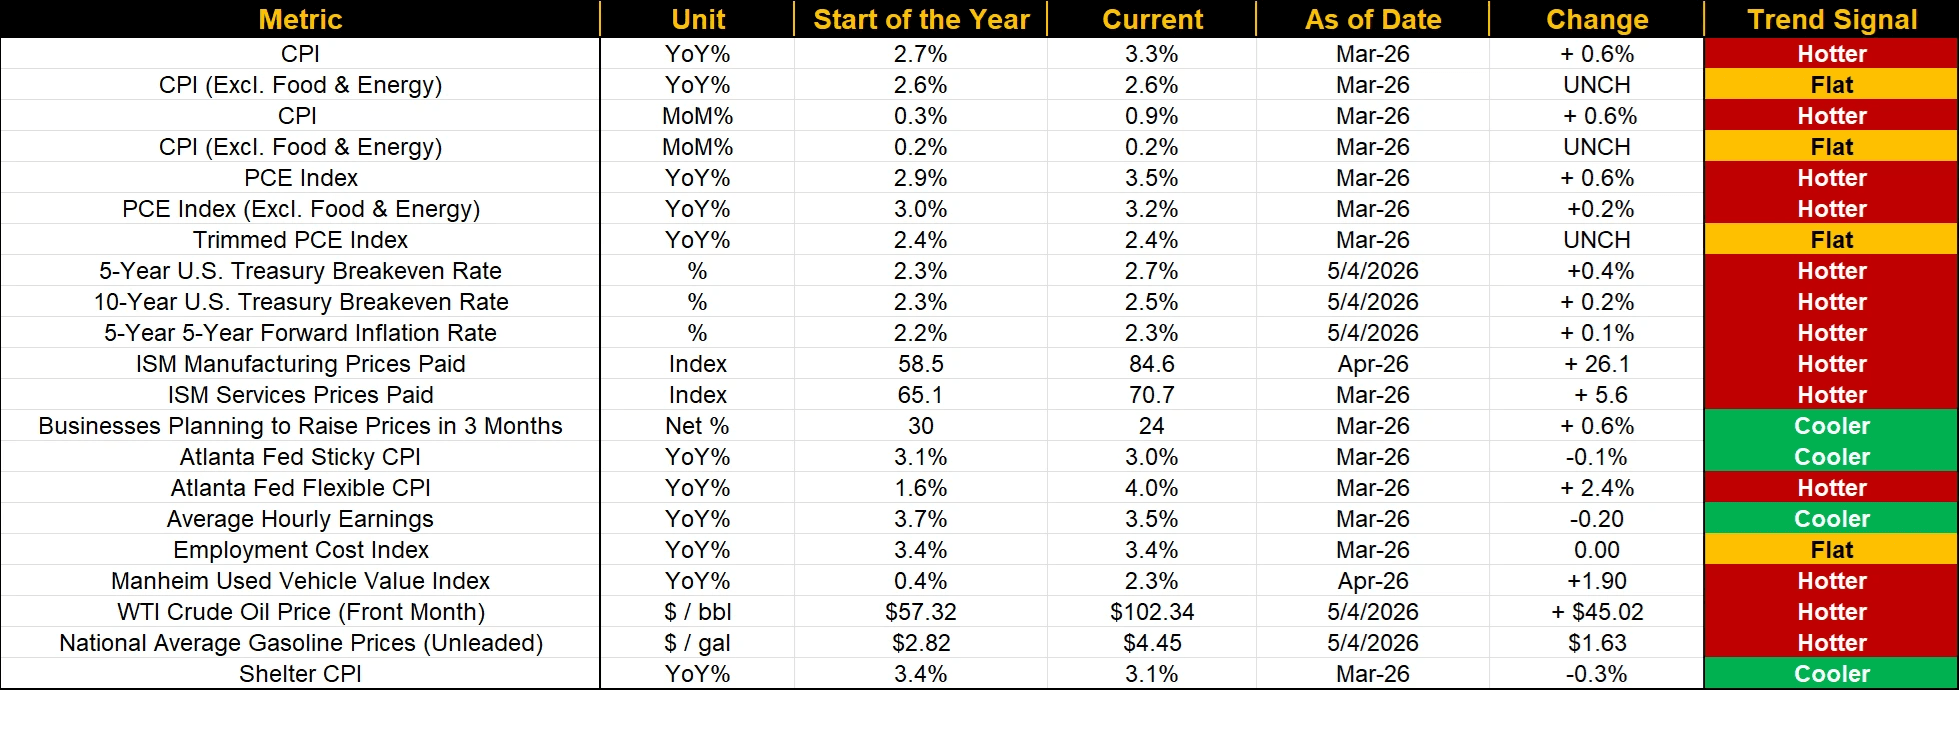
Sources: Bureau of Labor Statistics, Bureau of Economic Analysis, U.S. Treasury, Institute for Supply Management, Federal Reserve Bank of Atlanta, Manhiem, Wall Street Journal, American Automobile Association, and Potomac. Data as of date included in the table.
It may not be fair to view the pandemic as a direct comparison for the current environment, given that supply chain disruptions were far more widespread at that time. However, it does provide a useful illustration of how inflation can evolve. As figure 4 shows, it took nearly a year for sticky price components such as auto insurance, medical care, and housing to follow the path of more flexible prices like commodities.
Figure 4. Atlanta Fed’s Flexible vs. Sticky Consumer Price Indices (YoY%)
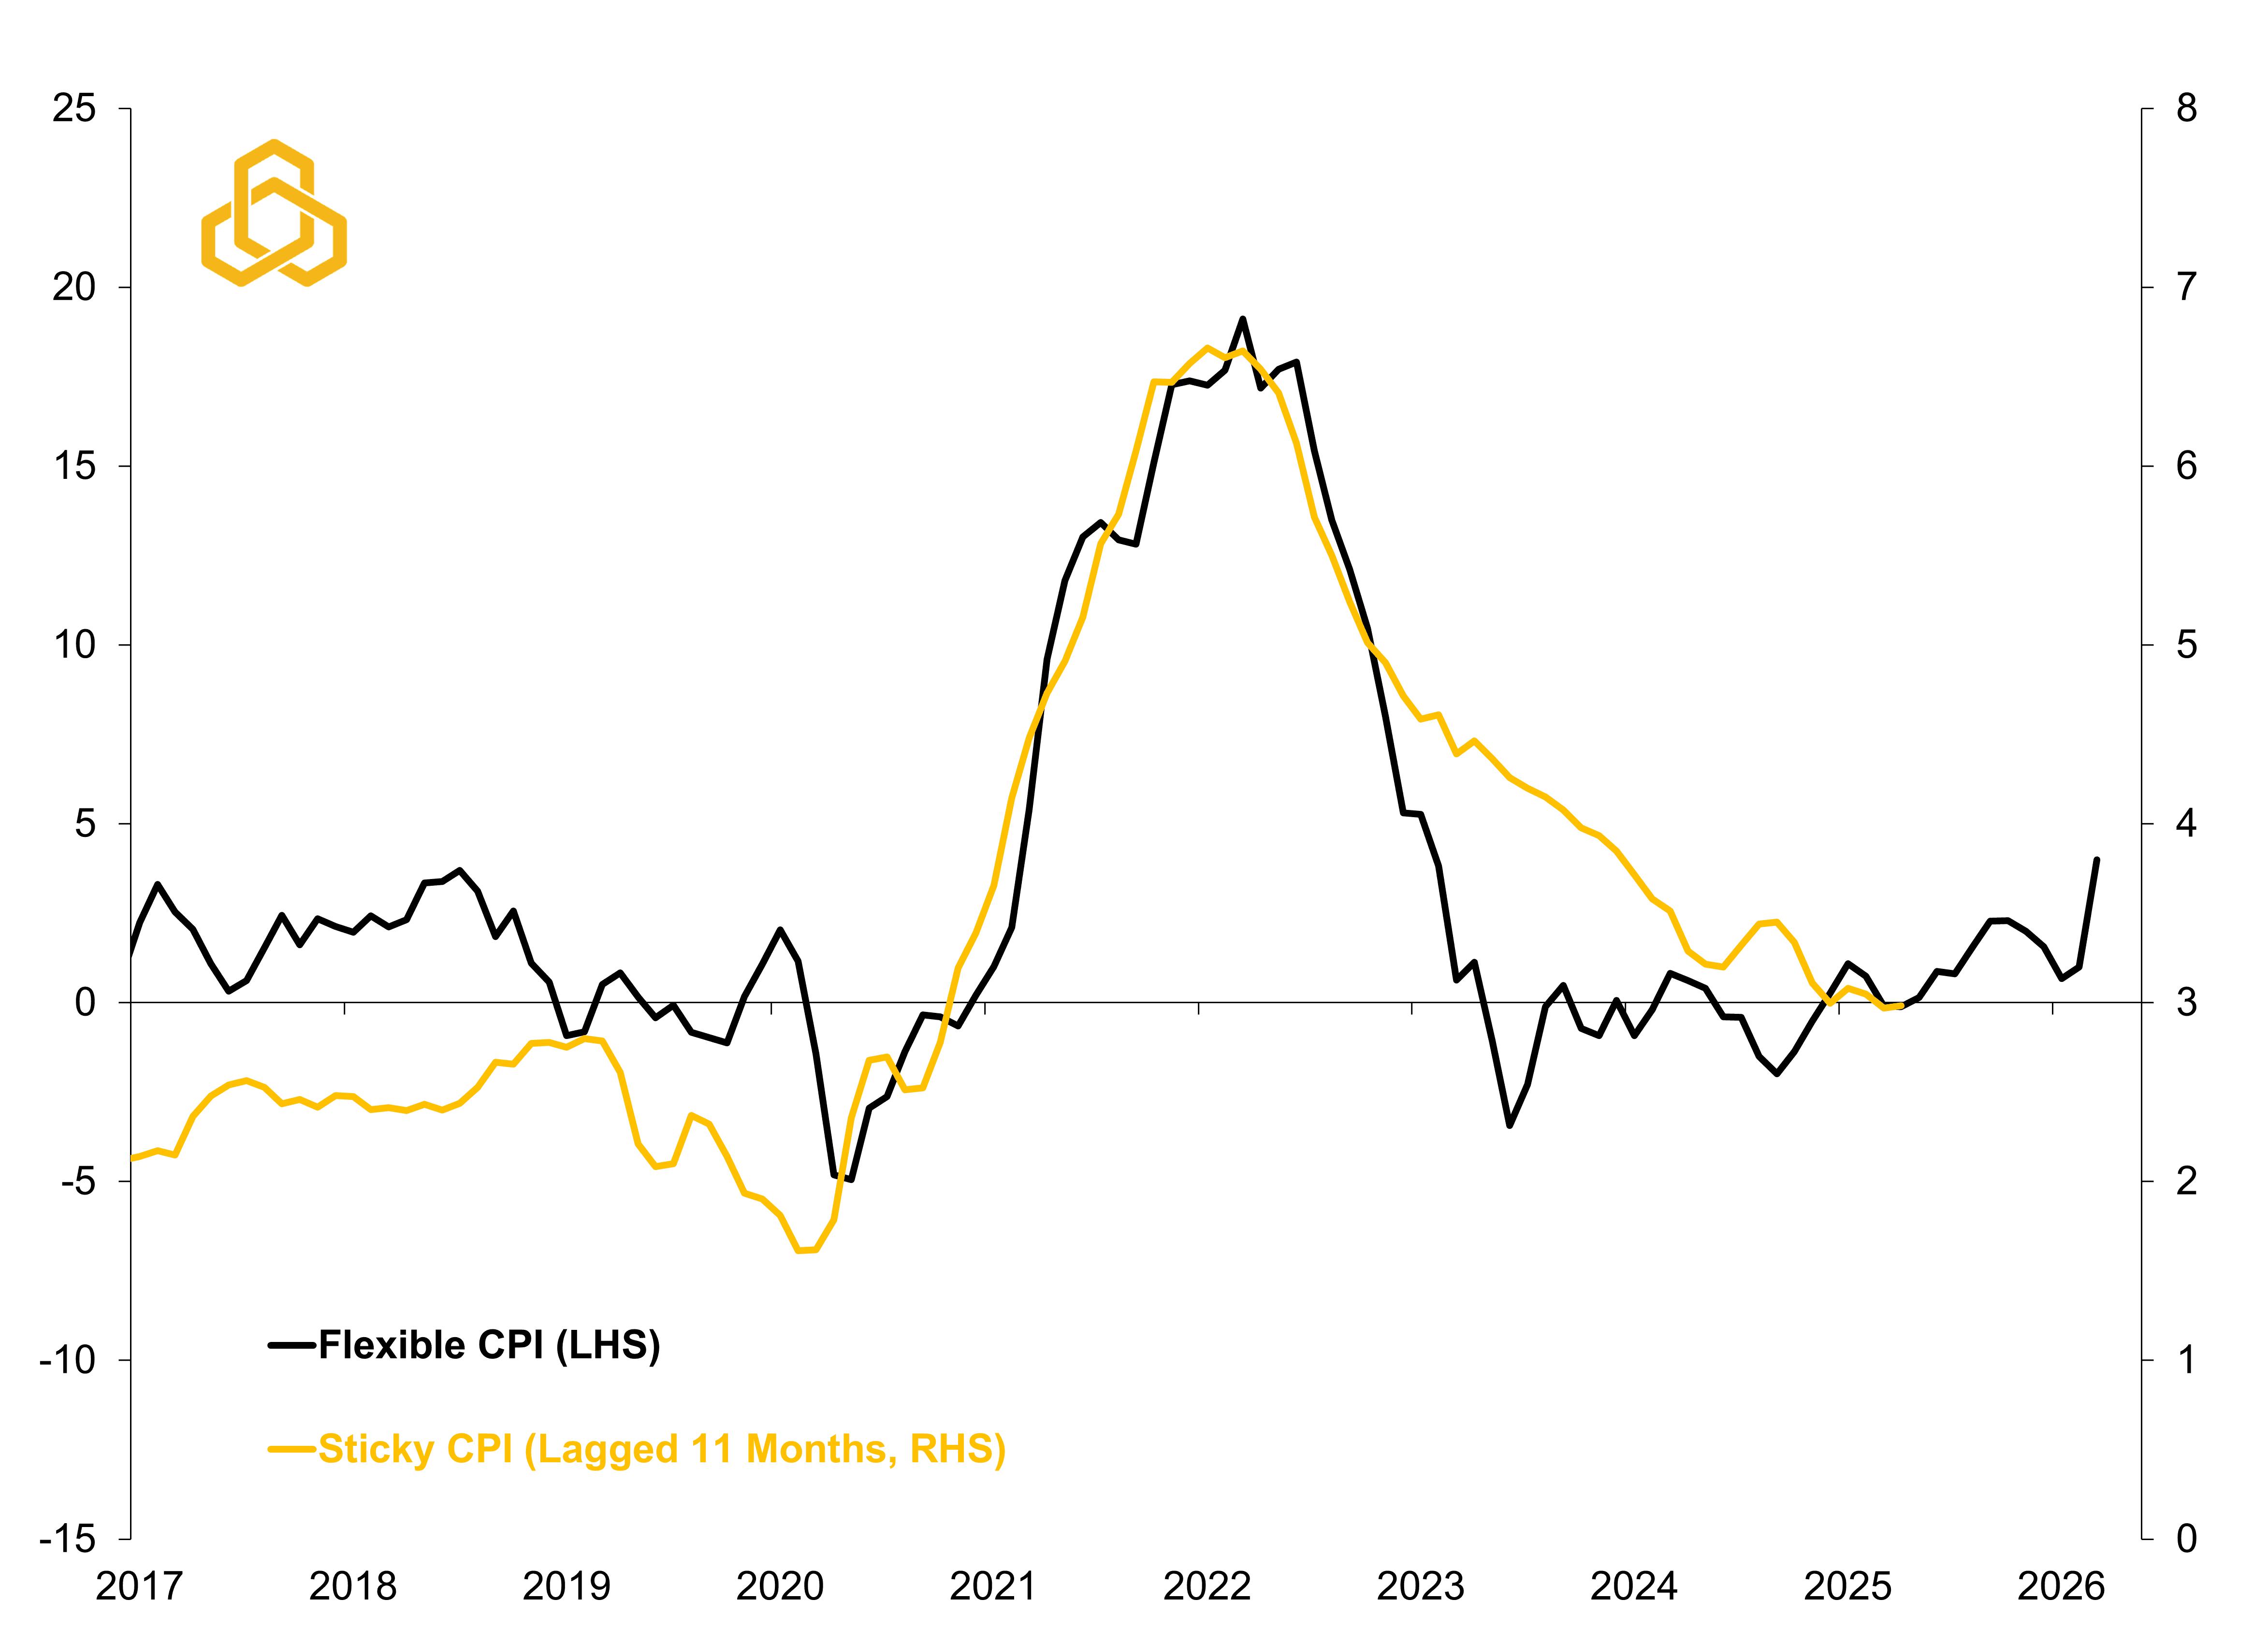
Sources: Federal Reserve Bank of Atlanta and Potomac. Data as of March 2026. For additional insights on the items included in the baskets, please see Are Some Prices in the CPI More Forward Looking than Others? We Think So.
This suggests the recent inflation surge is not yet deeply rooted, and we find it encouraging that small businesses have not signaled a broad acceleration in future price hikes. Some respondents have noted that it is becoming increasingly difficult to pass through higher input costs as customers grow more price conscious (see figure 5). This is something we will continue to monitor closely, as it could serve as one of the earliest signs of a broader inflation passthrough.
Figure 5. NFIB Small Business Pricing Plans vs. the Consumer Price Index
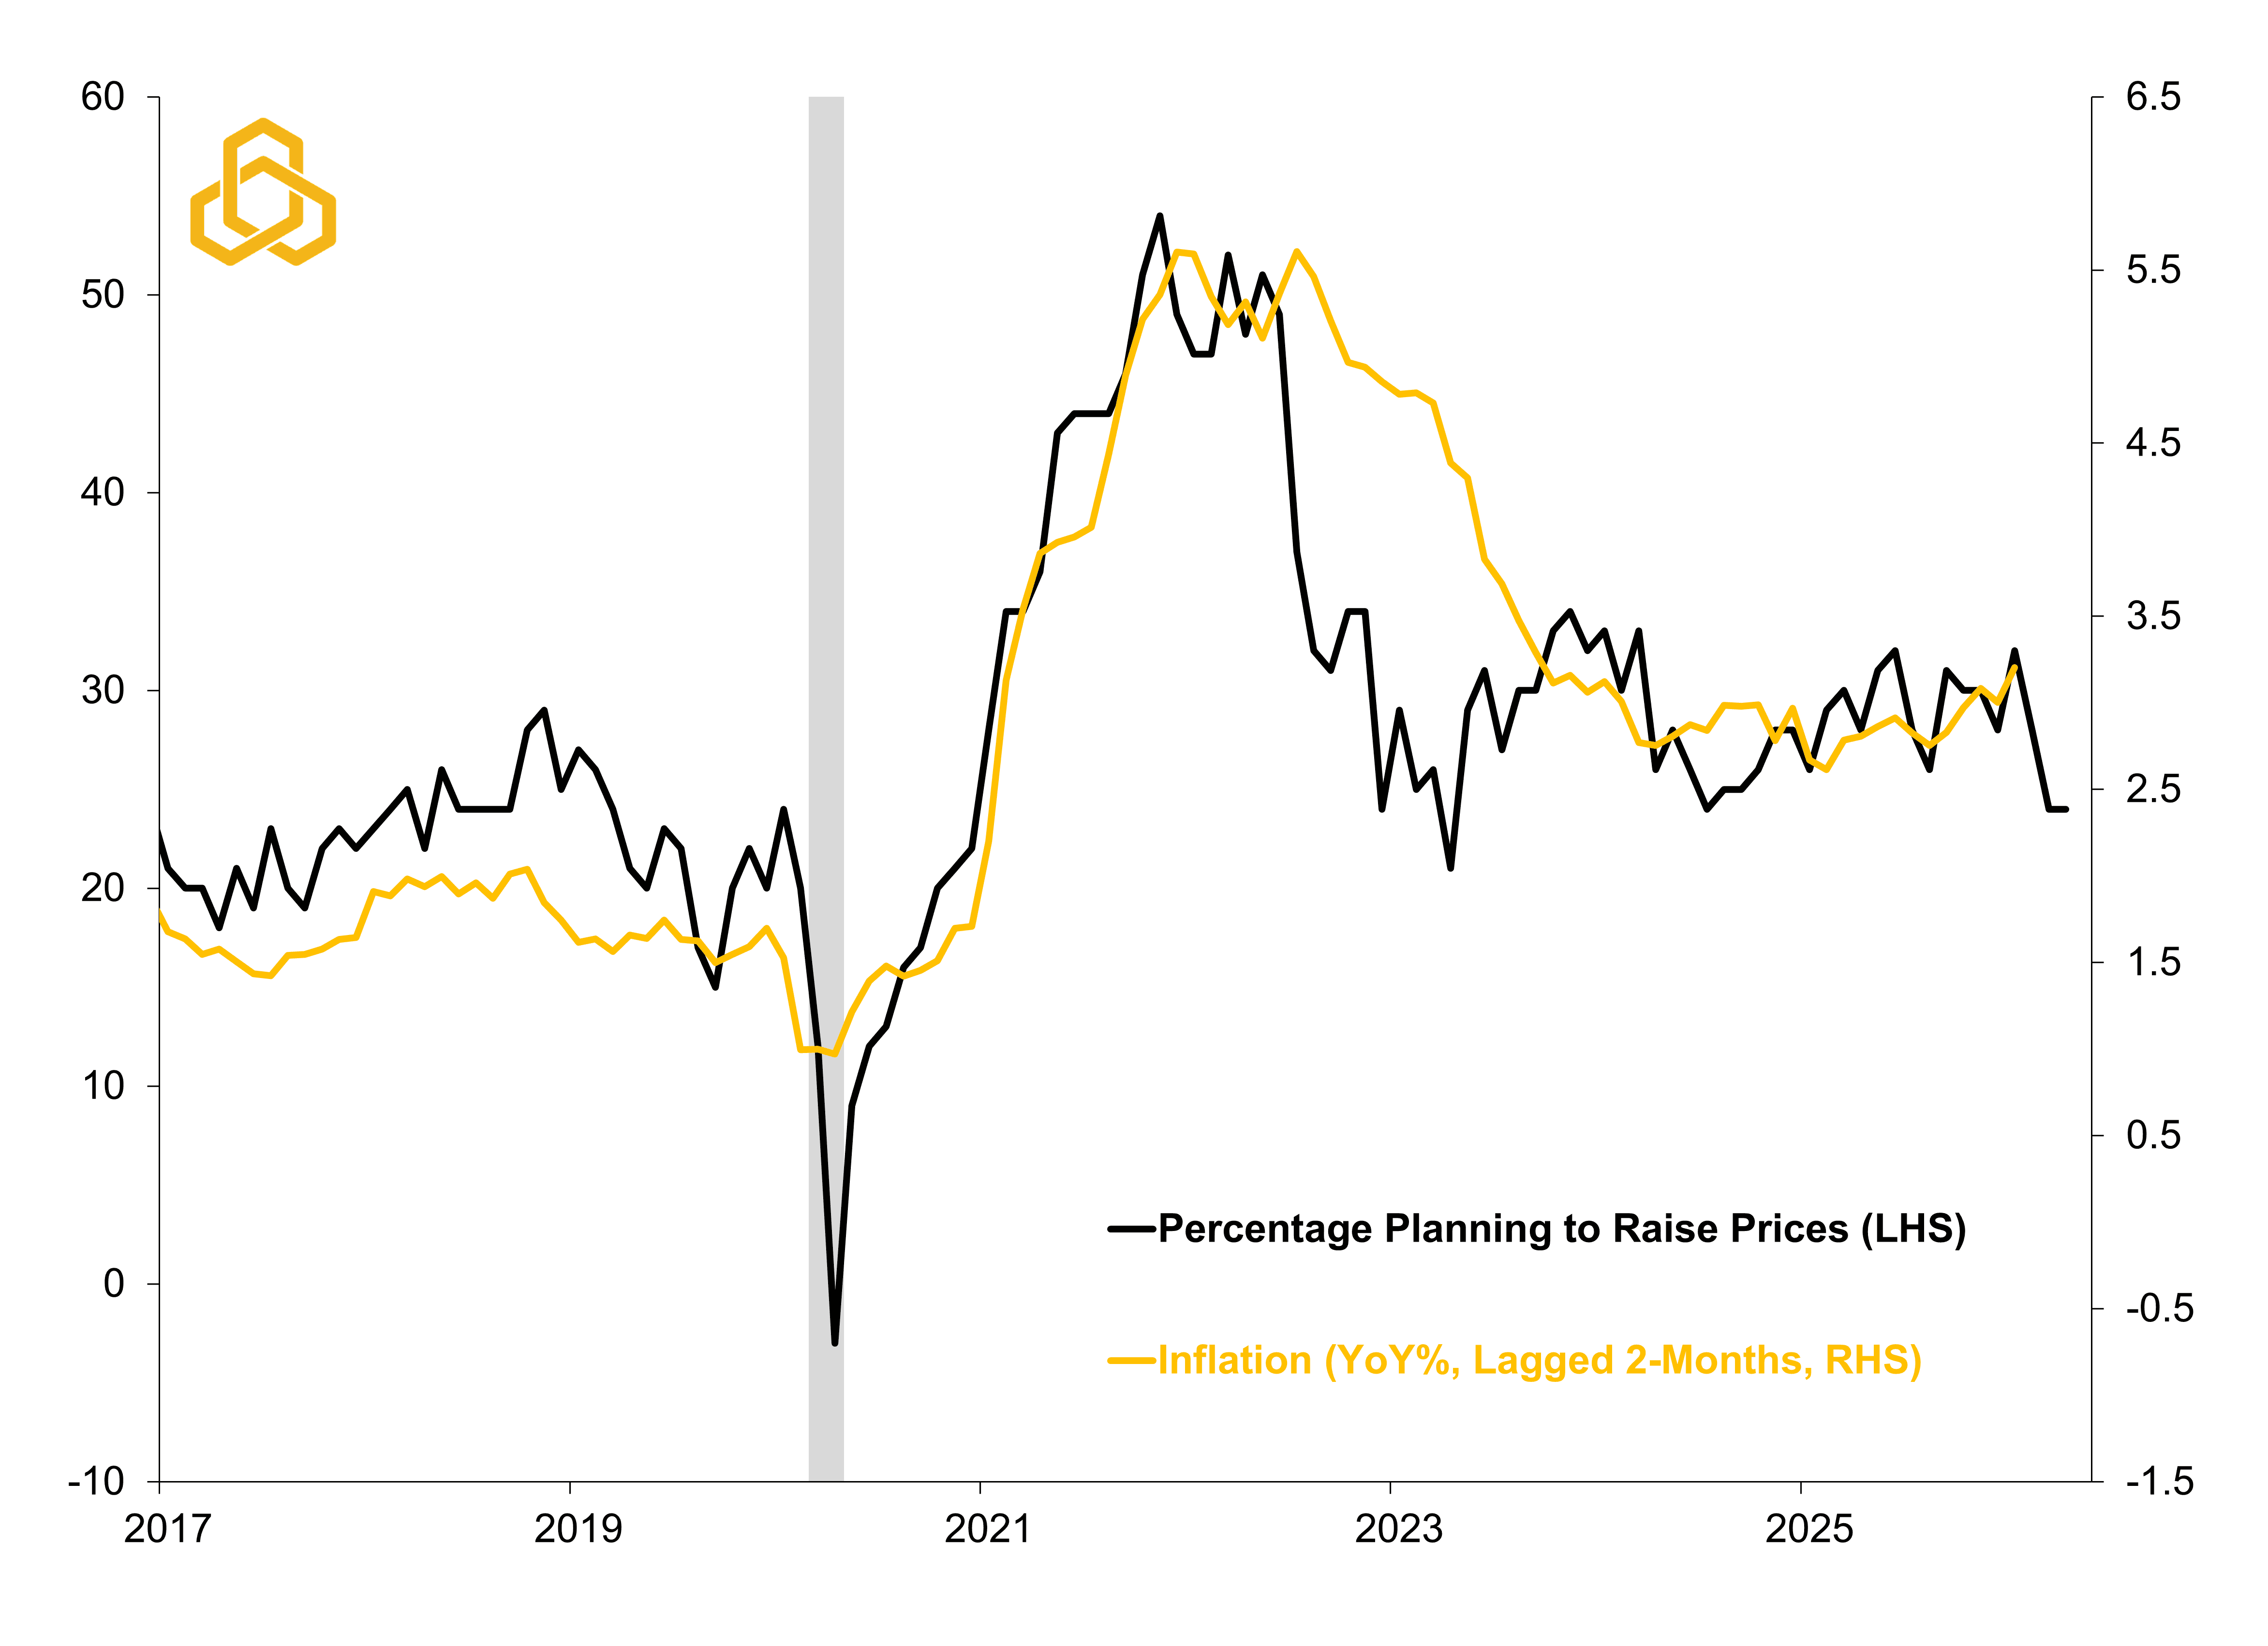
Sources: National Federation of Independent Business, Bureau of Labor Statistics, and Potomac. Data as of March 2026. Note: Shaded regions denote periods of U.S. recession.
We do not know exactly where inflation goes from here, but if it becomes more rooted, the risk is that traditional correlations begin to break down and bonds may not provide the same level of protection investors have come to expect. This is not a call for a repeat of 2022, but even a smaller version of that dynamic would have meaningful implications for portfolios. Please see our Bear Market in Diversification piece for additional insights.
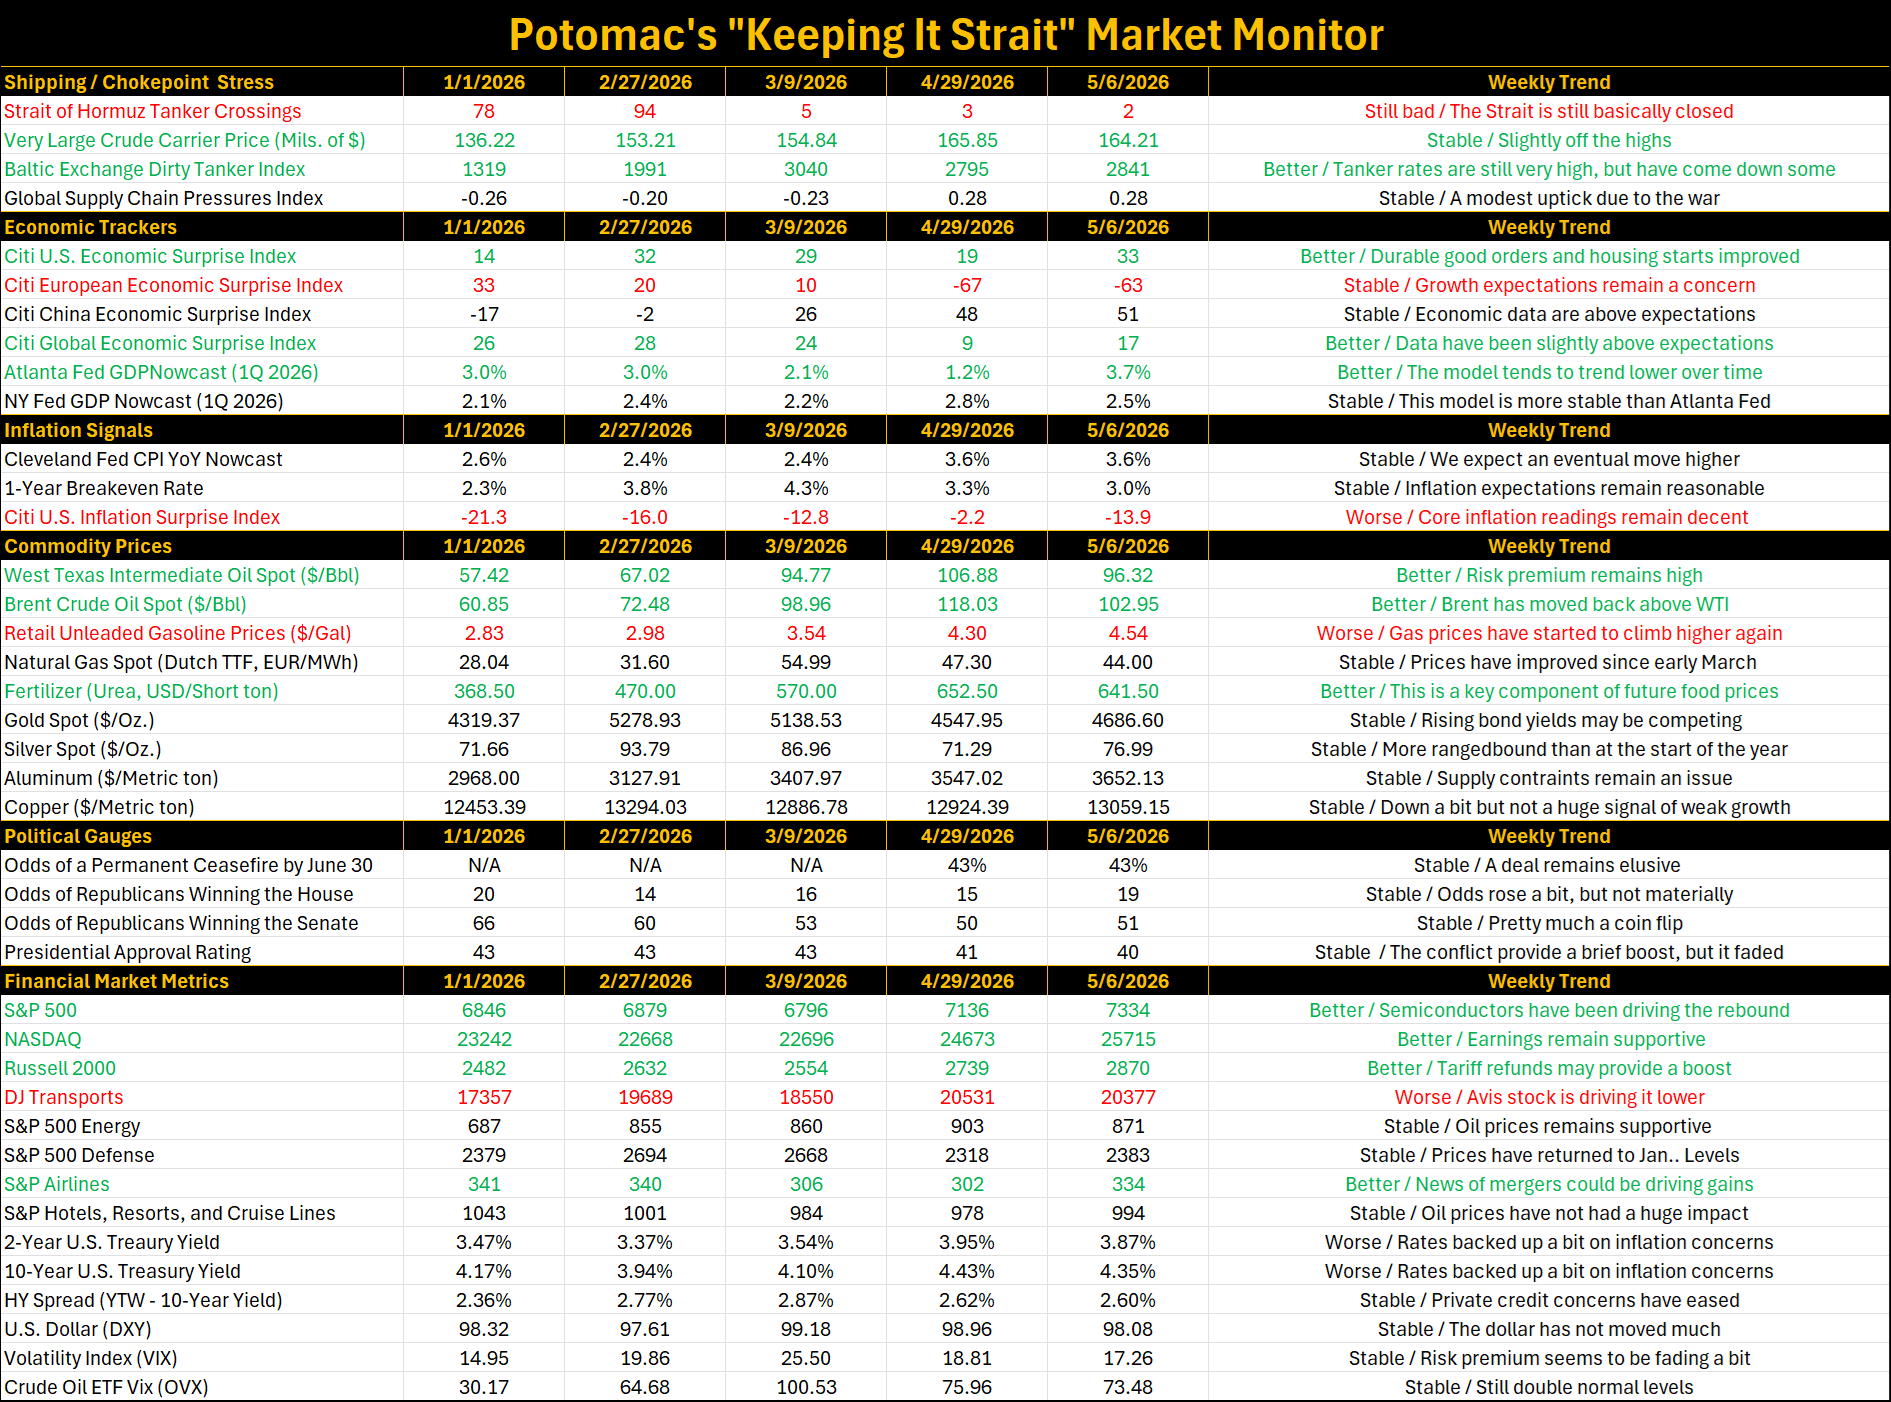
Weekly “Keeping it Strait” Highlights:
The Strait of Hormuz remains closed. According to Polymarket, the odds of a permanent ceasefire by June 30 stand at 43%.
The U.S. economic surprise index improved during the week to 32. Durable goods orders and housing starts both beat expectations. The economy is still showing signs of resilience.
Retail gasoline prices have been climbing higher with the national average now at $4.48. This could weigh on activity with the summer driving season approaching.
The U.S. stock market continues to push higher with semiconductors and corporate earnings helping investors to fade geopolitical risks.