
Nearly every investor knows the names of the Magnificent Seven. We use their products almost every day. But far fewer investors know which economic reports are worth watching, or why they matter.
Every week brings another wave of economic data, but with so much information available, it's easy to get lost in the headlines. The good news is that you don't need to follow every report (we do, so you don't have to). Understanding a handful of key releases can provide a solid foundation for interpreting the economy and, more importantly, understanding why financial markets react the way they do.
Here are five of the most important.
The Employment Report (Nonfarm Payrolls)
Released on the first Friday of most months, the Employment Report is often considered the single most important economic release on the calendar.
The report tells investors how many jobs were created or lost during the previous month, while also providing updates on the unemployment rate, wage growth, hours worked, and labor force participation.
A healthy labor market is important because it supports consumer spending, which accounts for roughly two-thirds of the U.S. economy. Think of the Employment Report as a monthly check-up on the health of the economy.
That said, one month rarely makes a trend. Monthly payroll gains can be volatile, which is why economists and the Federal Reserve often focus on the three-month moving average. Looking at several months together provides a clearer picture of whether the labor market is strengthening, weakening, or simply experiencing normal month-to-month fluctuations.
Another important part of the report is wage growth. If wages rise too quickly, businesses often pass those higher labor costs on to consumers in the form of higher prices, adding to inflationary pressures. That's why a strong jobs report isn't always bullish for stocks. If the labor market is running too hot, investors may worry that the Federal Reserve will need to keep interest rates higher for longer, or even raise them.
Remember, the Federal Reserve has a dual mandate: to promote maximum employment and maintain price stability. The Employment Report provides important clues about both.
Monthly Change in Nonfarm Payrolls Between 2024 and June 2026 (Thous.)
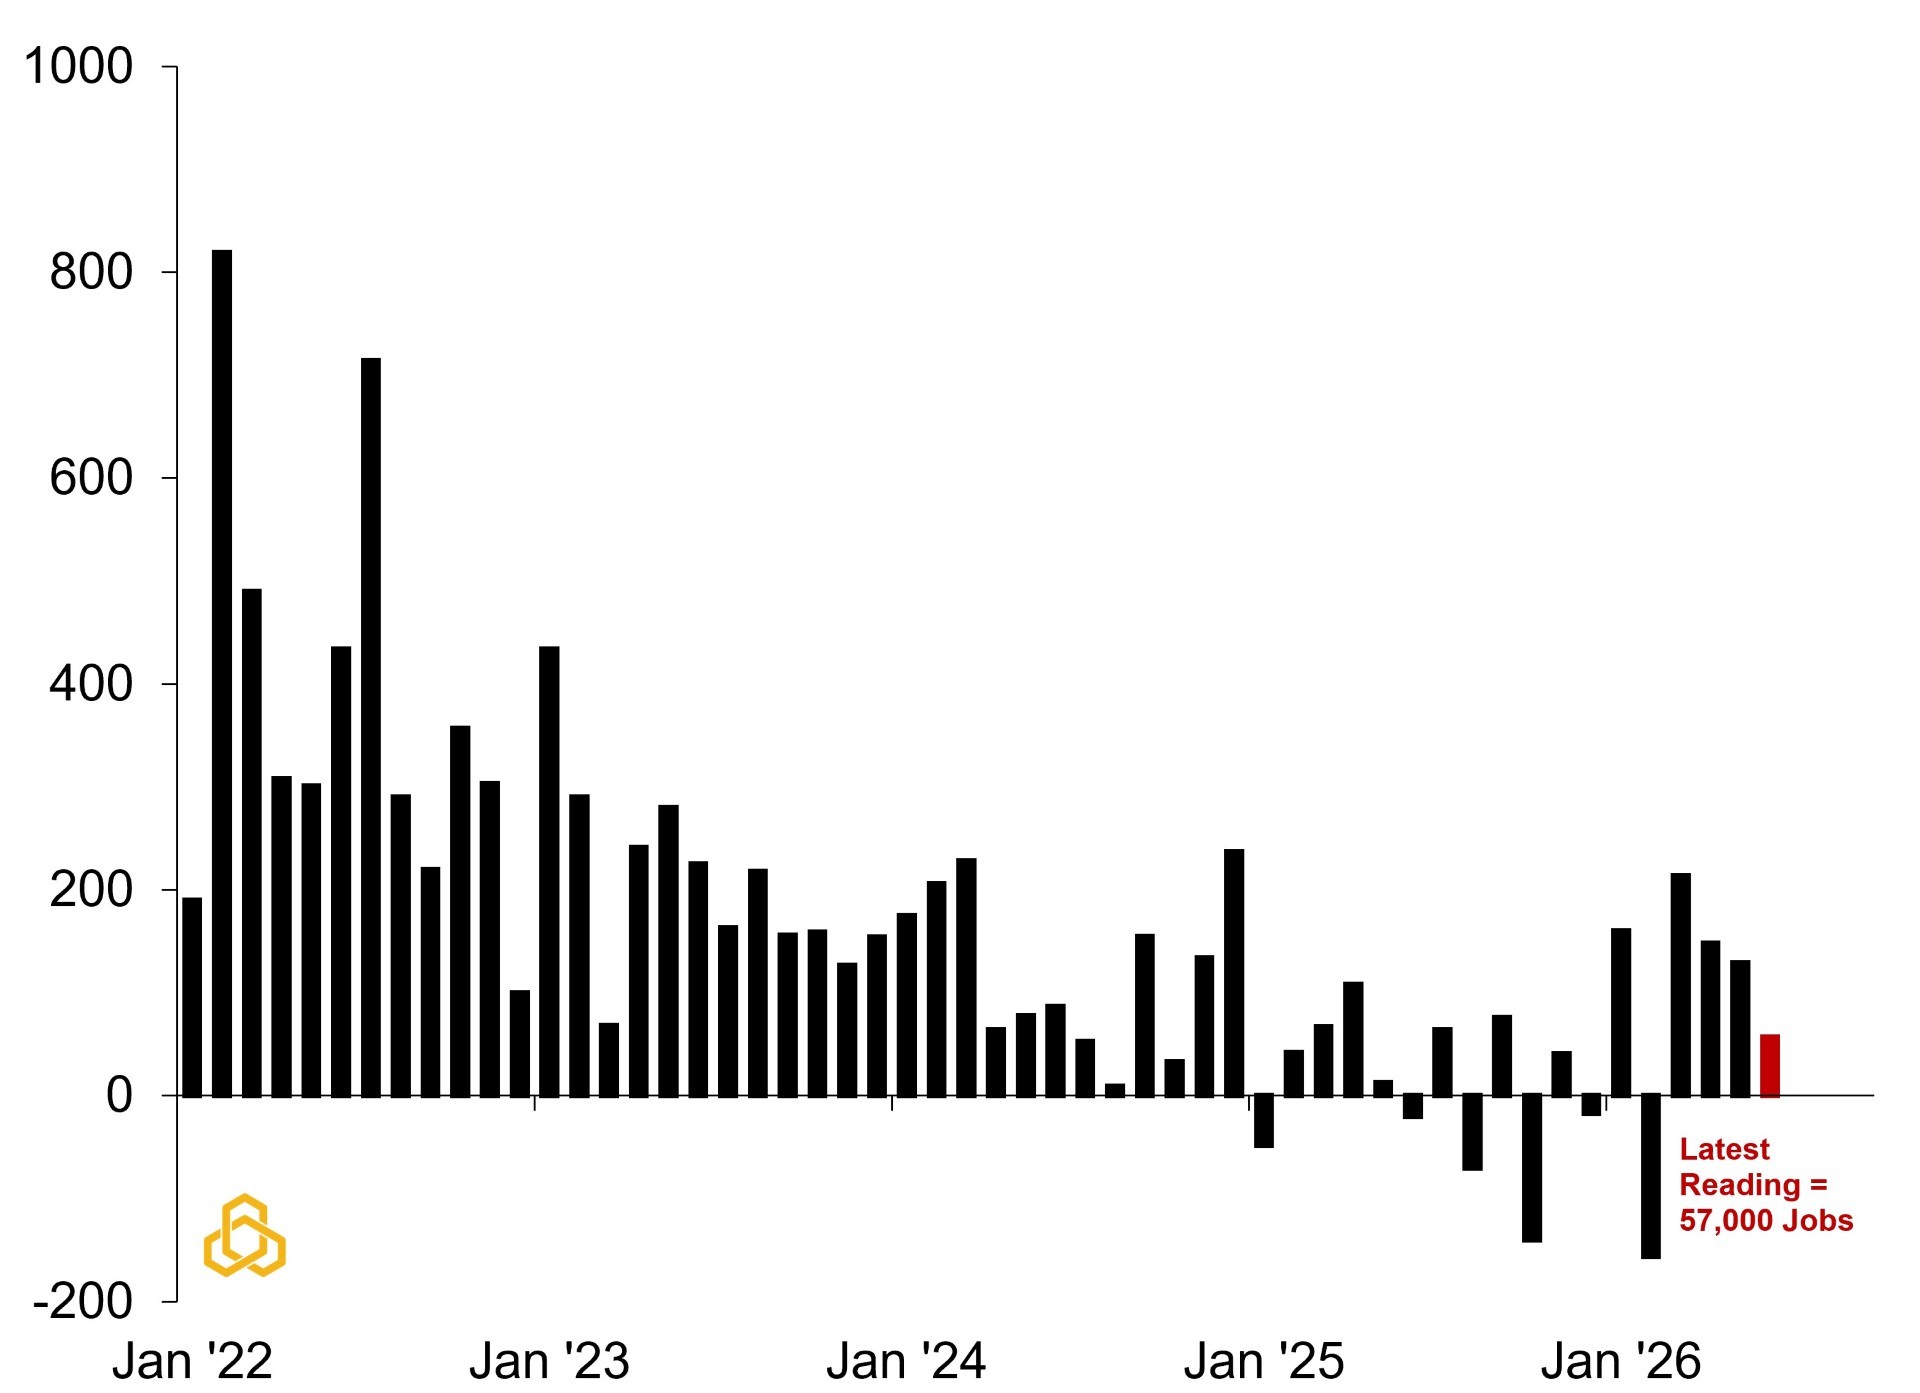
Sources: Bureau of Labor Statistics, Bloomberg L.P., and Potomac. Data as of June 2026.
The Consumer Price Index (CPI)
The Consumer Price Index, better known as CPI, measures changes in the prices consumers pay for a broad basket of goods and services. It is the most widely followed measure of inflation.
While inflation tends to dominate financial headlines, investors generally care less about where inflation is today than where it is headed. The key question for both investors and the Federal Reserve is whether inflation is accelerating, decelerating, or remaining stubbornly above the Fed's 2% target.
The answer often shapes expectations for monetary policy. Accelerating inflation can increase the likelihood of higher interest rates, while slowing inflation gives the Federal Reserve more flexibility to cut rates, as it did in 2024.
Another closely watched measure is core inflation, which excludes the more volatile food and energy categories. While headline inflation better reflects what consumers experience every day, core inflation often provides a clearer picture of underlying inflation trends because it filters out short-term swings in commodity prices.
Because interest rates influence everything from mortgage rates and bond yields to stock valuations, CPI has become one of the most closely watched economic reports in financial markets.
Headline Consumer Price Index (Year-on-Year Percent Change)

Sources: Bureau of Labor Statistics, Bloomberg L.P., and Potomac. Data as of June 2026.
Initial Jobless Claims
The Employment Report is released once a month, but Initial Jobless Claims are published every Thursday, making them one of the timeliest reports available.
The report measures how many people filed for unemployment benefits for the first time during the previous week. Because workers often file for benefits shortly after losing their jobs, claims provide one of the earliest and most reliable reads on the health of the labor market.
They are also one of the best leading economic indicators available to investors. Unlike the Employment Report, which is generally viewed as a coincident indicator because it describes the current state of the labor market, Initial Jobless Claims often begin rising before the economy falls into recession, making them an official leading economic indicator.
In fact, sustained increases in claims of more than 20% on a year-over-year basis have historically been a reliable warning sign that the U.S. economy is entering or is already in a recession.
If we could follow just one economic report to assess recession risk, it would be Initial Jobless Claims.
Initial Jobless Claims (Year-on-Year Percent Change) vs. Periods of Recession
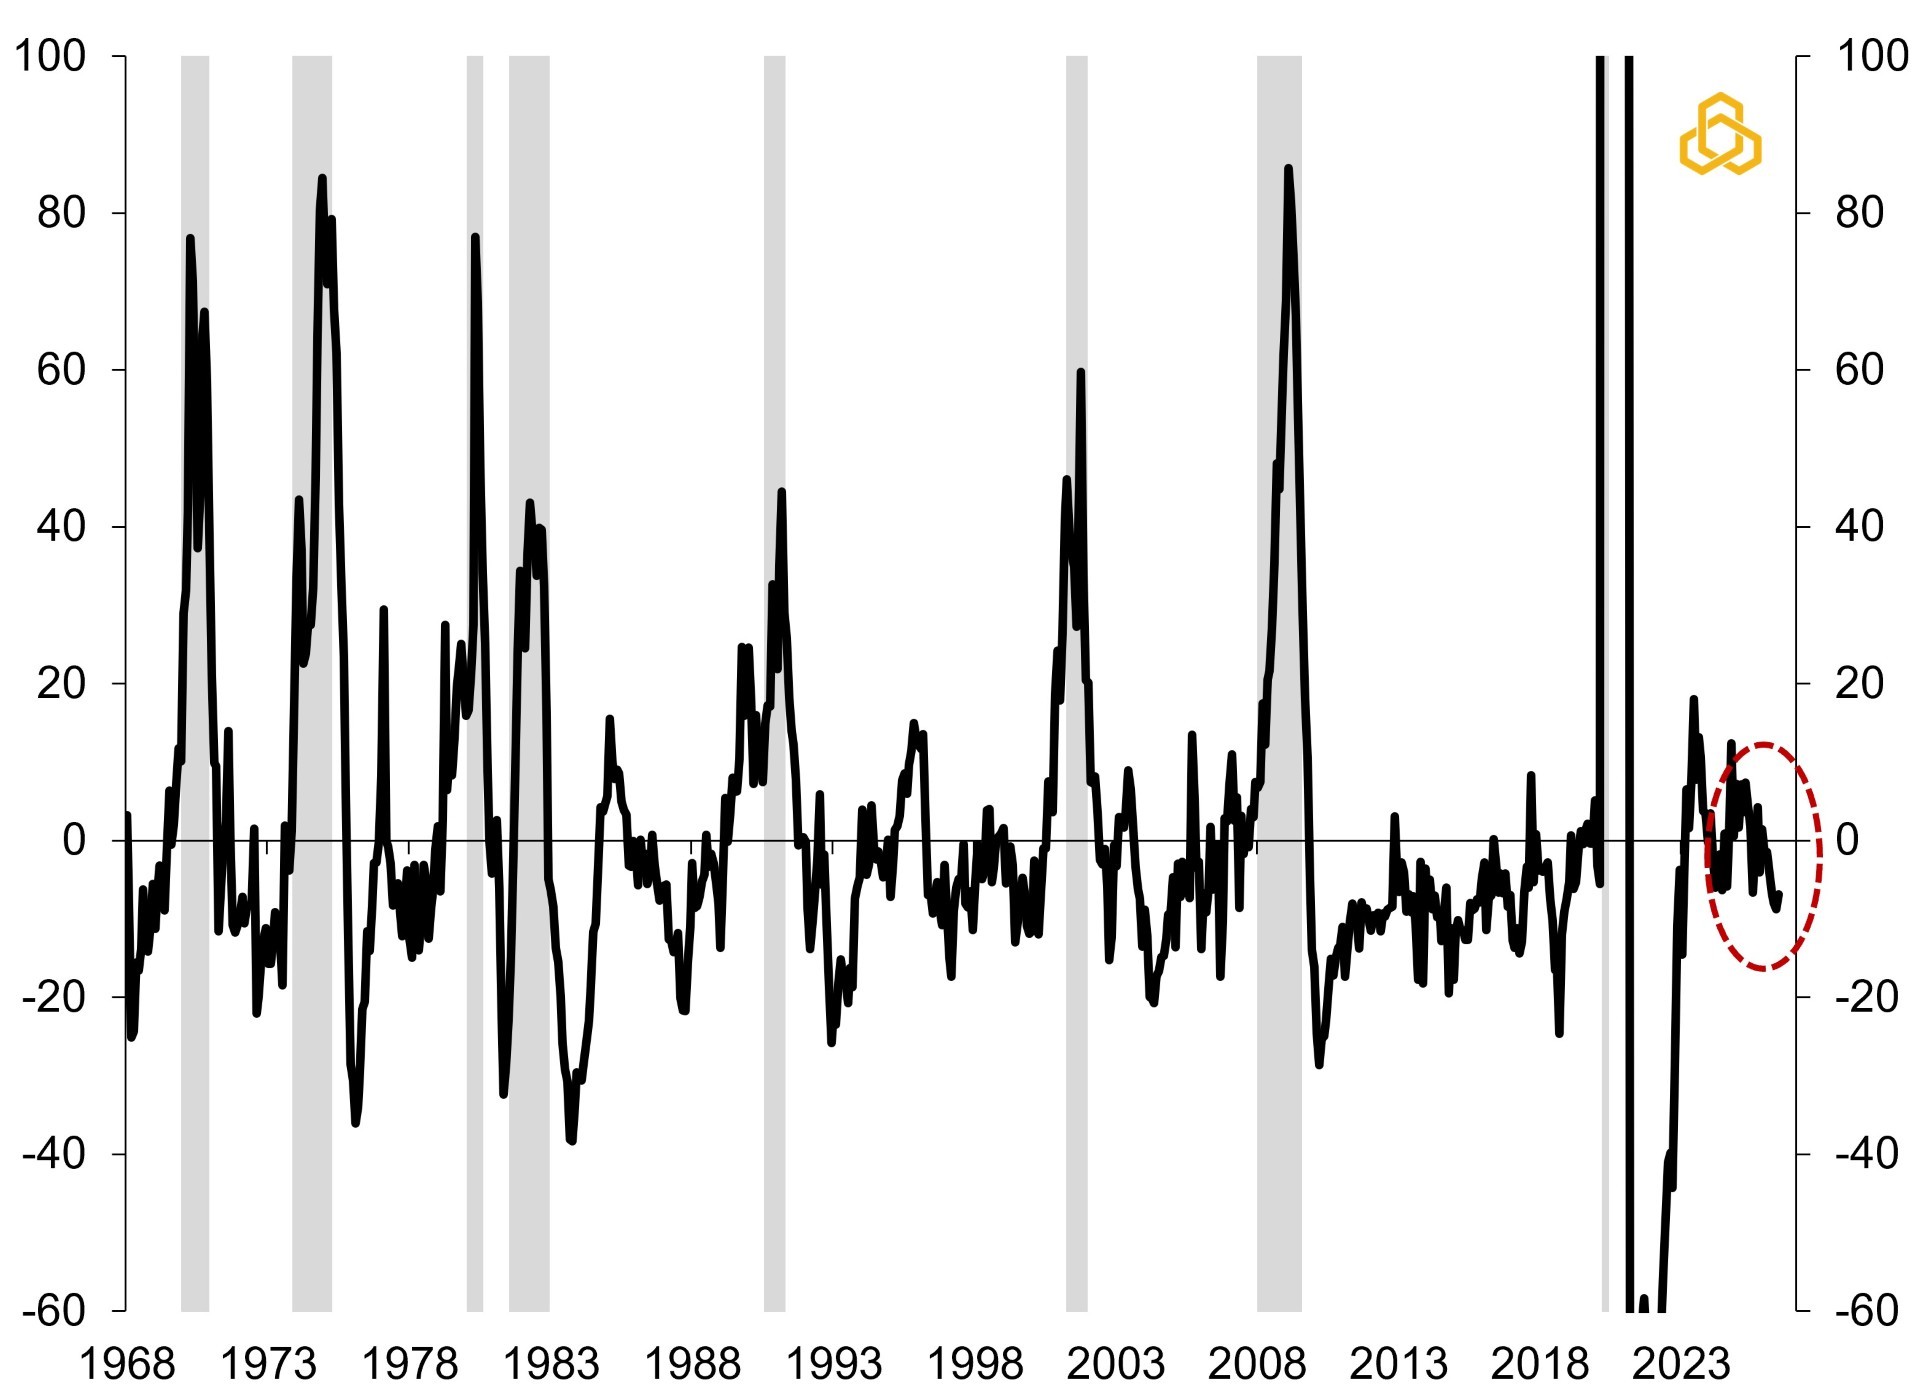
Sources: Bureau of Labor Statistics, Bloomberg L.P., and Potomac. Data as of June 2026.
ISM Manufacturing Index (PMI)
The Institute for Supply Management (ISM) surveys about 400 purchasing and supply executives across roughly 20 manufacturing industries and 18 service industries each month. The panel is weighted by each industry's contribution to gross domestic product (GDP). Because purchasing managers are responsible for sourcing materials and inputs, they are often among the first people inside a company to notice changes in orders, hiring plans, inventories, and input prices.
While the services sector accounts for nearly three-quarters of U.S. economic activity, manufacturing has historically been one of the first sectors to respond to changes in the business cycle. For that reason, the New Orders component of the Manufacturing PMI is also one of the ten official components of The Conference Board's Leading Economic Index (LEI).
Investors also look beyond the headline PMI and focus on components such as New Orders, Employment, and Prices Paid. Together, they provide valuable clues about where economic growth and inflation may be headed over the coming months. As a general rule, a reading above 50 indicates expansion, while a reading below 50 signals contraction.
Combined, these measures often capture changes in business activity before they appear in more traditional "hard" economic data, such as the Employment Report or Gross Domestic Product. That is what makes the ISM surveys some of the most valuable leading economic reports available to investors.
Real Gross Domestic Product vs. Weighted ISM New Orders Index
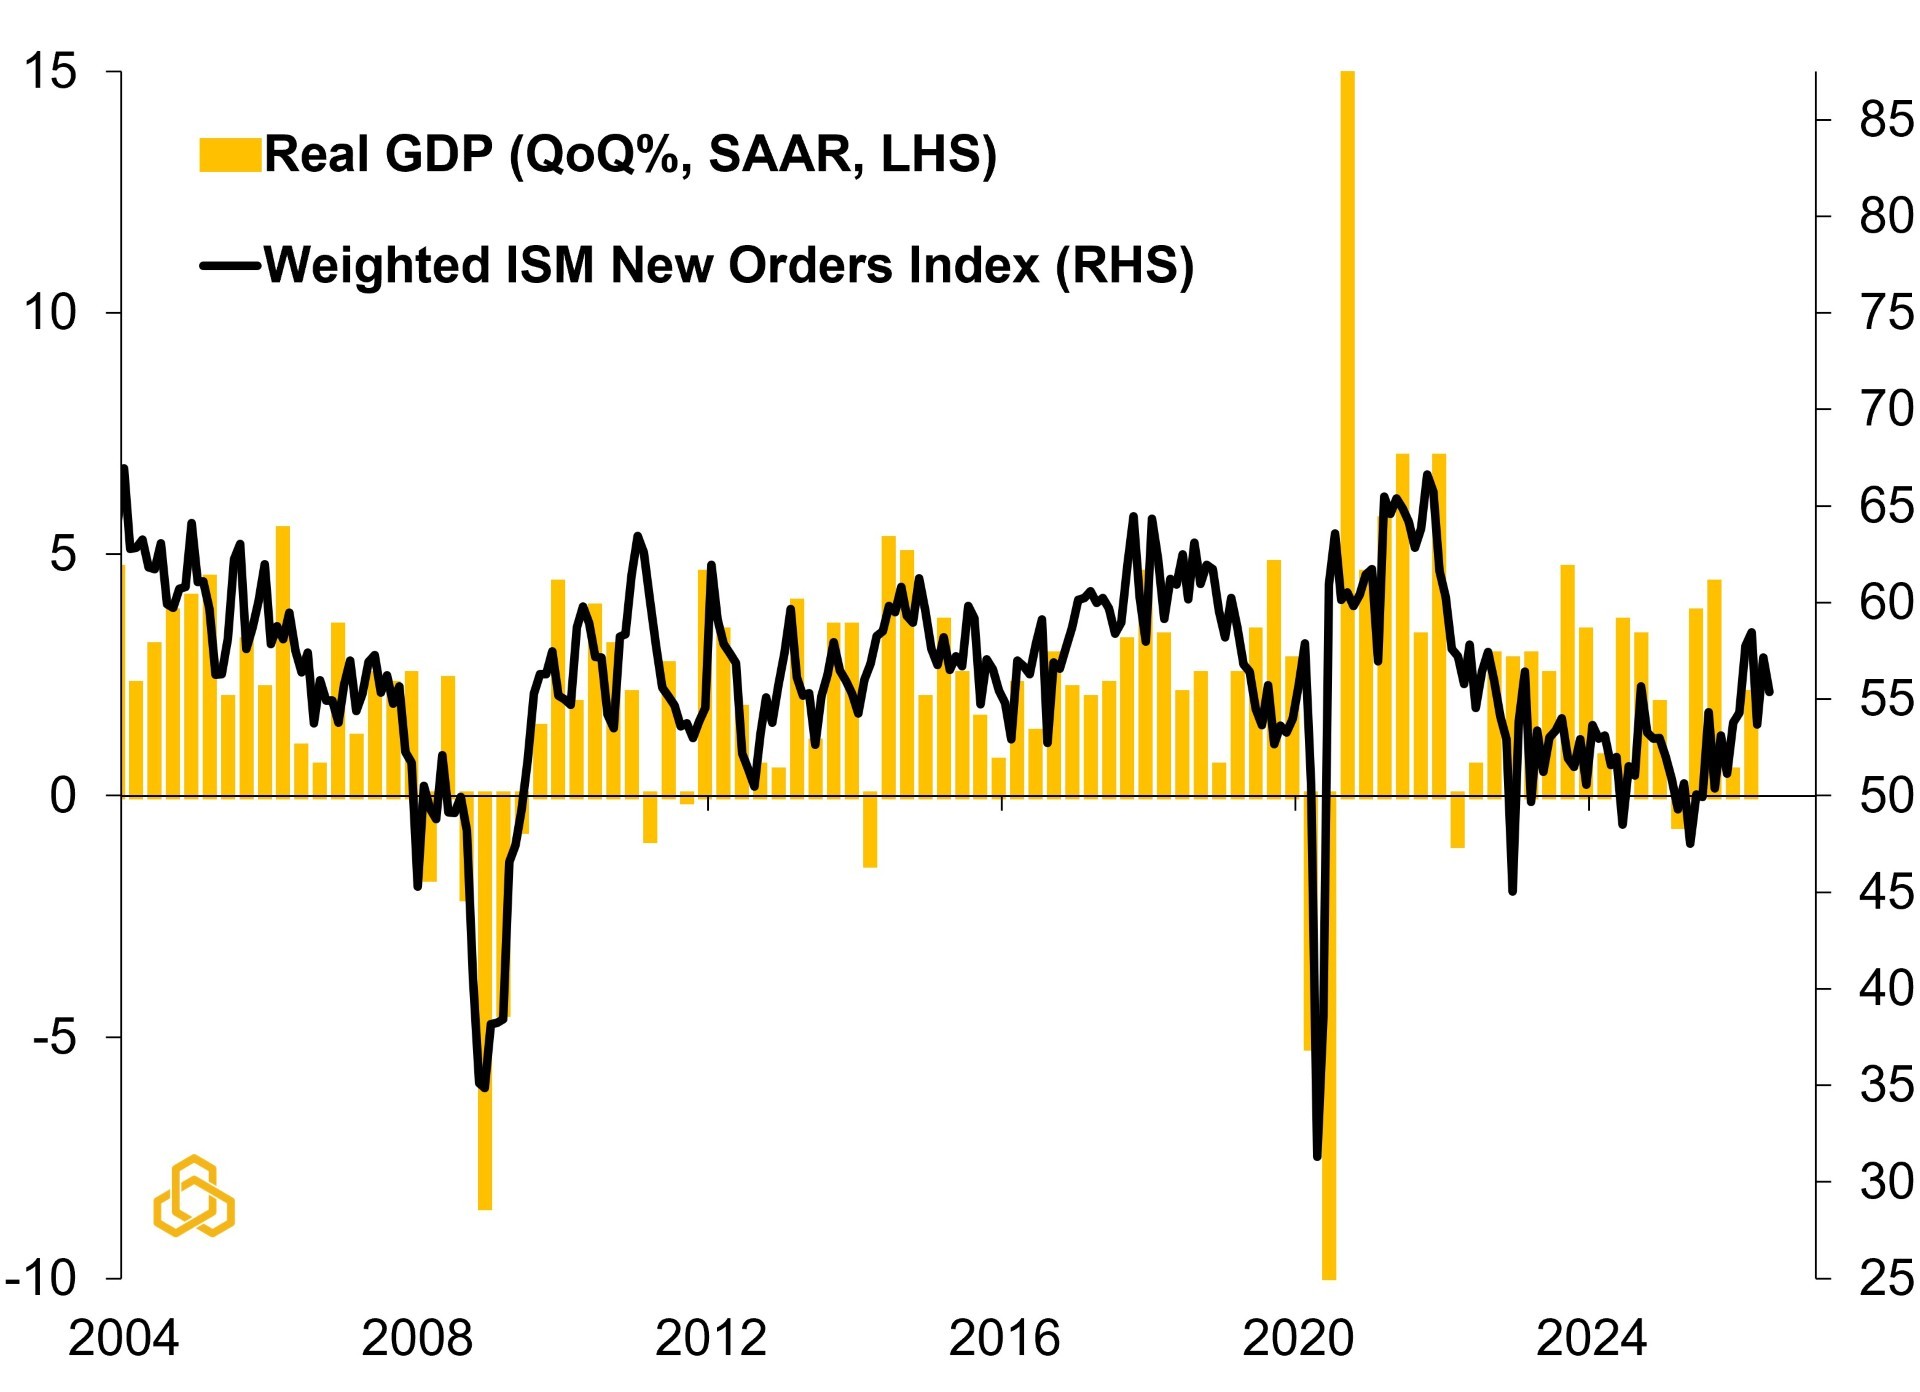
Sources: Bureau of Economic Analysis, Institute for Supply Management, and Potomac. Note: Weighted ISM New Orders is 70% services and 30% manufacturing.
Gross Domestic Product (GDP)
Gross Domestic Product, or GDP, is the broadest measure of economic activity. It represents the total value of all goods and services produced in the United States and is often referred to as the economy's report card.
Unlike many economic reports, GDP pulls together information on consumer spending, business investment, government spending, and international trade to provide the most comprehensive picture of economic growth. It is also one of the primary measures economists use to determine whether the economy is expanding or contracting.
The challenge is that GDP is only released quarterly and with a lag. Investors don't want to wait three months to find out how the economy is performing, so they closely follow monthly reports that provide clues about where GDP is headed.
One of the most important is Retail Sales. Because consumer spending accounts for roughly two-thirds of U.S. GDP, the Retail Sales report offers an early read on the economy's largest driver. Investors often focus on Core Retail Sales, which exclude automobiles, gasoline, building materials, and food services, because it tends to provide a cleaner signal of underlying consumer demand.
Taken together, GDP and the monthly reports that feed into it help investors answer one of the most important questions in markets: Is the economy growing, and if so, how fast?
Real U.S. Gross Domestic Product (YoY%) vs. U.S. Recessions
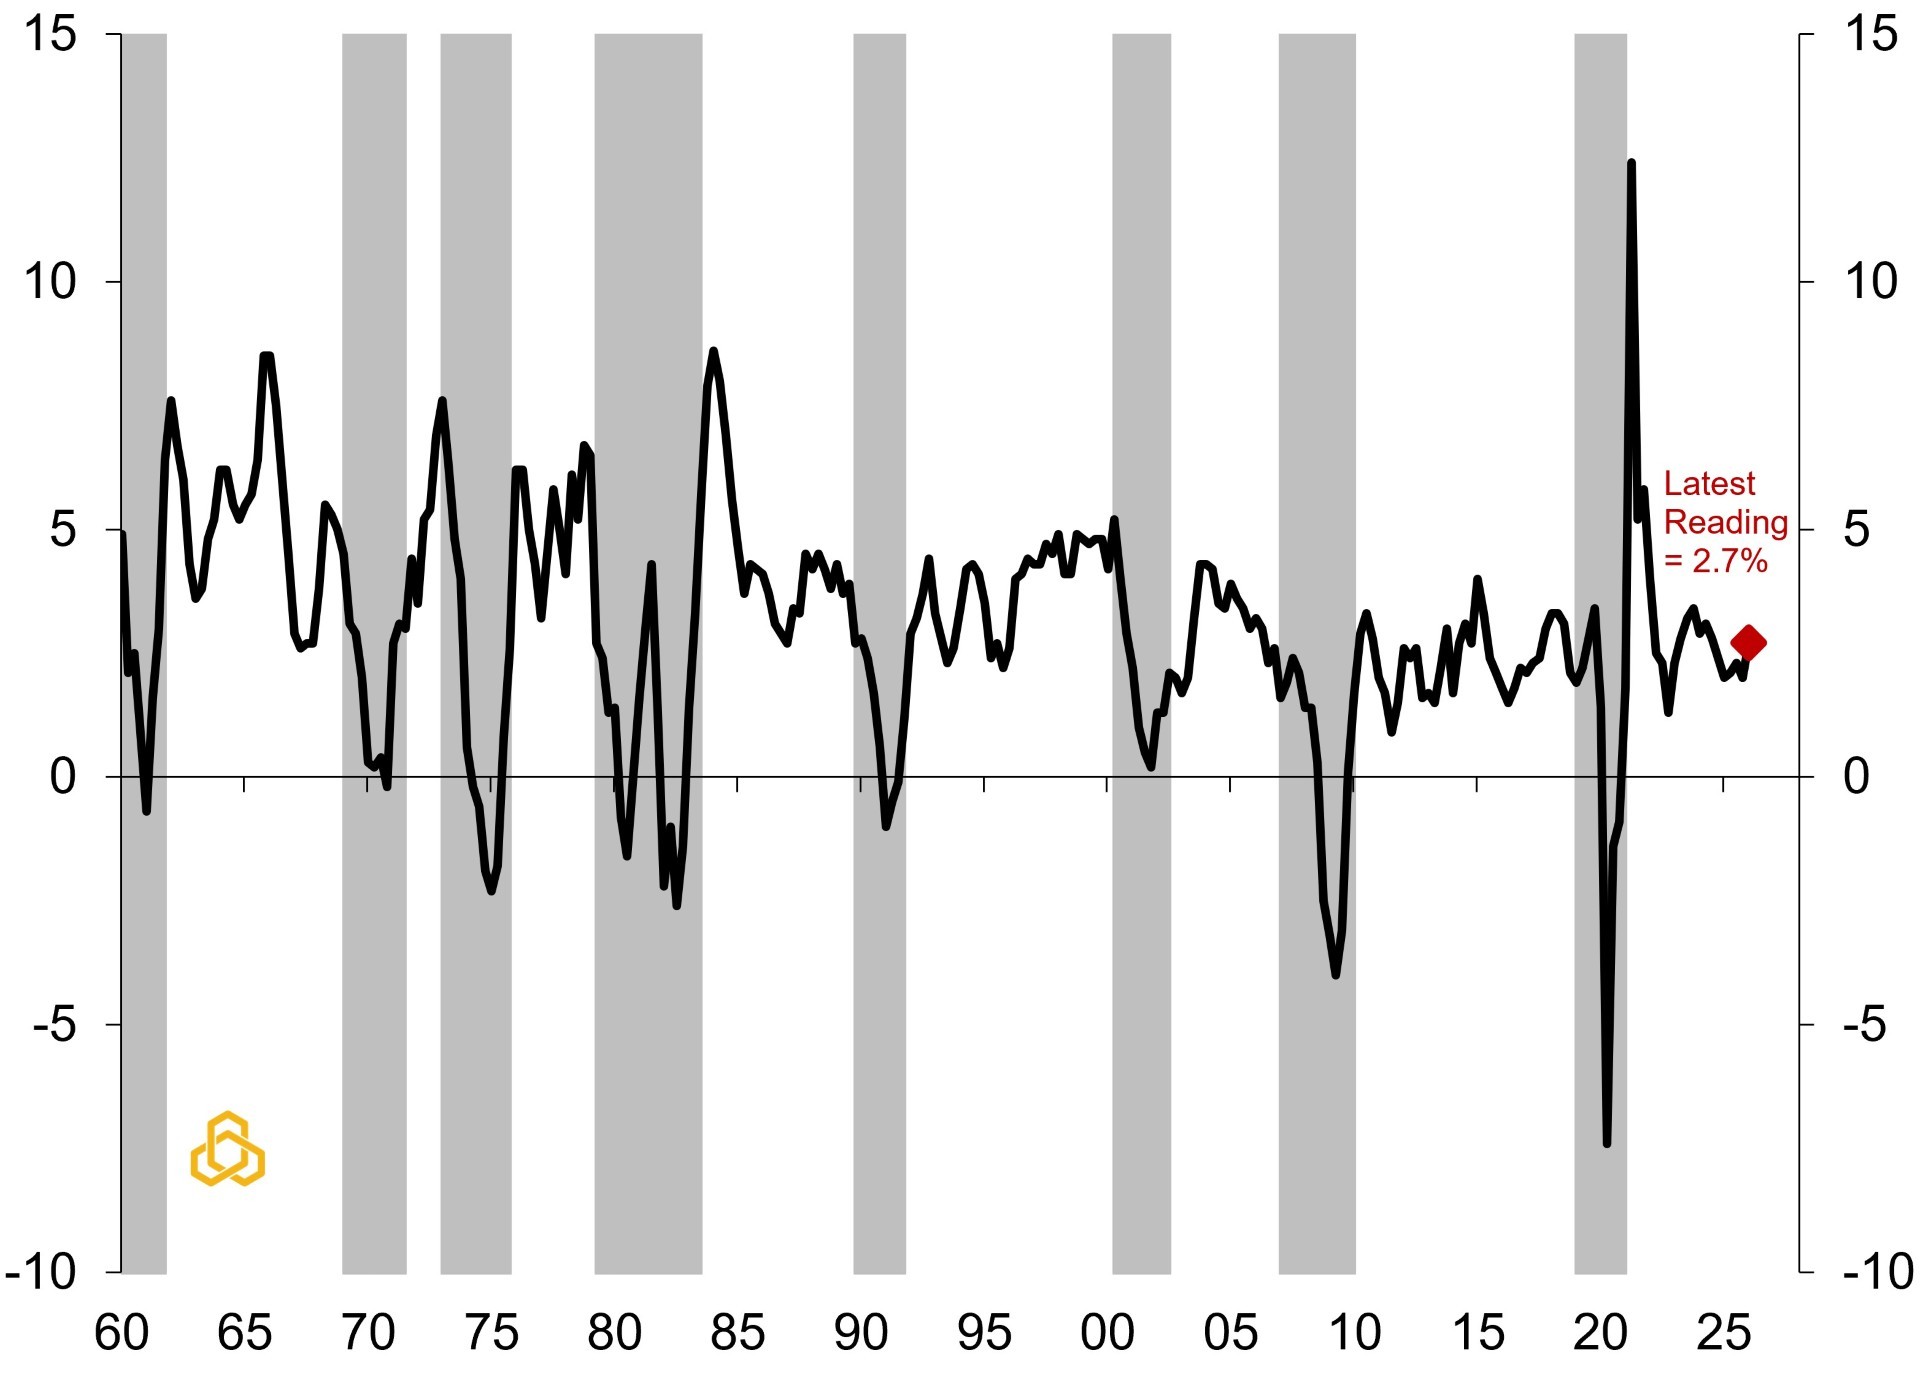
Sources: Bureau of Economic Analysis, National Bureau of Economic Research, and Potomac. Note: Shaded regions denote periods of U.S. recession.
The Bottom Line
No single economic report tells the whole story. In fact, one of the biggest mistakes investors can make is relying too heavily on a single data point. Economic reports often send mixed signals, which is why economists look for confirmation across multiple releases rather than drawing conclusions from any one report.
Taken together, these five reports provide a practical framework for understanding the economy. They won't predict every market move, but they can help investors focus on the three questions that matter most:
Is the economy growing?
Is the labor market healthy?
Are inflation pressures rising or falling?
If you can answer those three questions, you'll have a much better understanding of why markets are moving and what investors are watching.


