Every time the stock market approaches or reaches all-time highs, we hear the same phrase repeated across financial media: “The stock market is not the economy.” It is typically used to explain why stocks are rallying despite whatever risks or anxieties dominate the headlines at the time. But what is really being said is something far simpler: the stock market is forward-looking.
The clearest example came during the Global Financial Crisis. The S&P 500 bottomed on March 9, 2009, while the U.S. unemployment rate sat at 8.3% and was still climbing rapidly (see figure 1). Unemployment would not peak until October 2009 when it reached 10.0%. Yet from the March lows, the S&P 500 surged nearly 65% by year-end.
Figure 1. S&P 500 vs the U.S. Unemployment Rate (2008 – 2012)
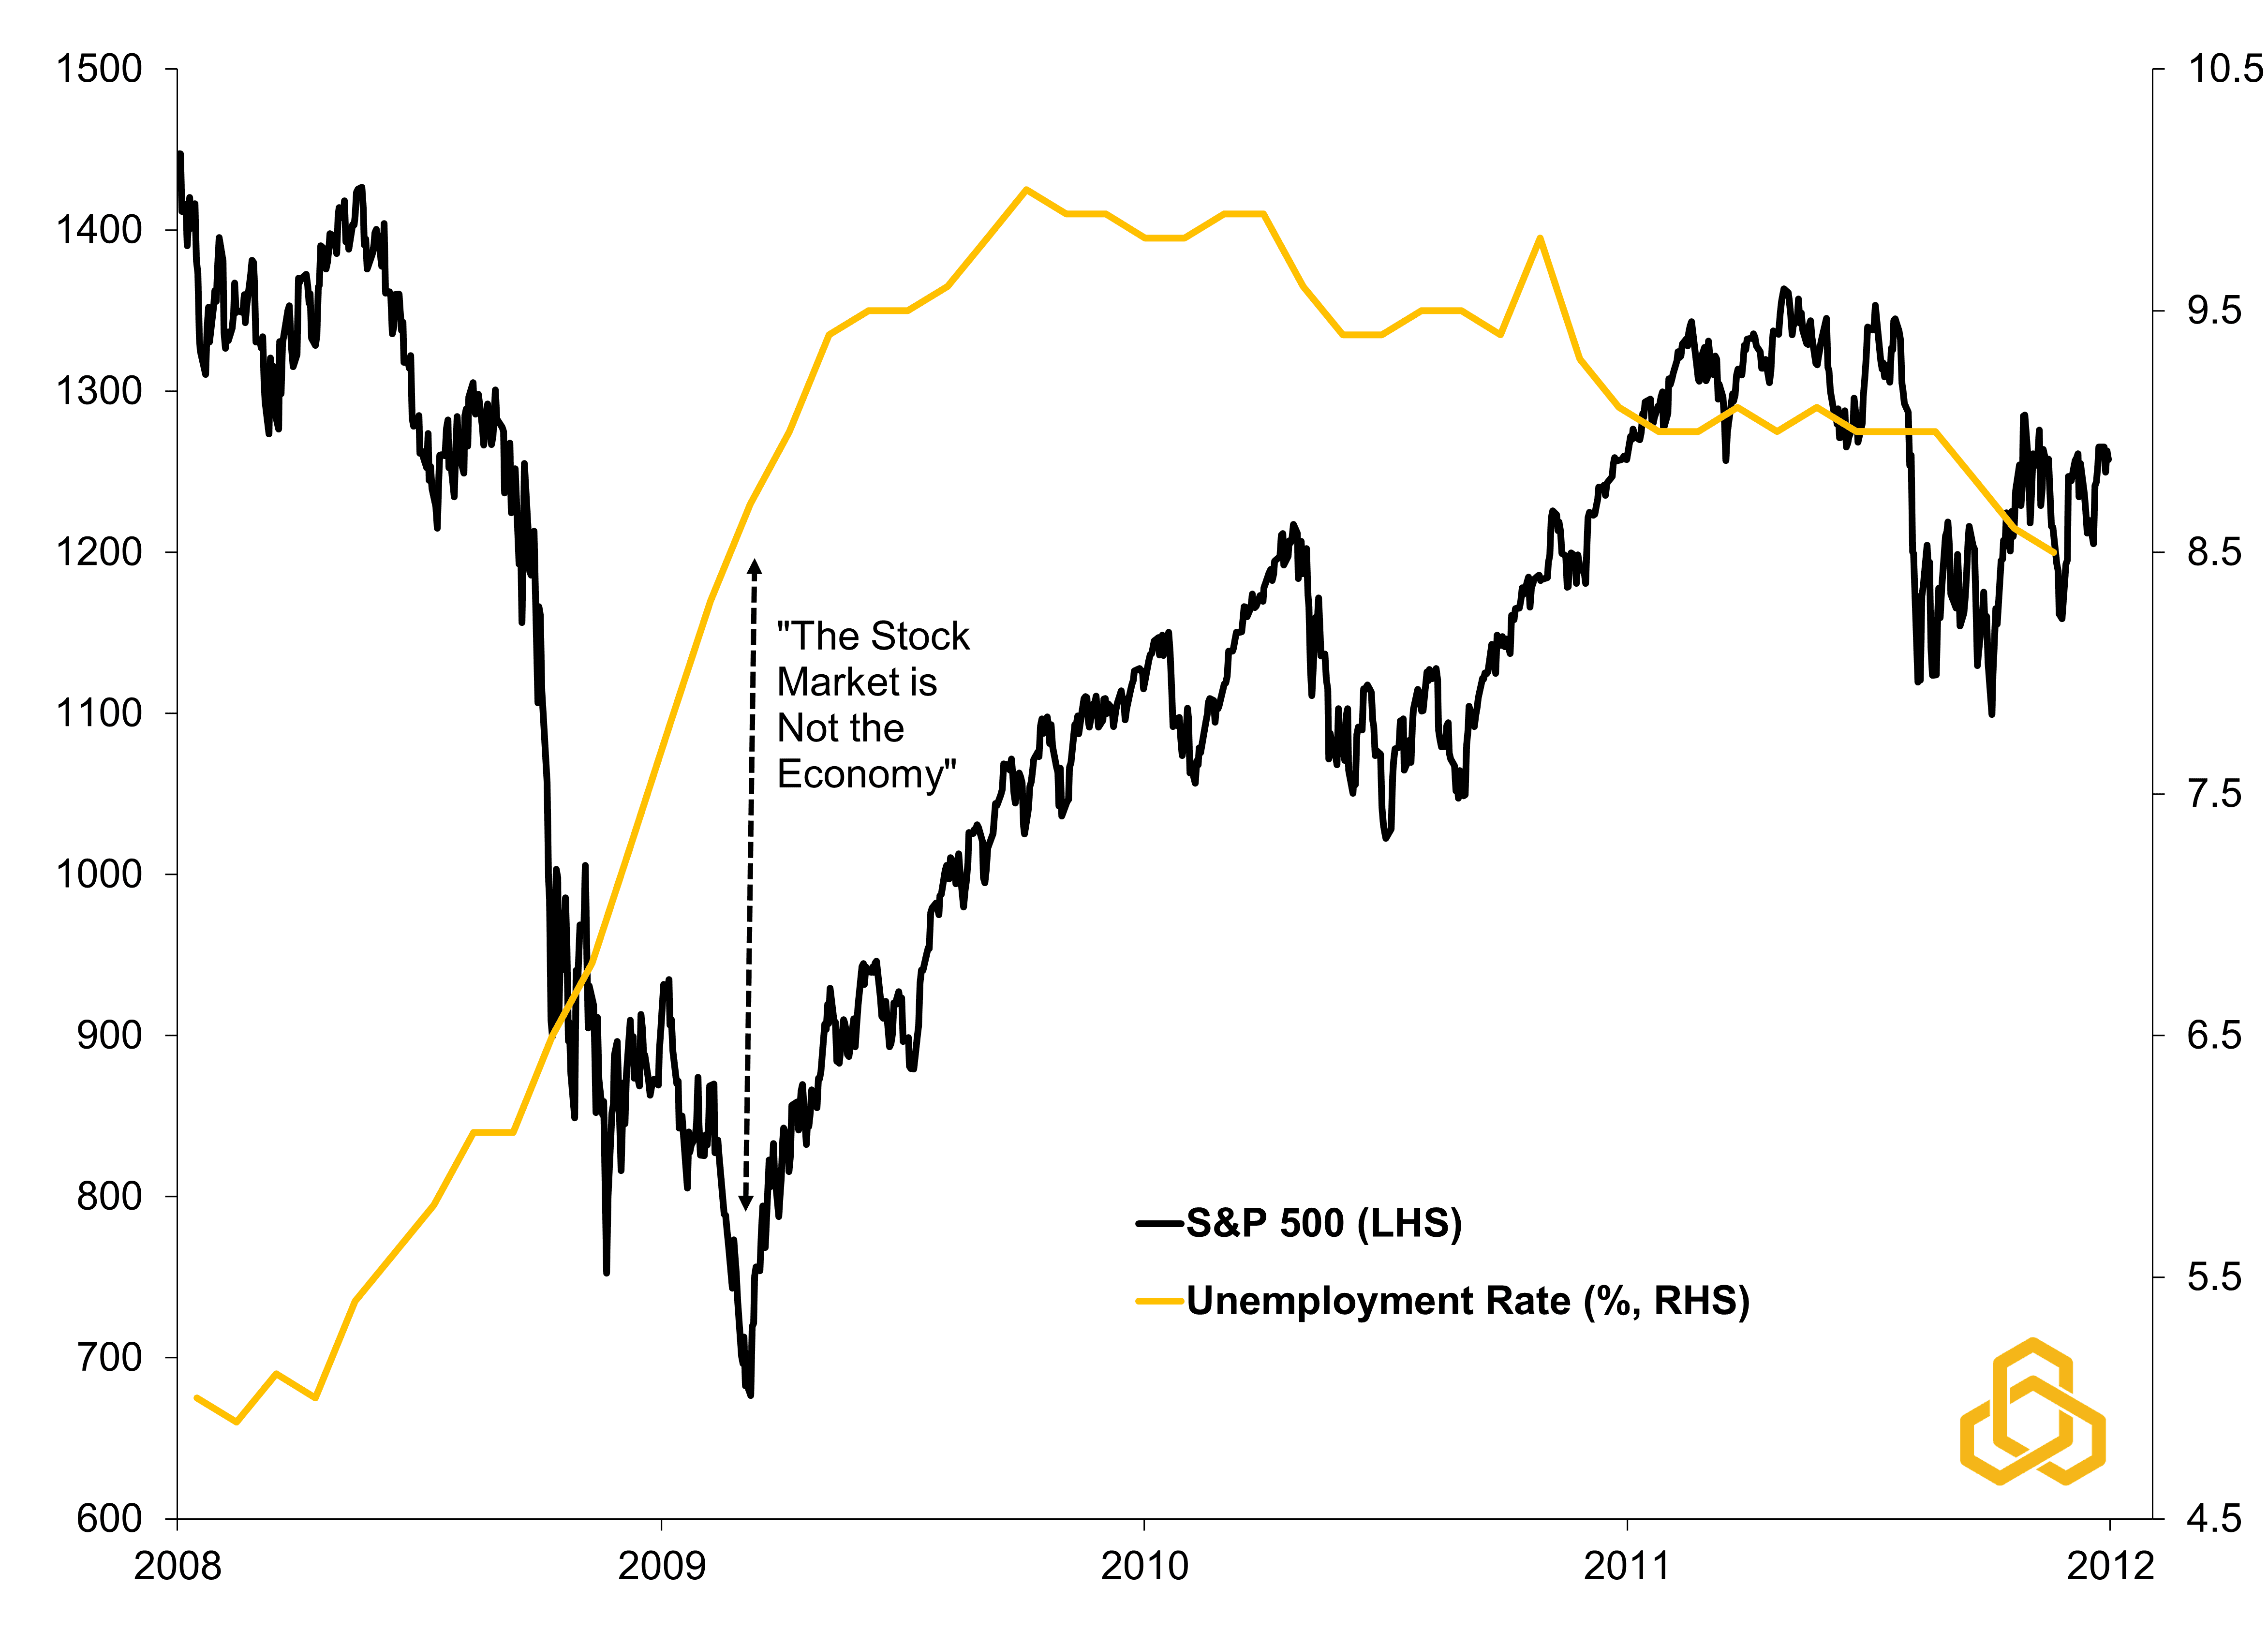
Sources: Standard & Poor’s, Bureau of Labor Statistics, Bloomberg L.P., and Potomac. Data as of December 31, 2011. Past performance is no guarantee of future results. It is not possible to invest directly in an index.
What changed? Not the economy.
At the time, payrolls were still collapsing, home prices were still falling, and recession fears remained widespread. What changed was investors began to believe the financial system would survive and that the economy would eventually recover.
One of the key catalysts came when Citigroup CEO Vikram Pandit circulated an internal memo stating that Citigroup had been profitable in January and February and was on track for its best quarter since 2007. Combined with bank rescues, Federal Reserve liquidity programs, and growing confidence that policymakers would not allow a systemic collapse, markets stopped pricing catastrophe and started pricing recovery.
Today, new highs in the S&P 500 amid the U.S.-Israel and Iran conflict and one of the largest commodity shocks in years feels similarly disconnected from economic reality. But is it?
Corporate profits, which are ultimately the primary driver of equity prices, are on track to rise roughly 28% year-on-year in the first quarter of 2026 (see figure 2). With 89% of companies already having reported, that pace appears likely to hold, making it the strongest quarter for earnings growth since the fourth quarter of 2021, when massive fiscal and monetary stimulus, combined with surging inflation, boosted nominal corporate revenues across the economy.
Figure 2. S&P 500 Earnings-Per-Share Growth by Sector in 1Q 2026 (YoY%)
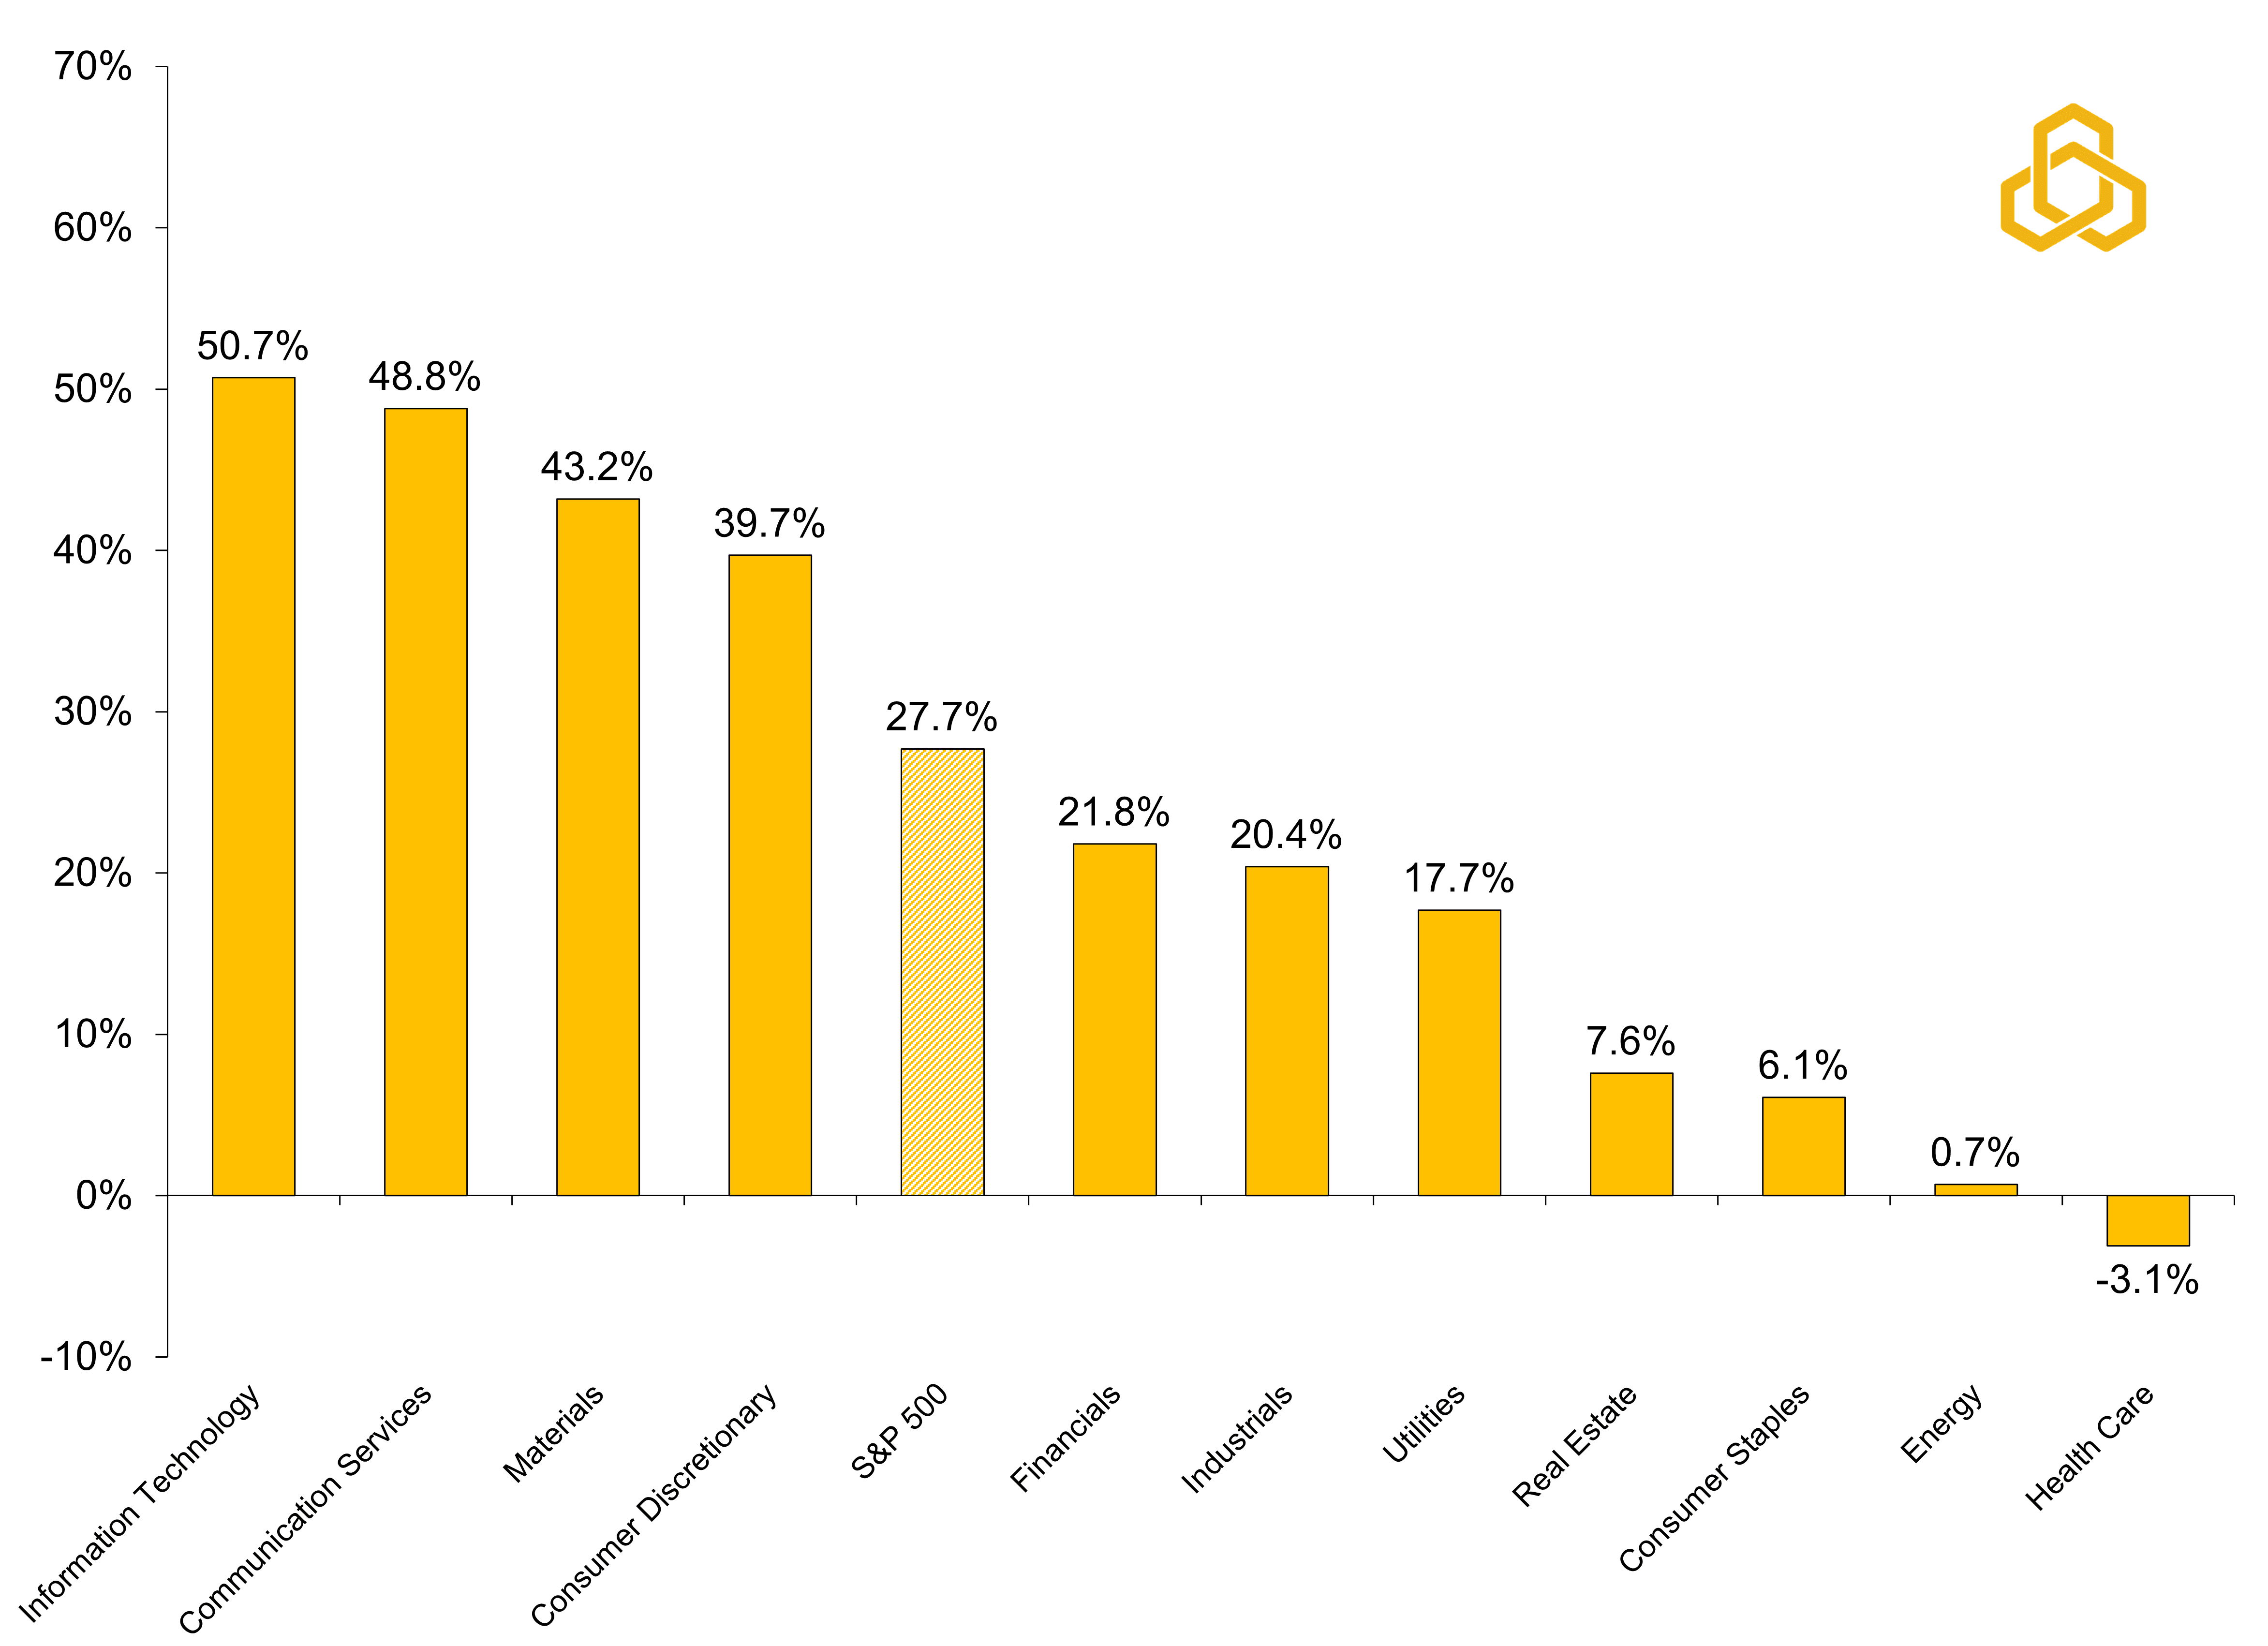
Sources: Standard & Poor’s, Bloomberg L.P., and Potomac. Data as of May 8, 2026. All forecasts are expressions of opinions and are subject to change without notice and are not intended to be a guarantee
Ten of the eleven sectors are reporting year-on-year growth, and seven of these ten sectors are reporting double-digit growth led by a 51% surge in Information Technology profits year-on-year. At the company level, NVIDIA and Micron Technology were the largest contributors to this growth in the tech sector. If these two companies were excluded, the blending earnings growth rate for tech would fall to 28.5%.
While the recent 65% rally in the Philadelphia Semiconductor Index appears parabolic and potentially vulnerable to a pause or pullback, semiconductor earnings themselves are projected to rise more than 90% in 2026. That reflects a very real shift occurring within the U.S. economy.
Private investment in information processing equipment and software is running roughly $254 billion above year-ago levels (see figure 3). At the same time, spending on data center construction continues to surge as cloud computing and artificial intelligence require enormous physical computing infrastructure, power generation, cooling systems, networking capacity, and semiconductor manufacturing (see figure 4).
Figure 3. U.S. Private Fixed Investment in Information Processing Equipment & Software (Change from One Year Ago, Billions of $, SAAR) vs. U.S. Recession)
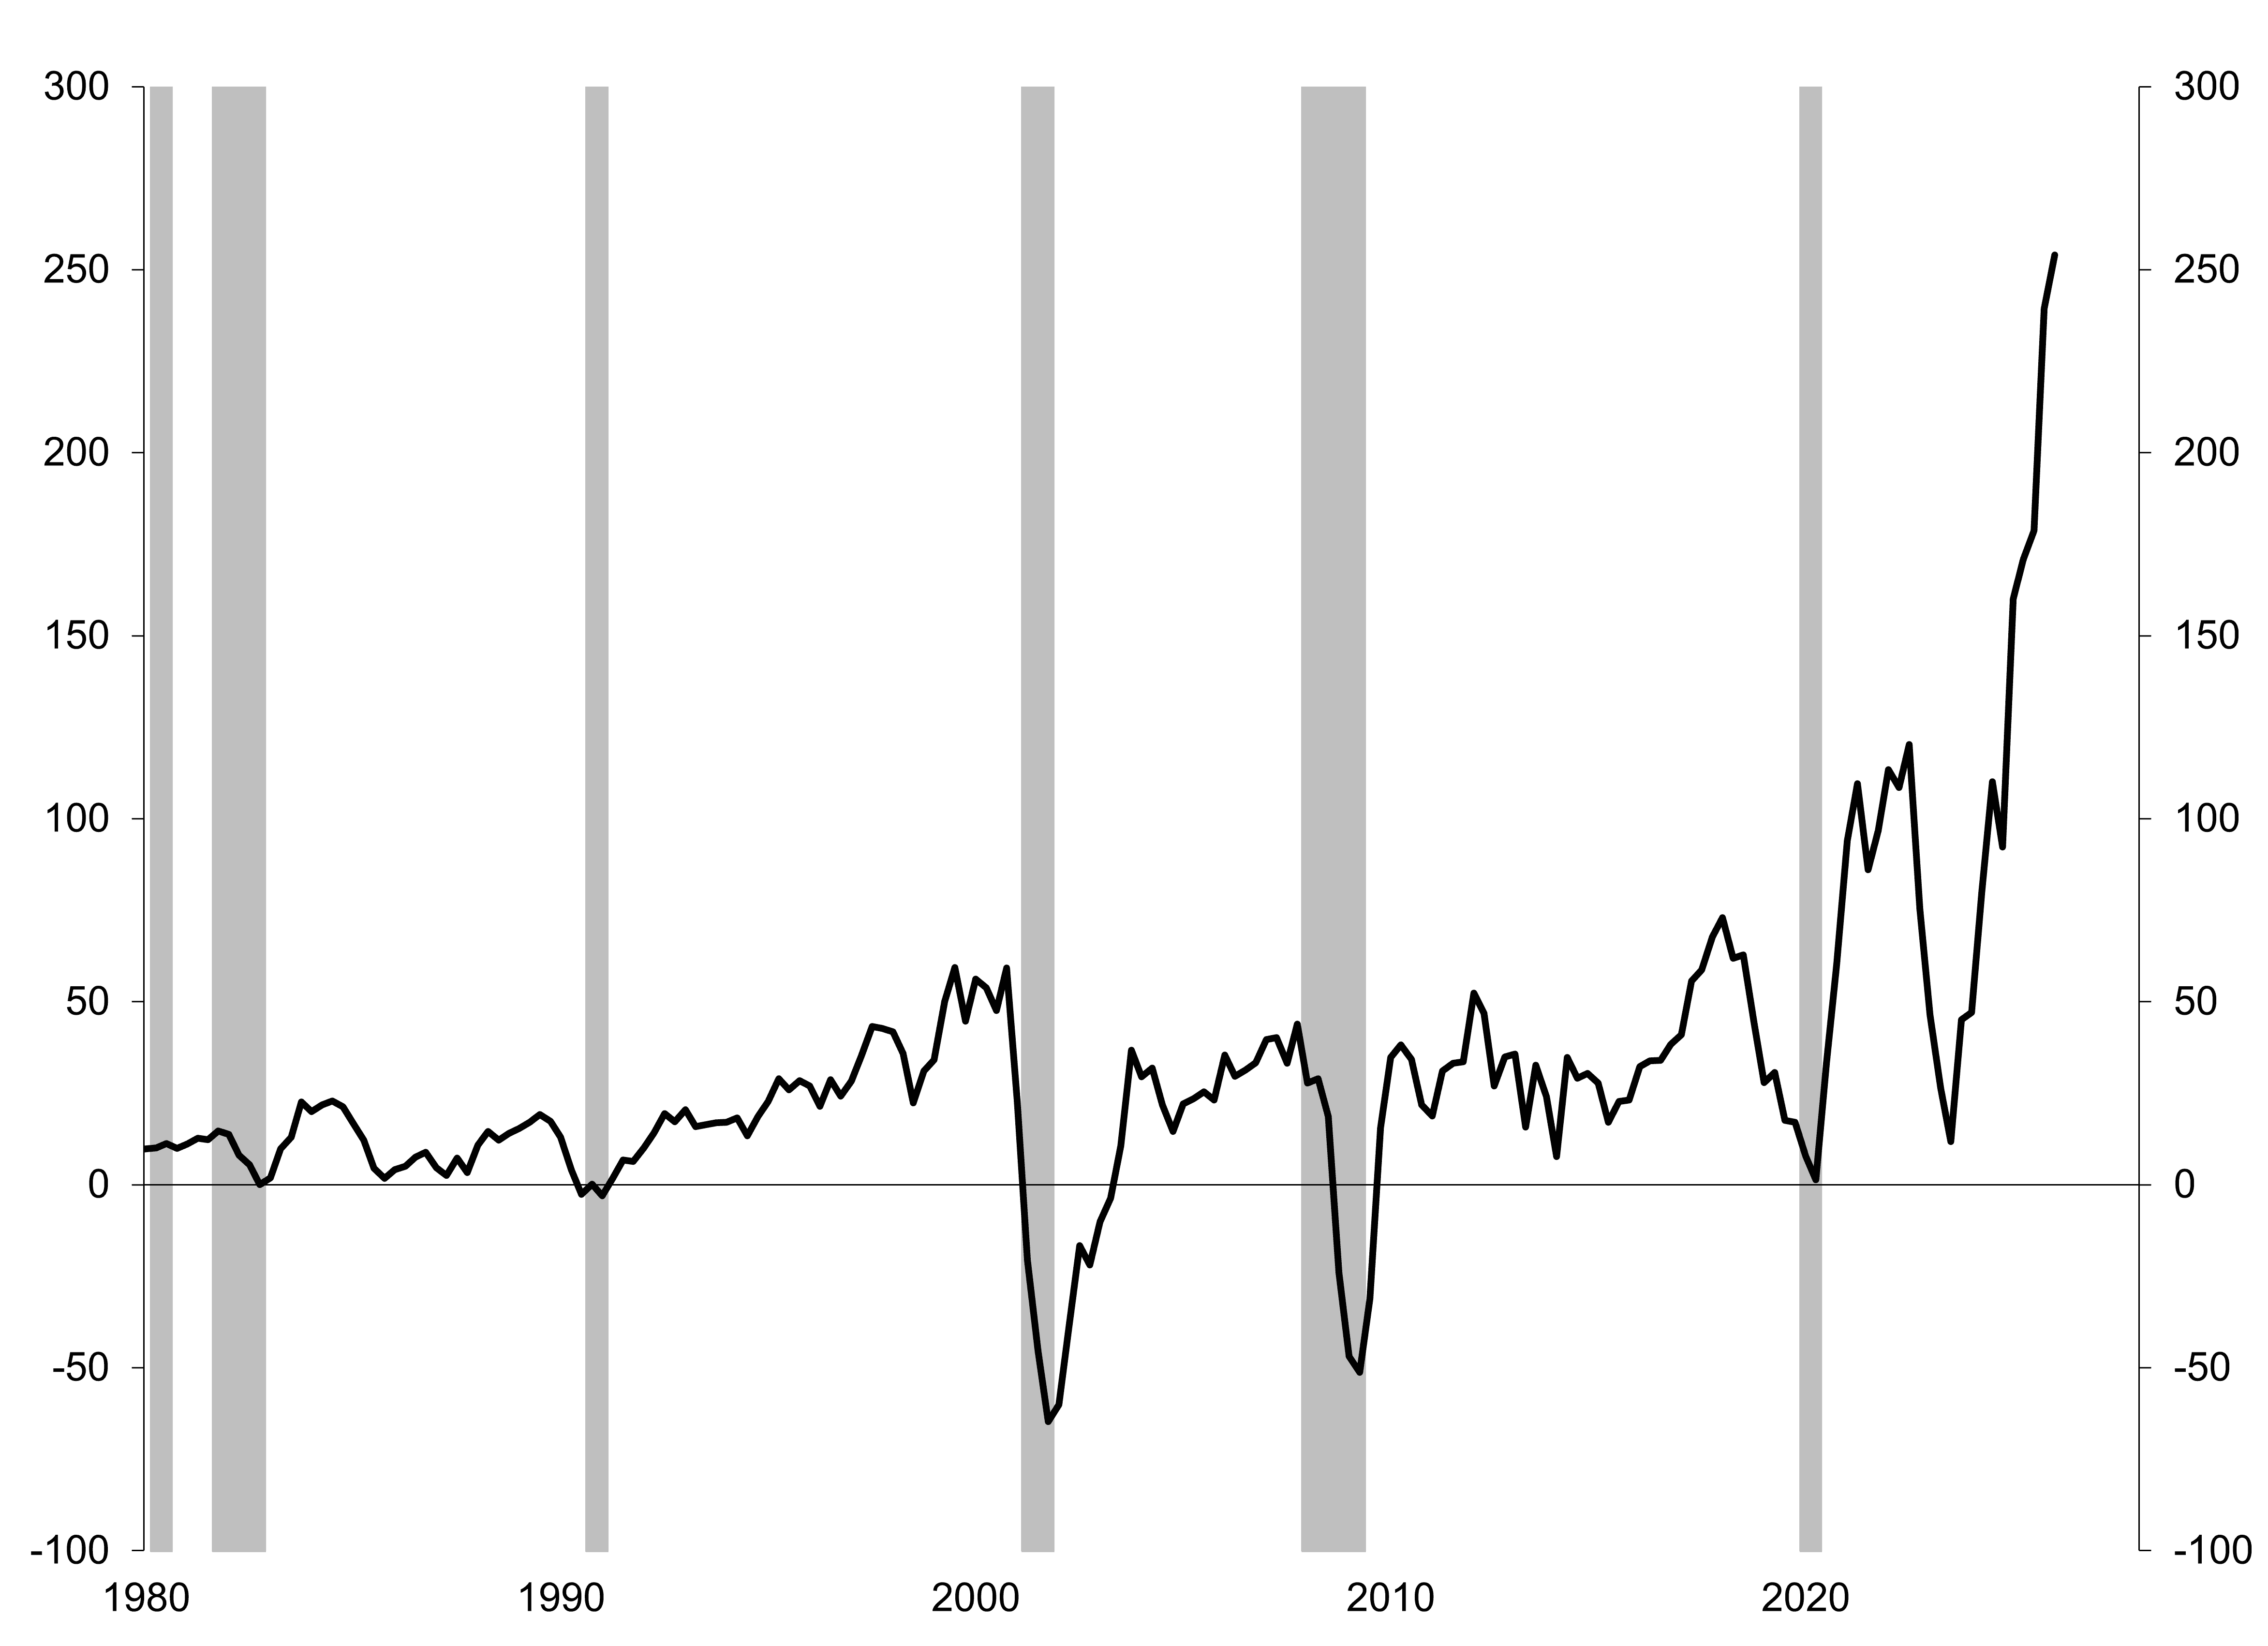
Sources: Bureau of Economic Analysis, National Bureau of Economic Research, Federal Reserve Bank of St. Louis (FRED), and Potomac. Note 1: Shaded regions denote periods of U.S. recession. Note 2: SAAR is seasonally adjusted annualized rate.
Figure 4. Construction Spending on Data Centers (Millions of $, SAAR)
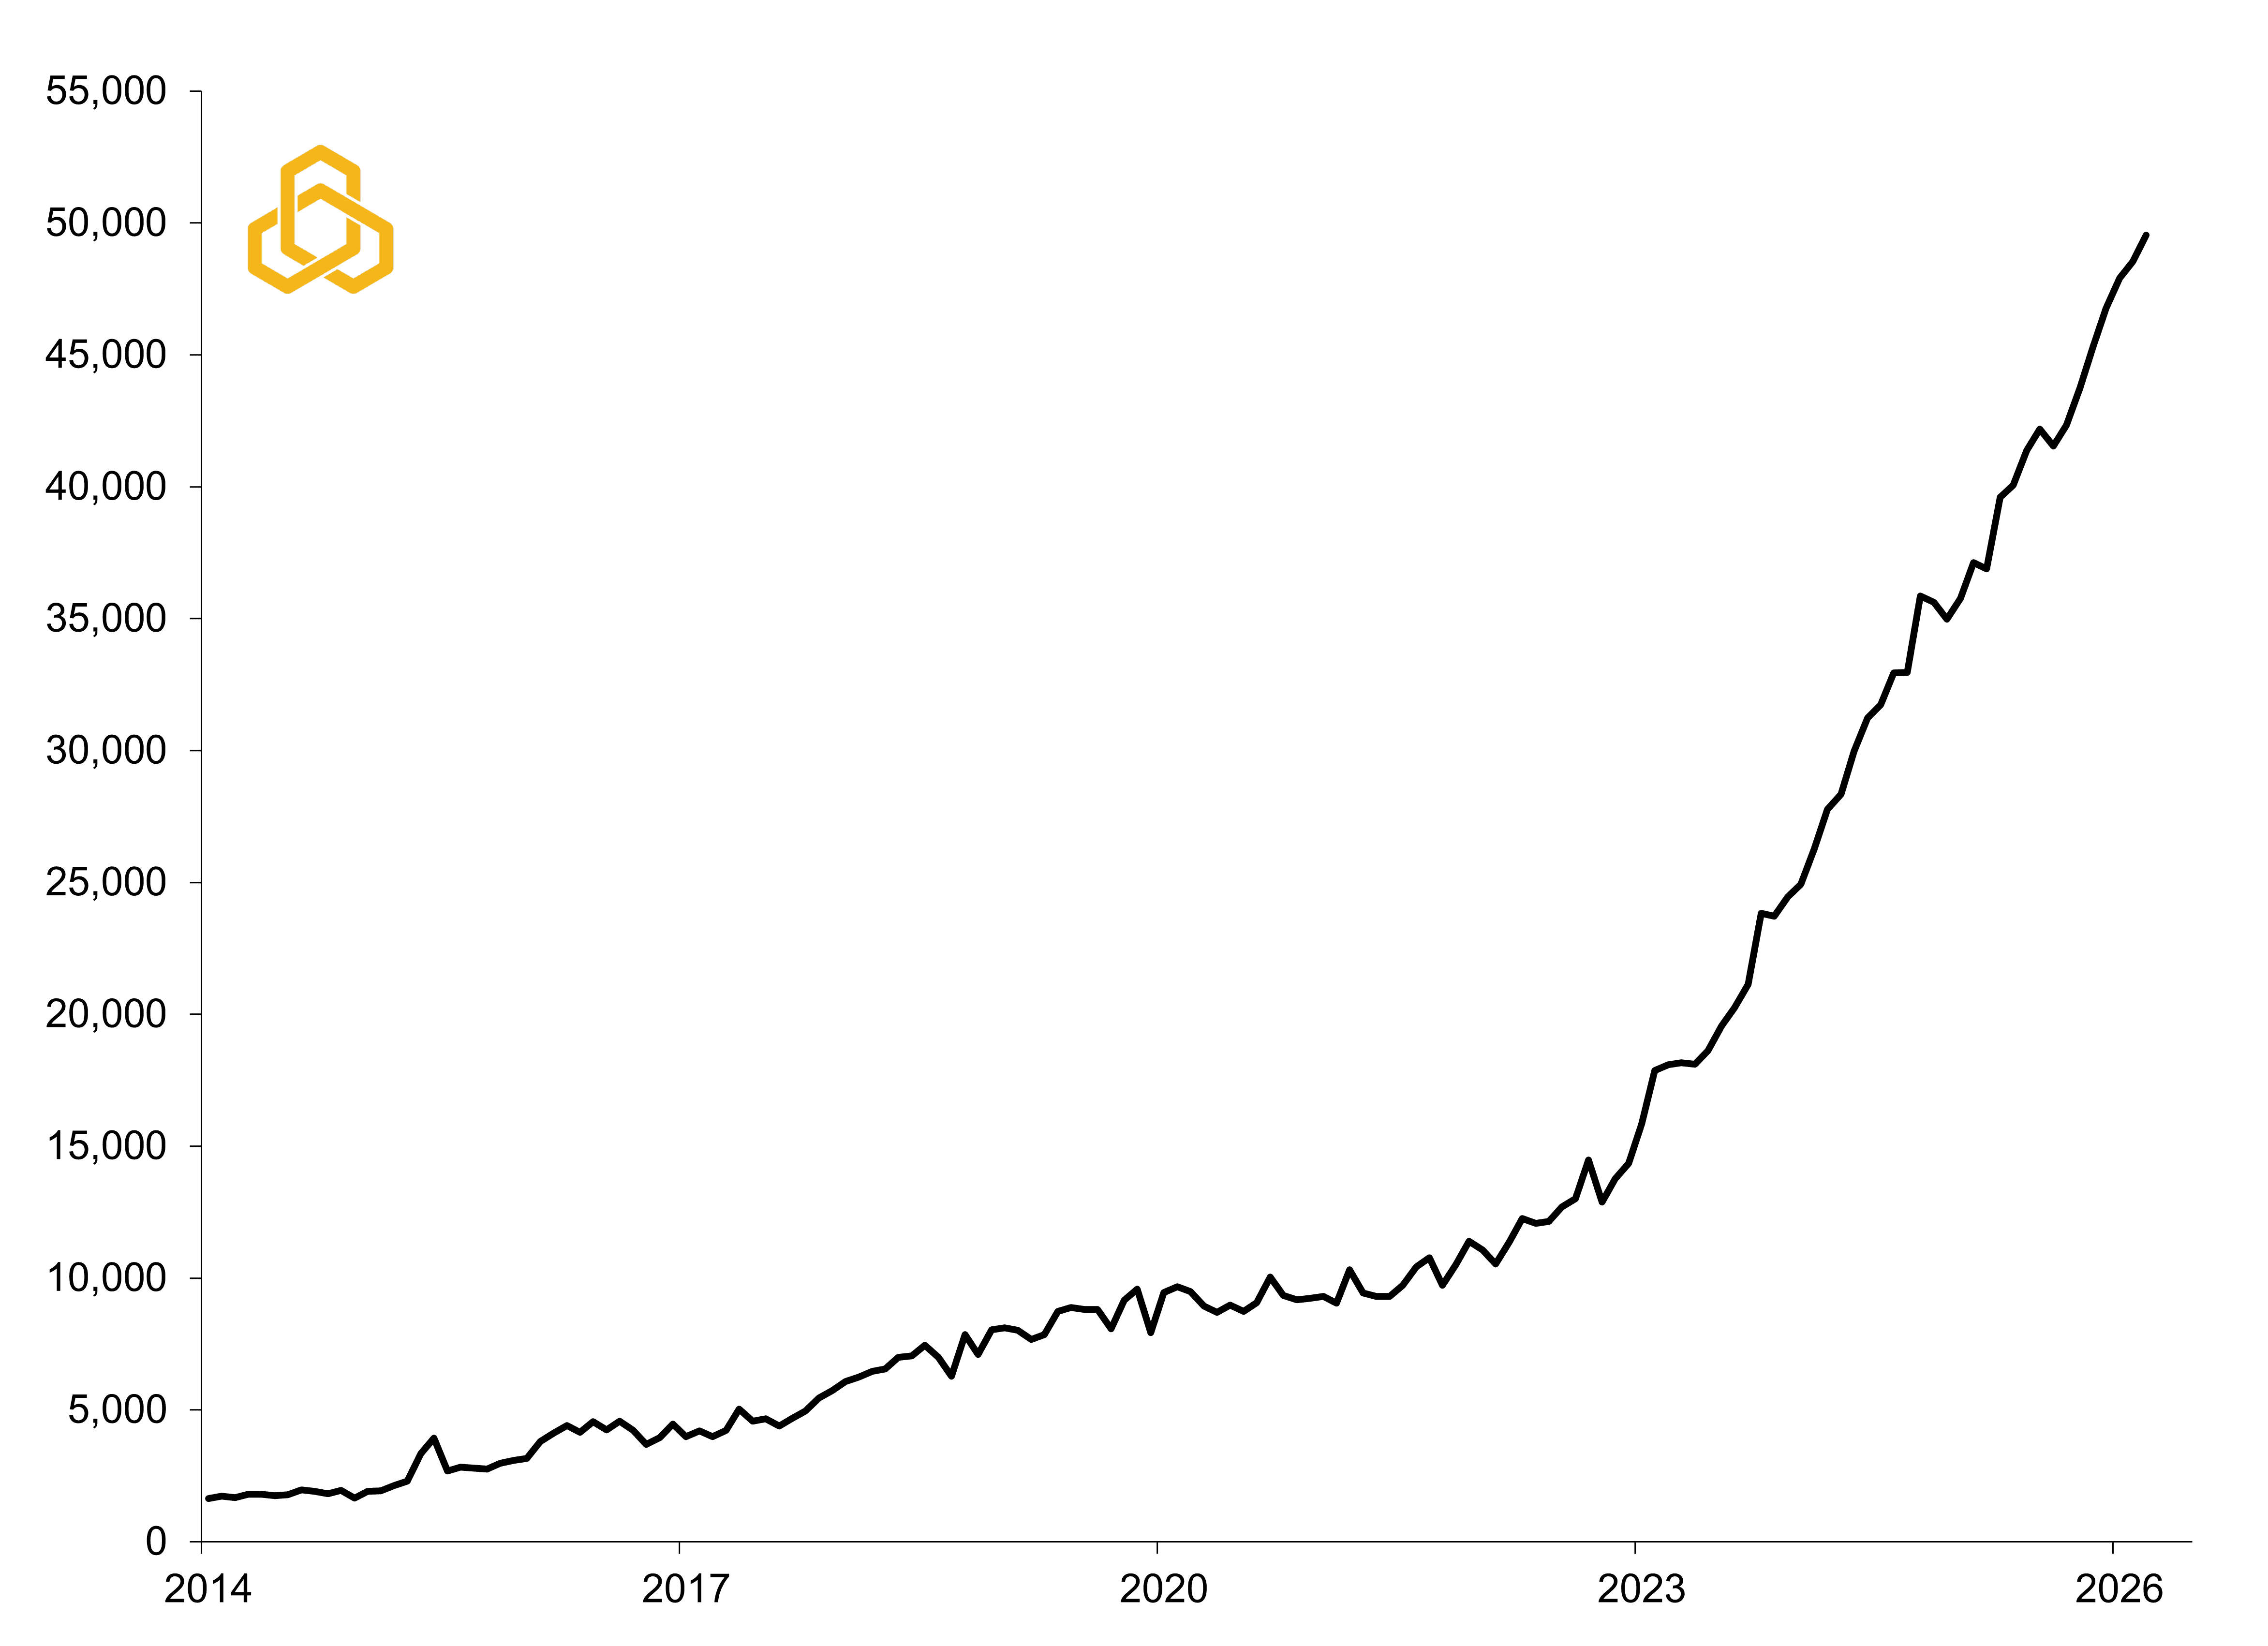
Sources: Census Bureau and Potomac. Data as of 1Q 2026. Note: The time series is from the Value of Private Construction Put in Place survey and is a seasonally adjusted annualized rate.
For the full year, major U.S. hyper-scalers alone are expected to spend between $600 billion and $700 billion on AI infrastructure. In the first quarter of 2026, private investment in information processing equipment and software contributed 0.82 percentage point to the economy’s 2.0% real GDP growth rate. That was the third-highest contribution since 1990, a period that includes the internet boom of the mid-1990s (see figure 5). If history is any guide, this investment cycle may still have years left to run.
Figure 5. Private Fixed Investment in Information Processing Equipment’s Contribution to Real Gross Domestic Product (%)
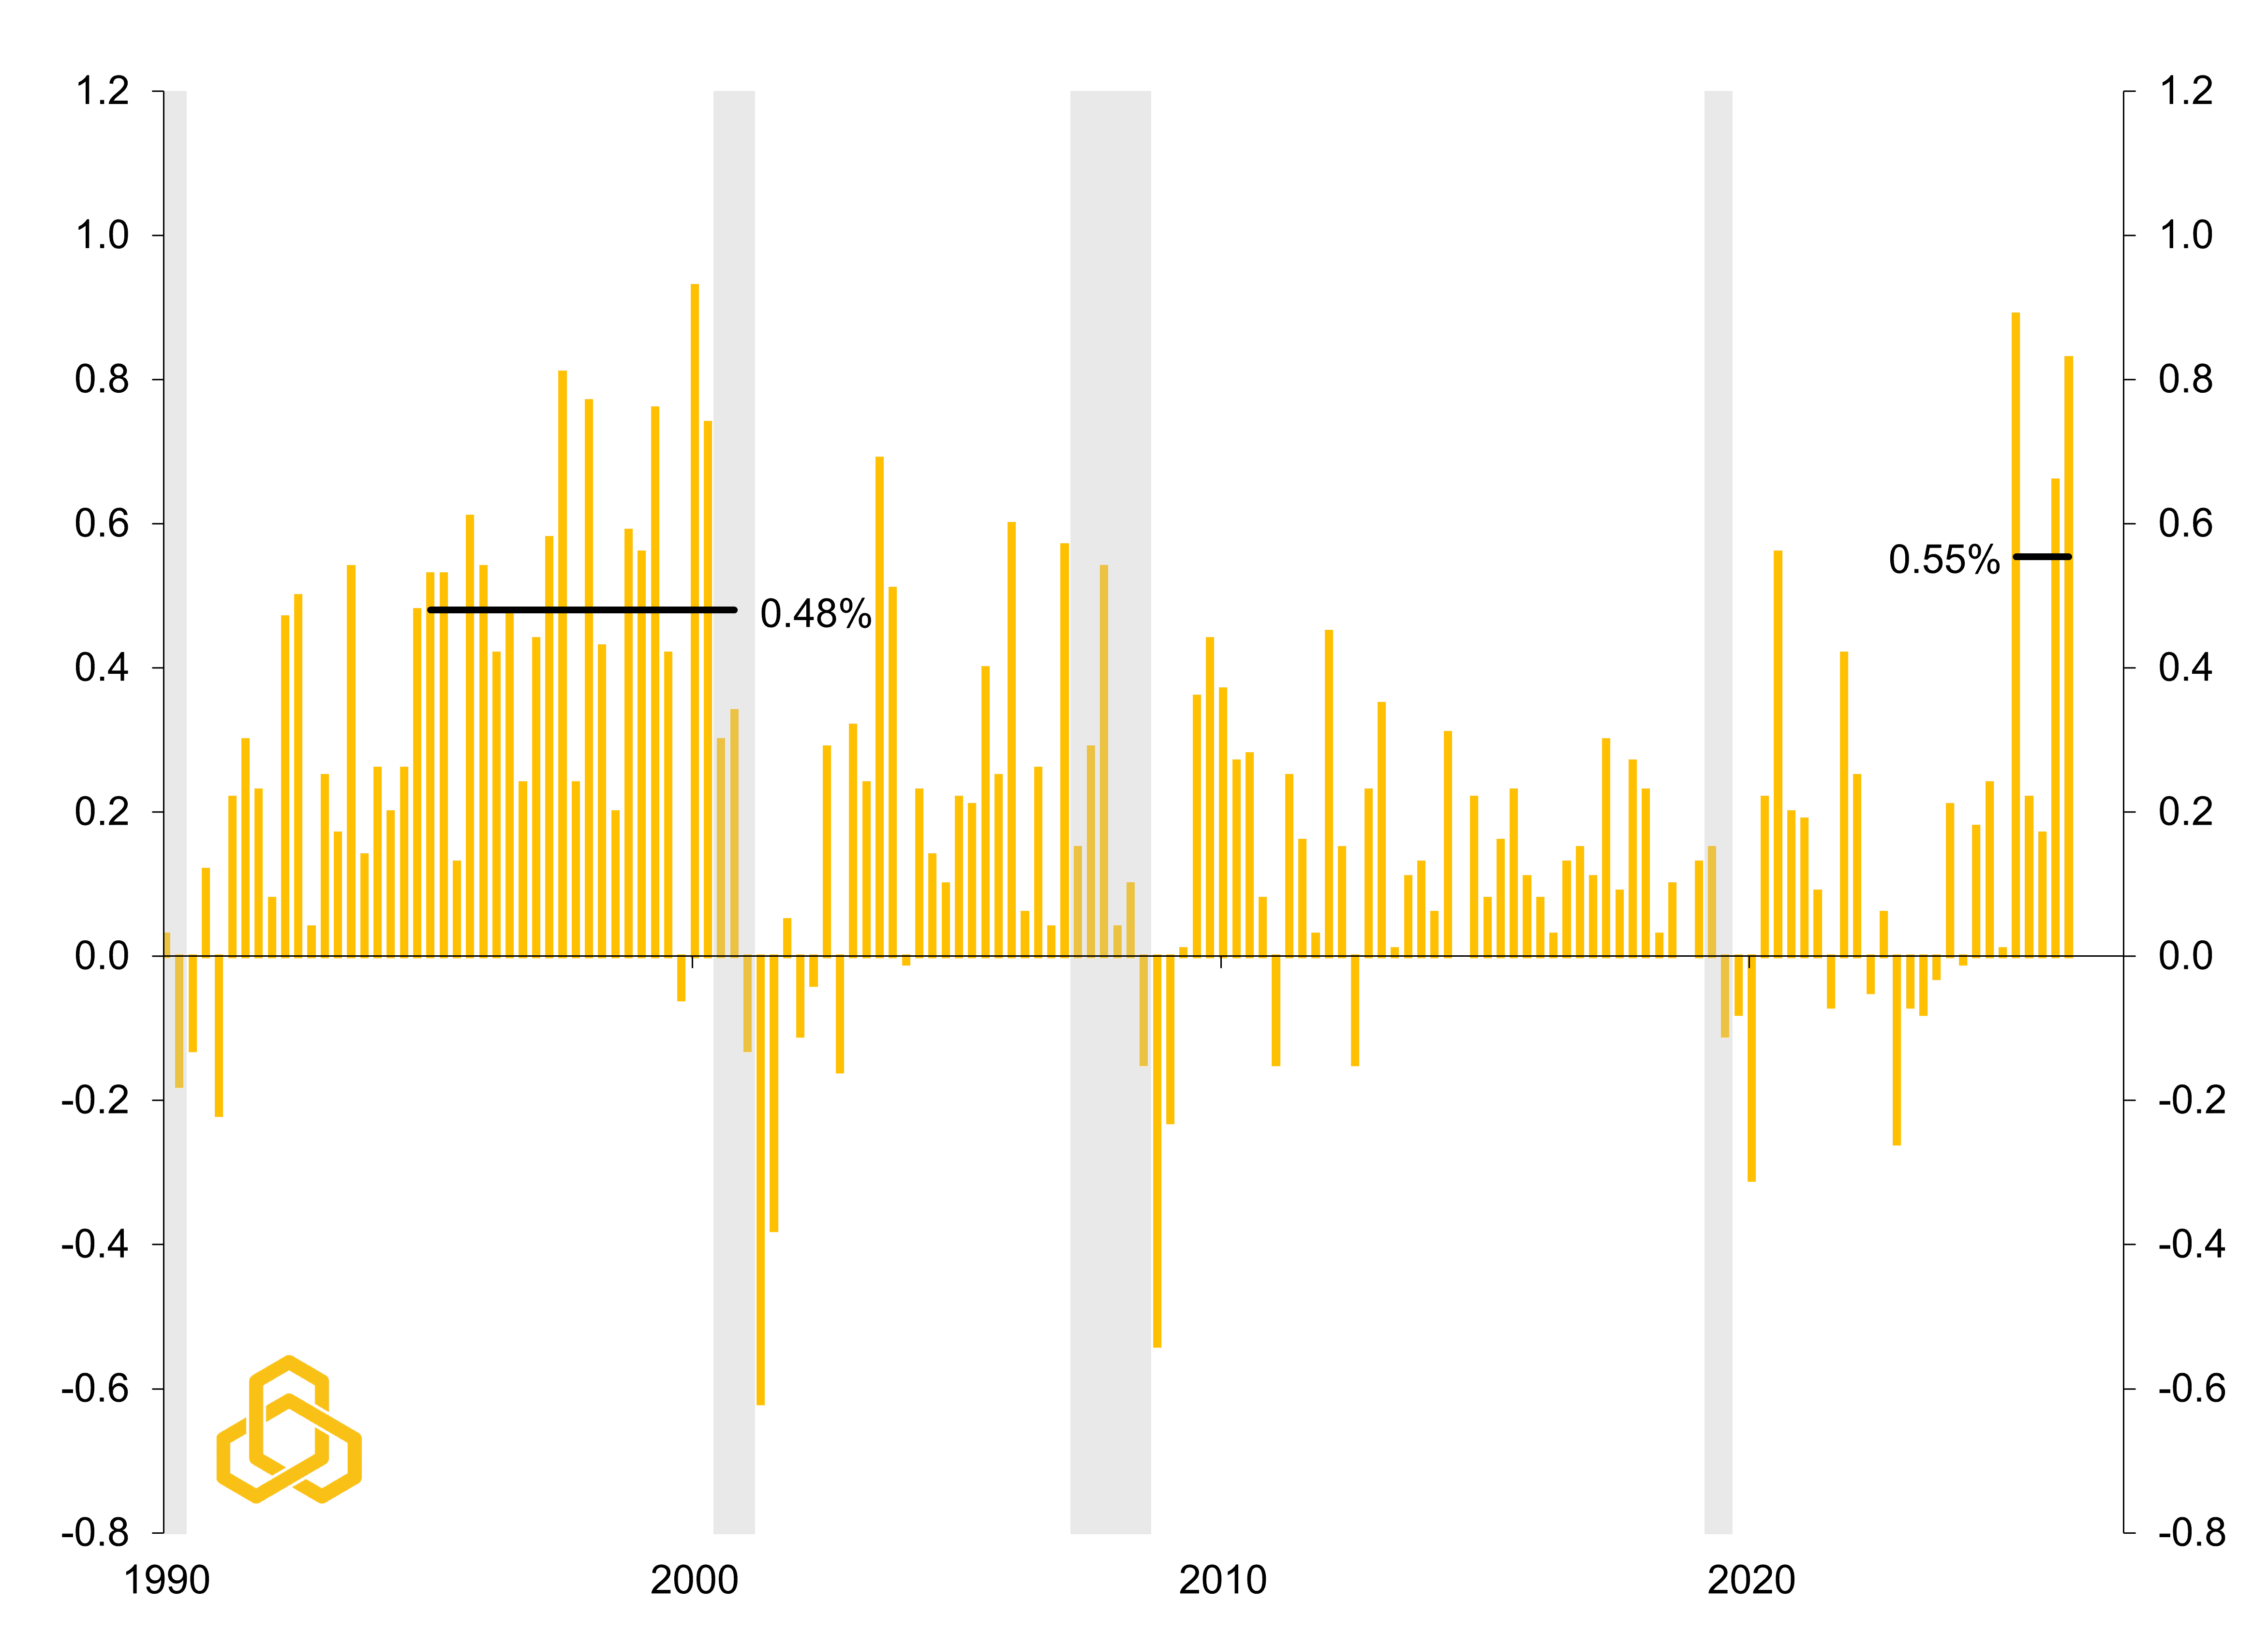
Sources: Bureau of Economic Analysis, National Bureau of Economic Research, and Potomac. Data as of 1Q 2026. Note 1: Shaded regions denote periods of U.S. recession. Note 2: The black lines represent the average contribution to growth during that period.
There are, however, important caveats. The data in figure 5 could easily understate or overstate AI’s true economic impact in different ways. It understates the impact because it excludes much of the spending tied to data center construction, power infrastructure, cooling systems, and semiconductor fabrication facilities, much of which falls under manufacturing construction and nonresidential structures. At the same time, a meaningful share of AI hardware is imported, meaning some of the investment leaks abroad through the trade deficit and subtracts from GDP through net exports.
Still, once these effects are roughly netted out, it seems possible that AI-related investment contributed somewhere between 1.0 and 1.3 percentage points to first-quarter GDP growth. In other words, nearly half of all economic growth in the quarter may have been tied, directly or indirectly, to the AI infrastructure buildout.
That does not mean the market cannot become overextended. History suggests that transformative investment cycles almost always overshoot eventually. It is also possible that the economic impact of rising energy prices and geopolitical tensions simply has not fully filtered through to earnings expectations yet. S&P 500 earnings growth excluding Information Technology is currently expected to slow from 21.2% in the first quarter to 12.6% in the second quarter and roughly 10% in the third quarter before reaccelerating later in the year (see figure 6).
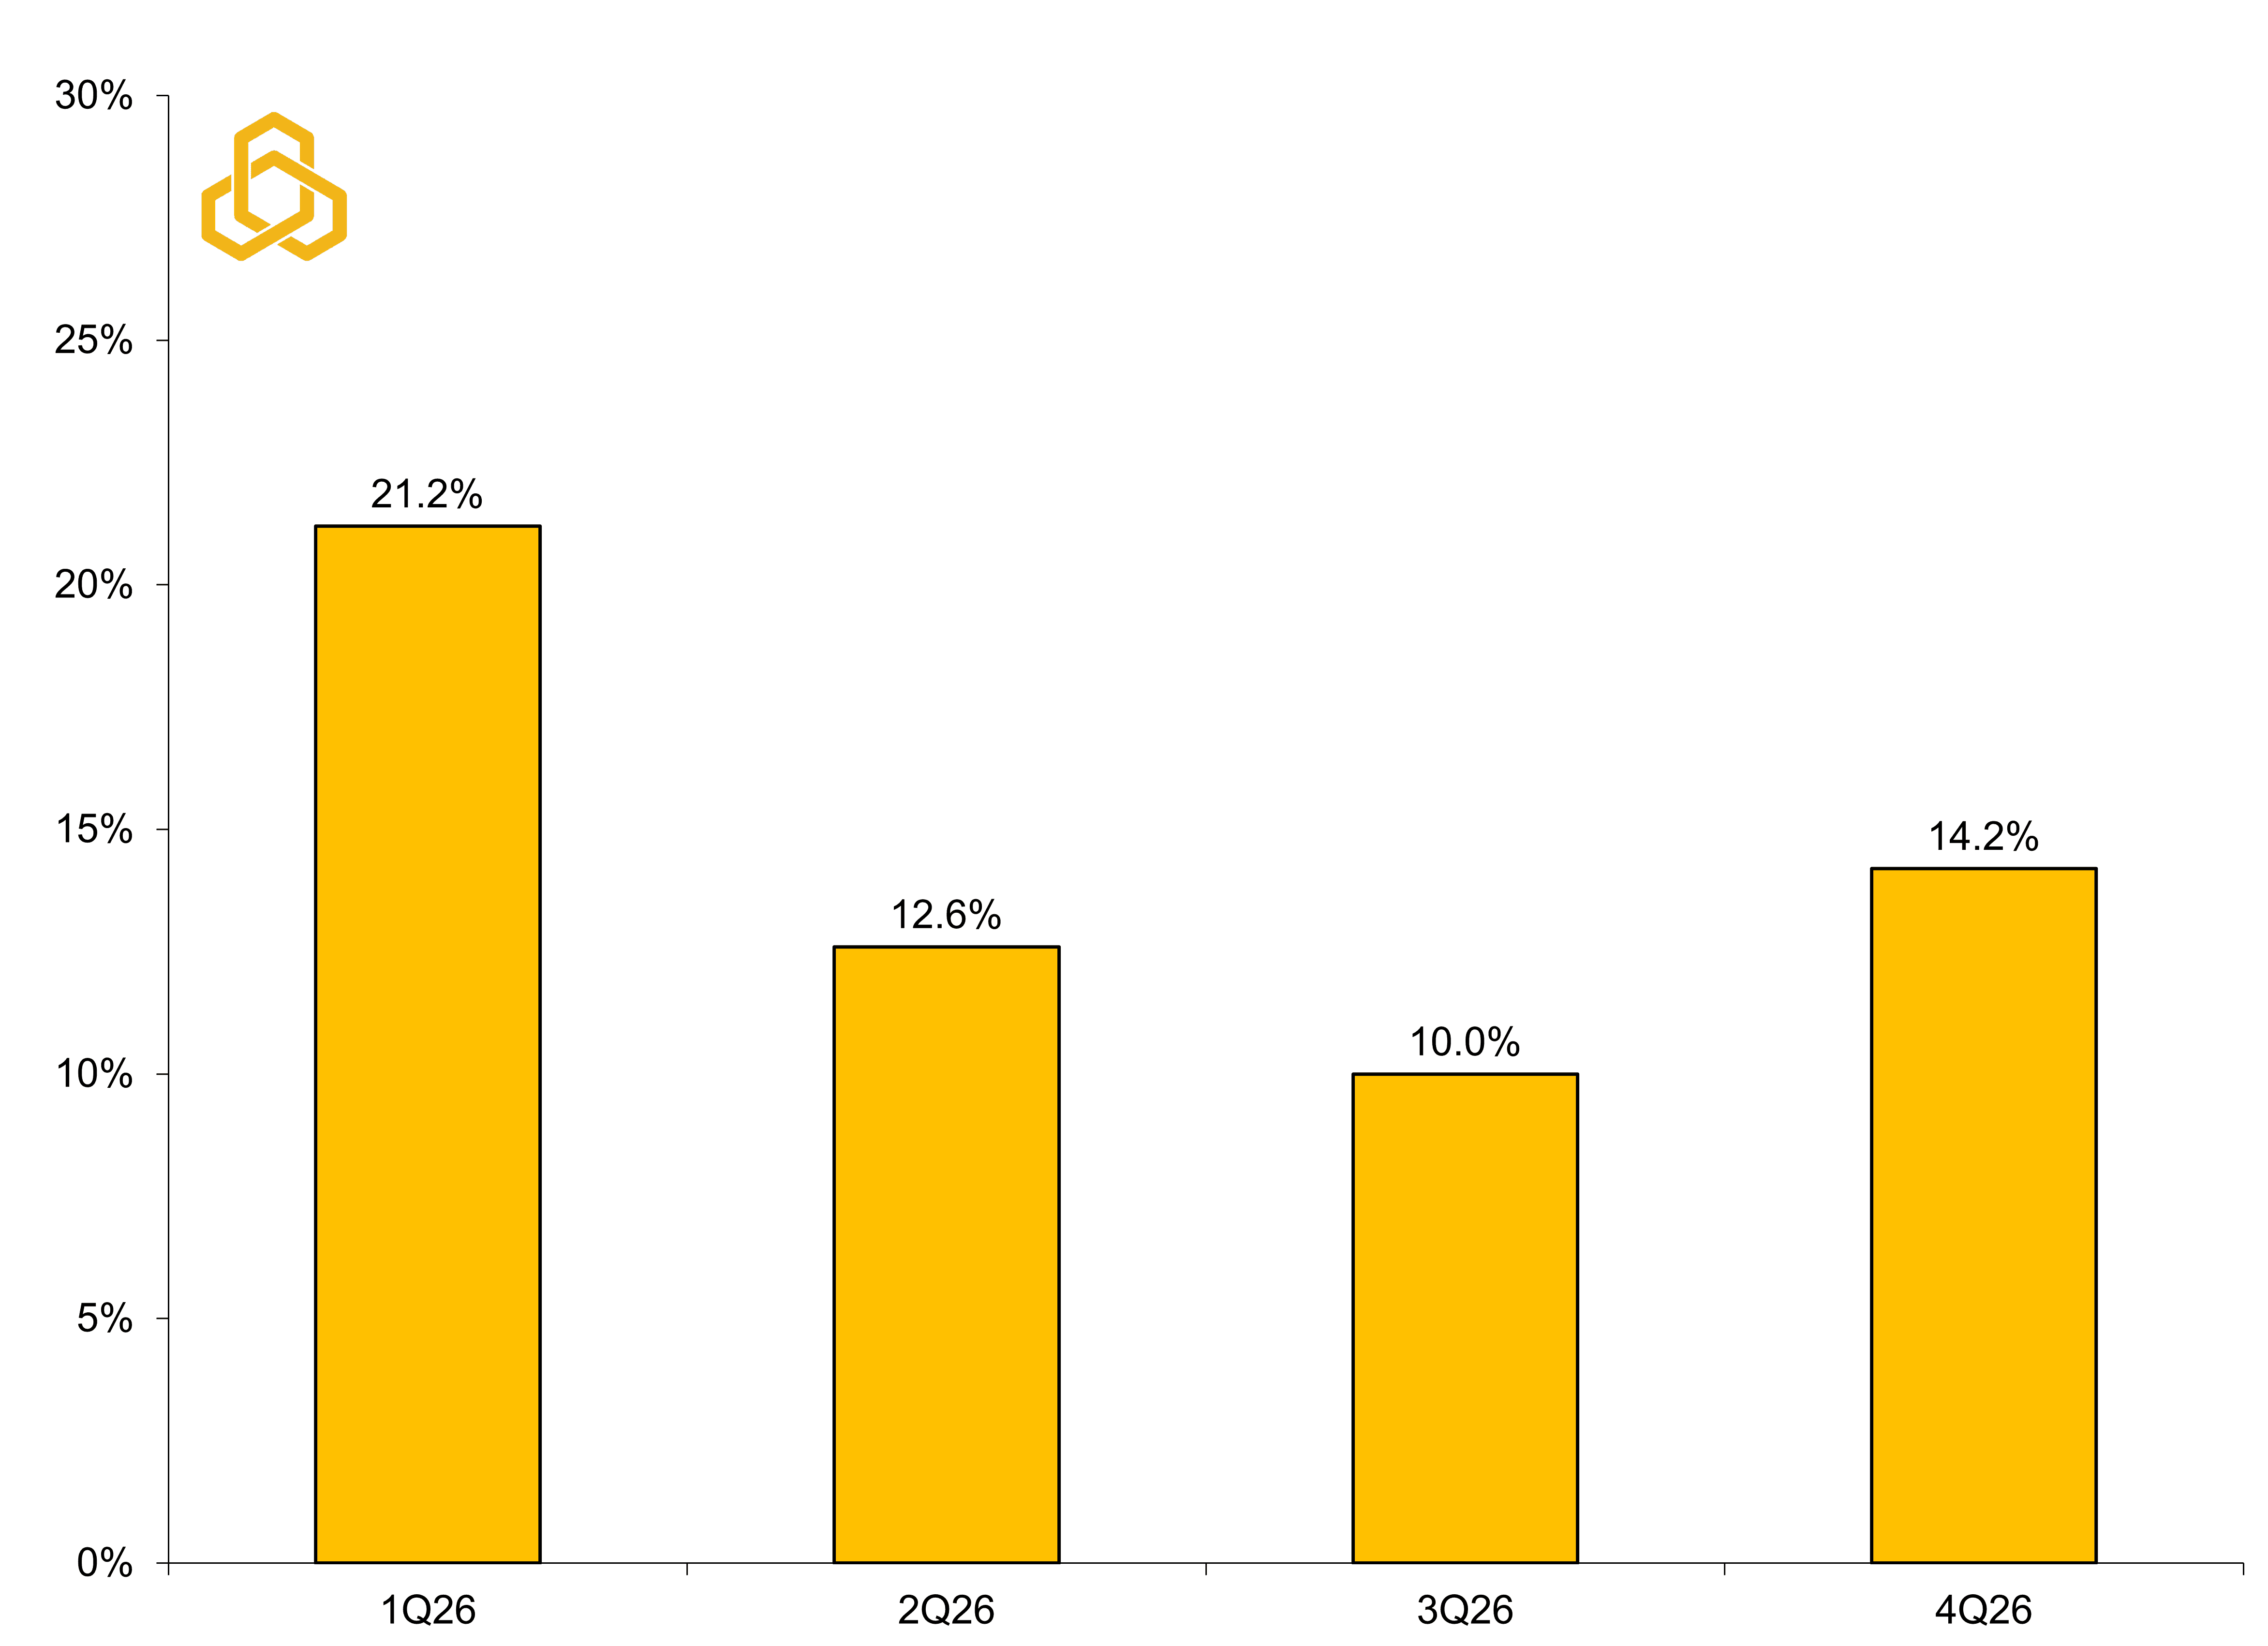
Sources: Standard & Poor’s, Bloomberg L.P., and Potomac. Data as of May 8, 2026. All forecasts are expressions of opinions and are subject to change without notice and are not intended to be a guarantee.
If there were to be a period of greater market volatility or a pullback, that window may represent the most vulnerable point as higher input costs and slowing earnings growth work their way through the broader economy. For now, however, the market continues to respond to what remains one of the strongest private-sector investment cycles in decades.
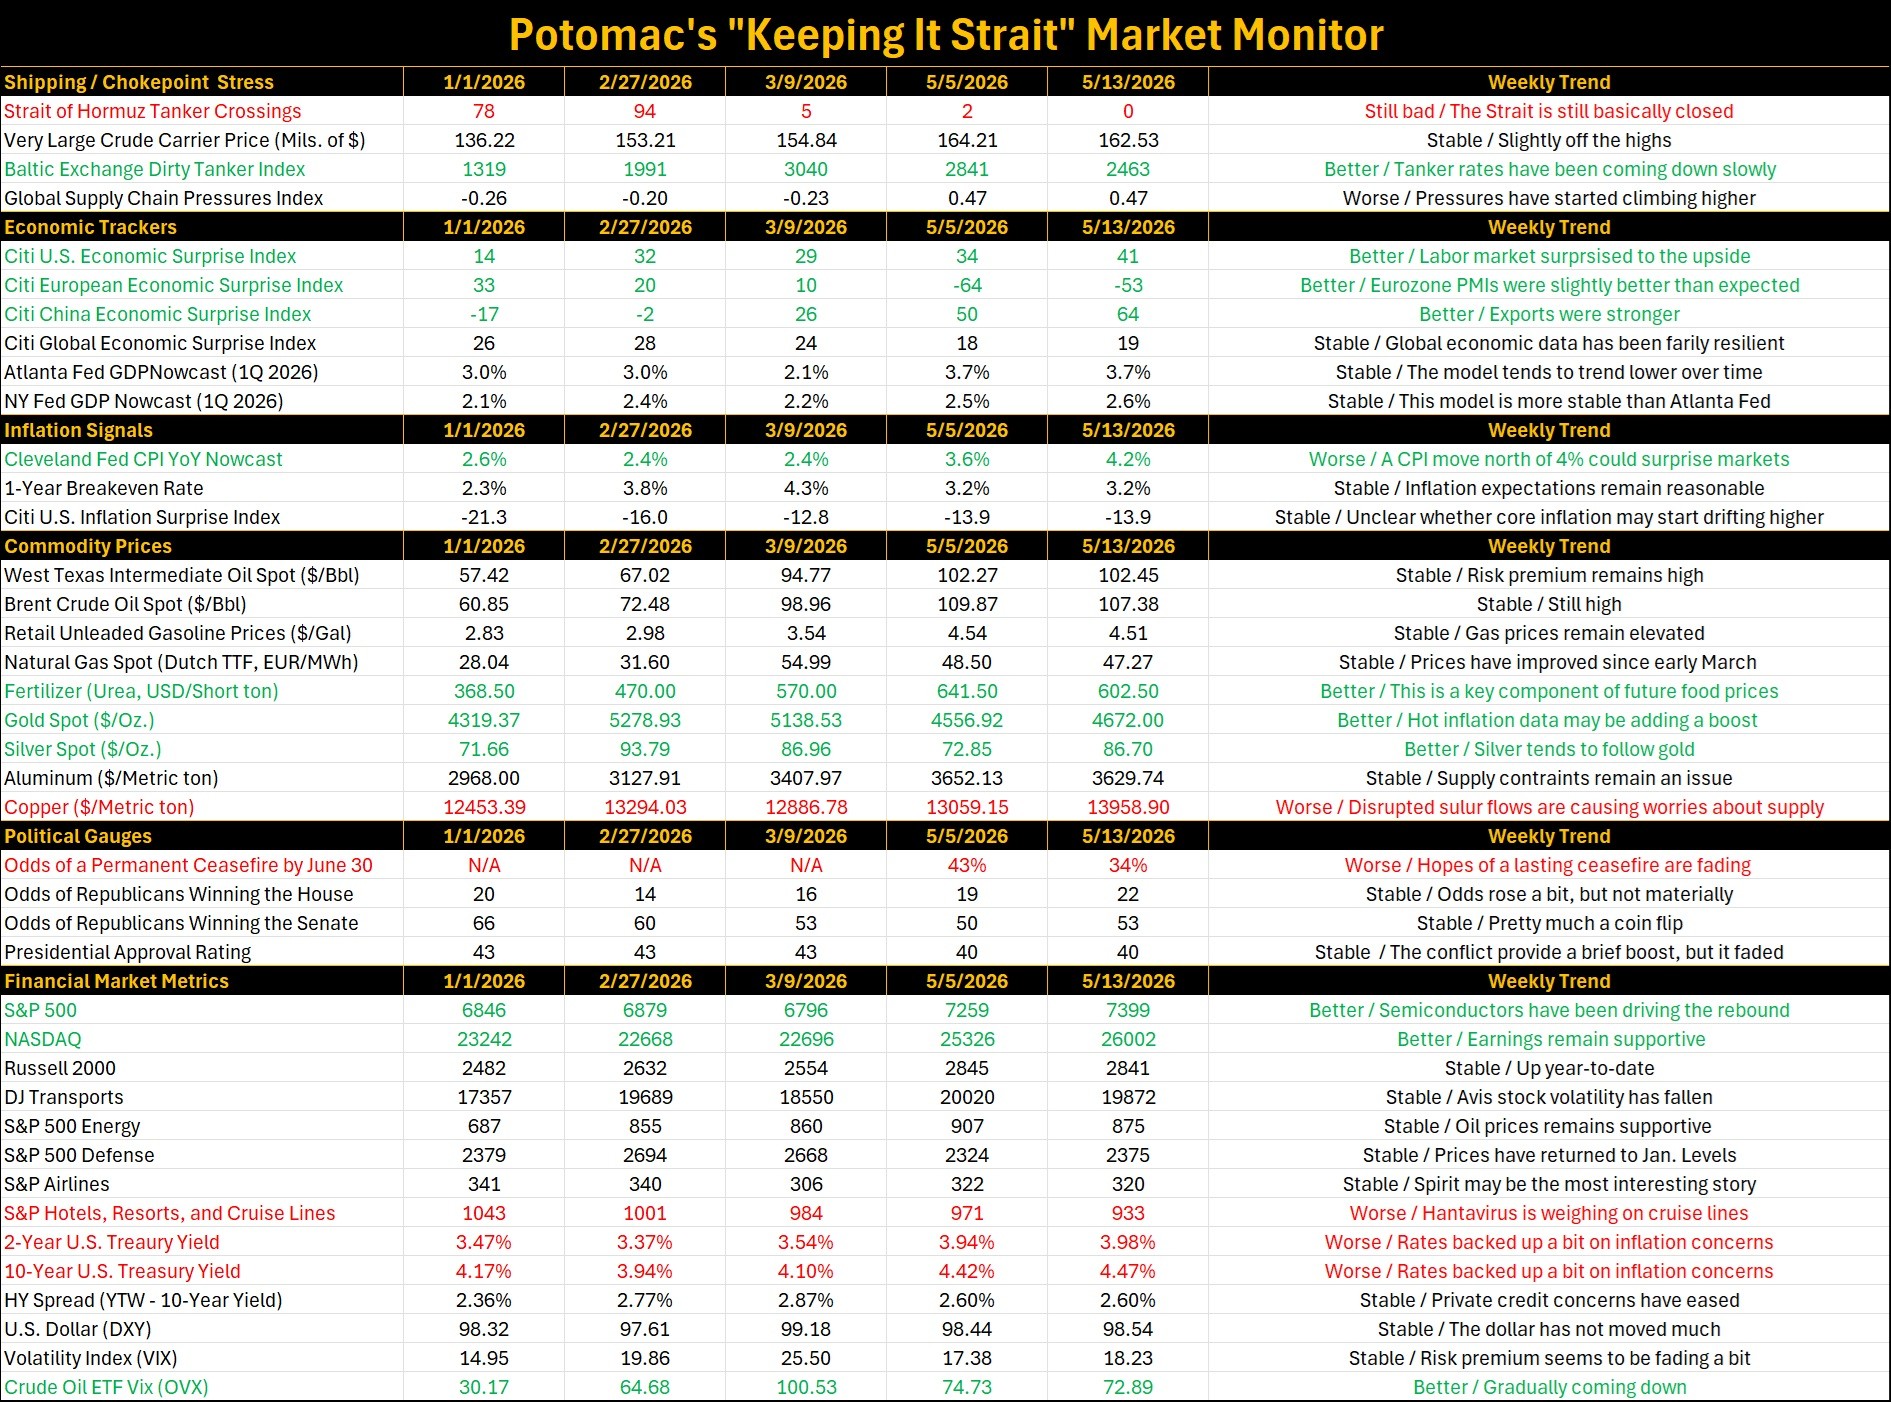
Weekly “Keeping it Strait” Highlights:
The Strait of Hormuz remains closed. According to Polymarket, the odds of a permanent ceasefire by June 30 have now fallen to just 34%.
The Cleveland Fed CPI Nowcast is now predicting 4.2% inflation for May. Inflation north of 4% could further solidify market expectations of the next Fed move being a hike, not a cut.
Copper prices have been climbing higher as disrupted sulfur flows are causing worries about copper supply.
Cruise line stocks sold off on news of hantavirus infecting a number of passengers.