Will the War Lead to a Regime Change in Inflation?
It has been almost exactly five years since Fed Chair Powell first said that inflation would pick up in the coming months, but that it would be temporary and not enough for the Fed to alter its record-low interest rate policies. By mid-2021, that language evolved into the now well-known “transitory” inflation narrative.
Remarkably, here we are again. Fed officials are warning that prices may rise in response to the Iran conflict, yet inflation expectations remain anchored and there is “no need to make a decision right now.” Even prior to the conflict, futures markets were not pricing in another Fed move until July, so this stance is not surprising. They were waiting then and they are waiting now.
Like the Fed, we do not know what path inflation will ultimately take, but “up” seems like a reasonable starting point given the surge in oil prices (see figure 1). The more important question is what that means for risk assets and diversification going forward.
Figure 1. Consumer Prices vs. Crude Oil Prices (Year-on-Year Percent Change)
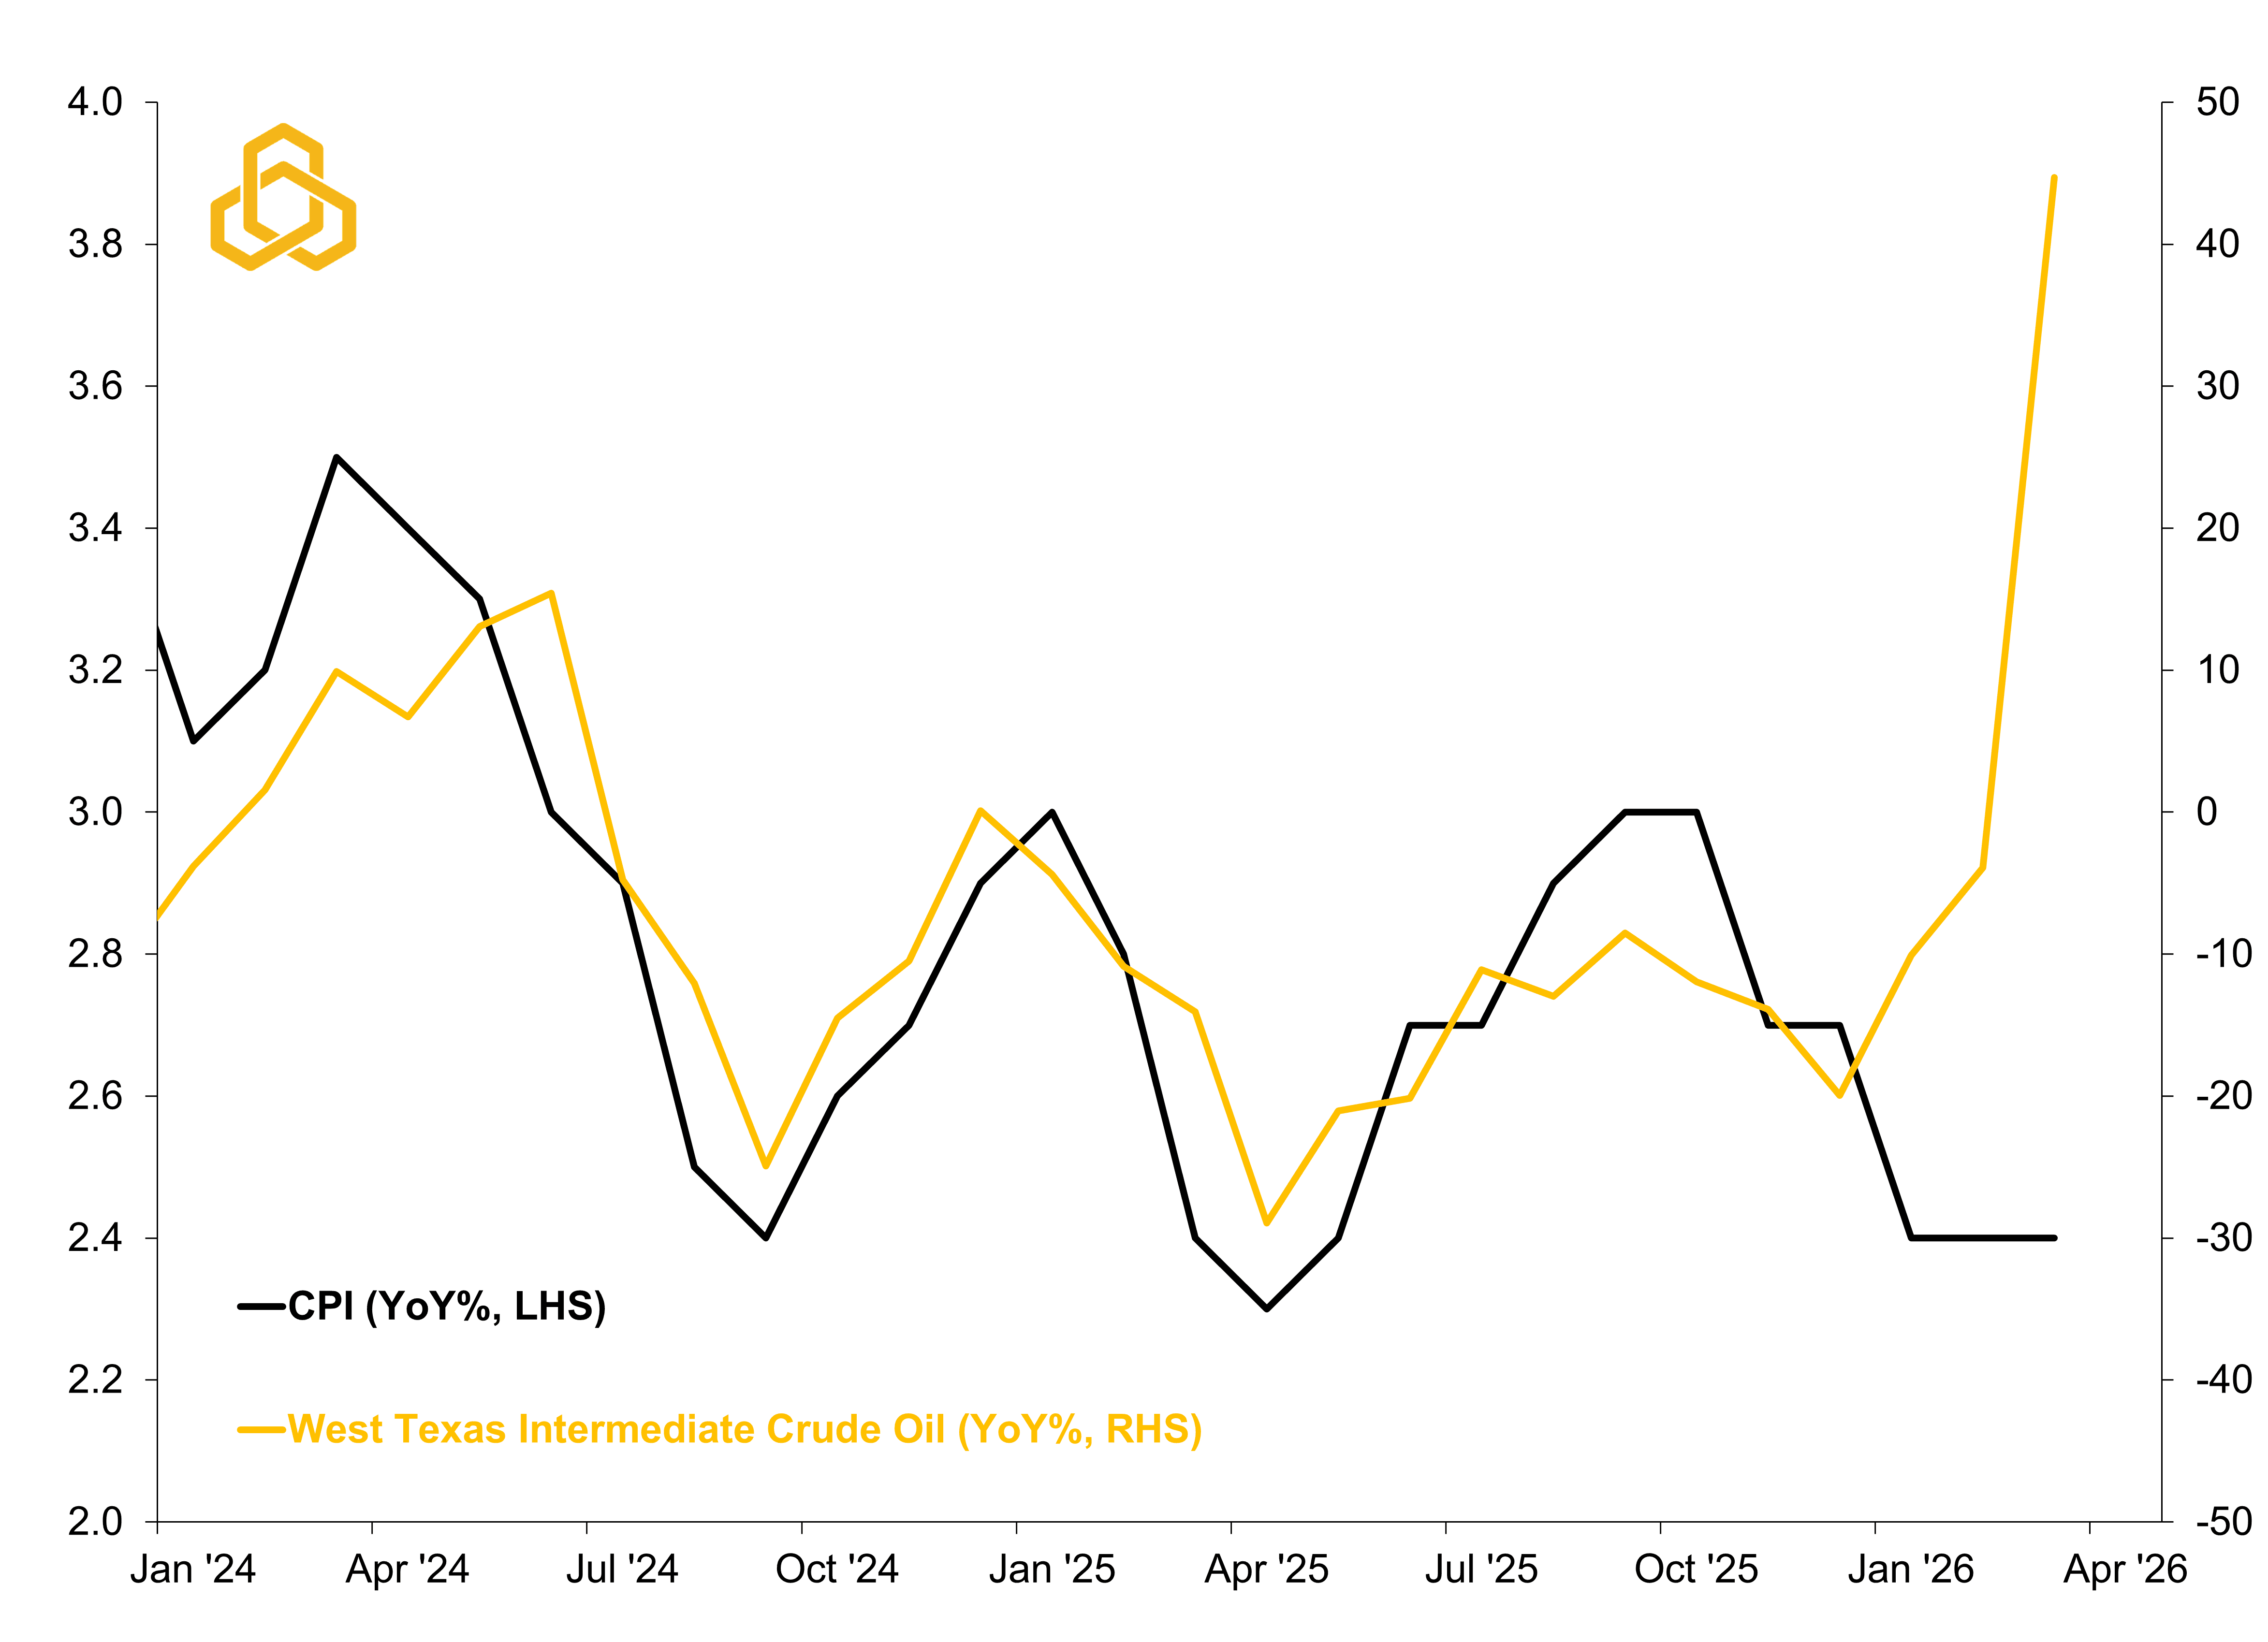
Source: Bureau of Labor Statistics, Department of Energy, Bloomberg L.P. and Potomac. Data as of March 31, 2026.
Historically, the stock market and inflation can co-exist. Returns tend to weaken when inflation is elevated, but they are often still positive. As figure 2 shows, returns are strongest when inflation is below 3%, then gradually deteriorate as inflation rises. Returns fall to 8.1% when inflation runs between 3% and 5% and drop further to just 2.6% when inflation moves above 5%. On the surface, that pattern suggests inflation is simply bad for stocks.
Figure 2. S&P 500 Annual Returns in Different Inflation Regimes (1973 – 2026)
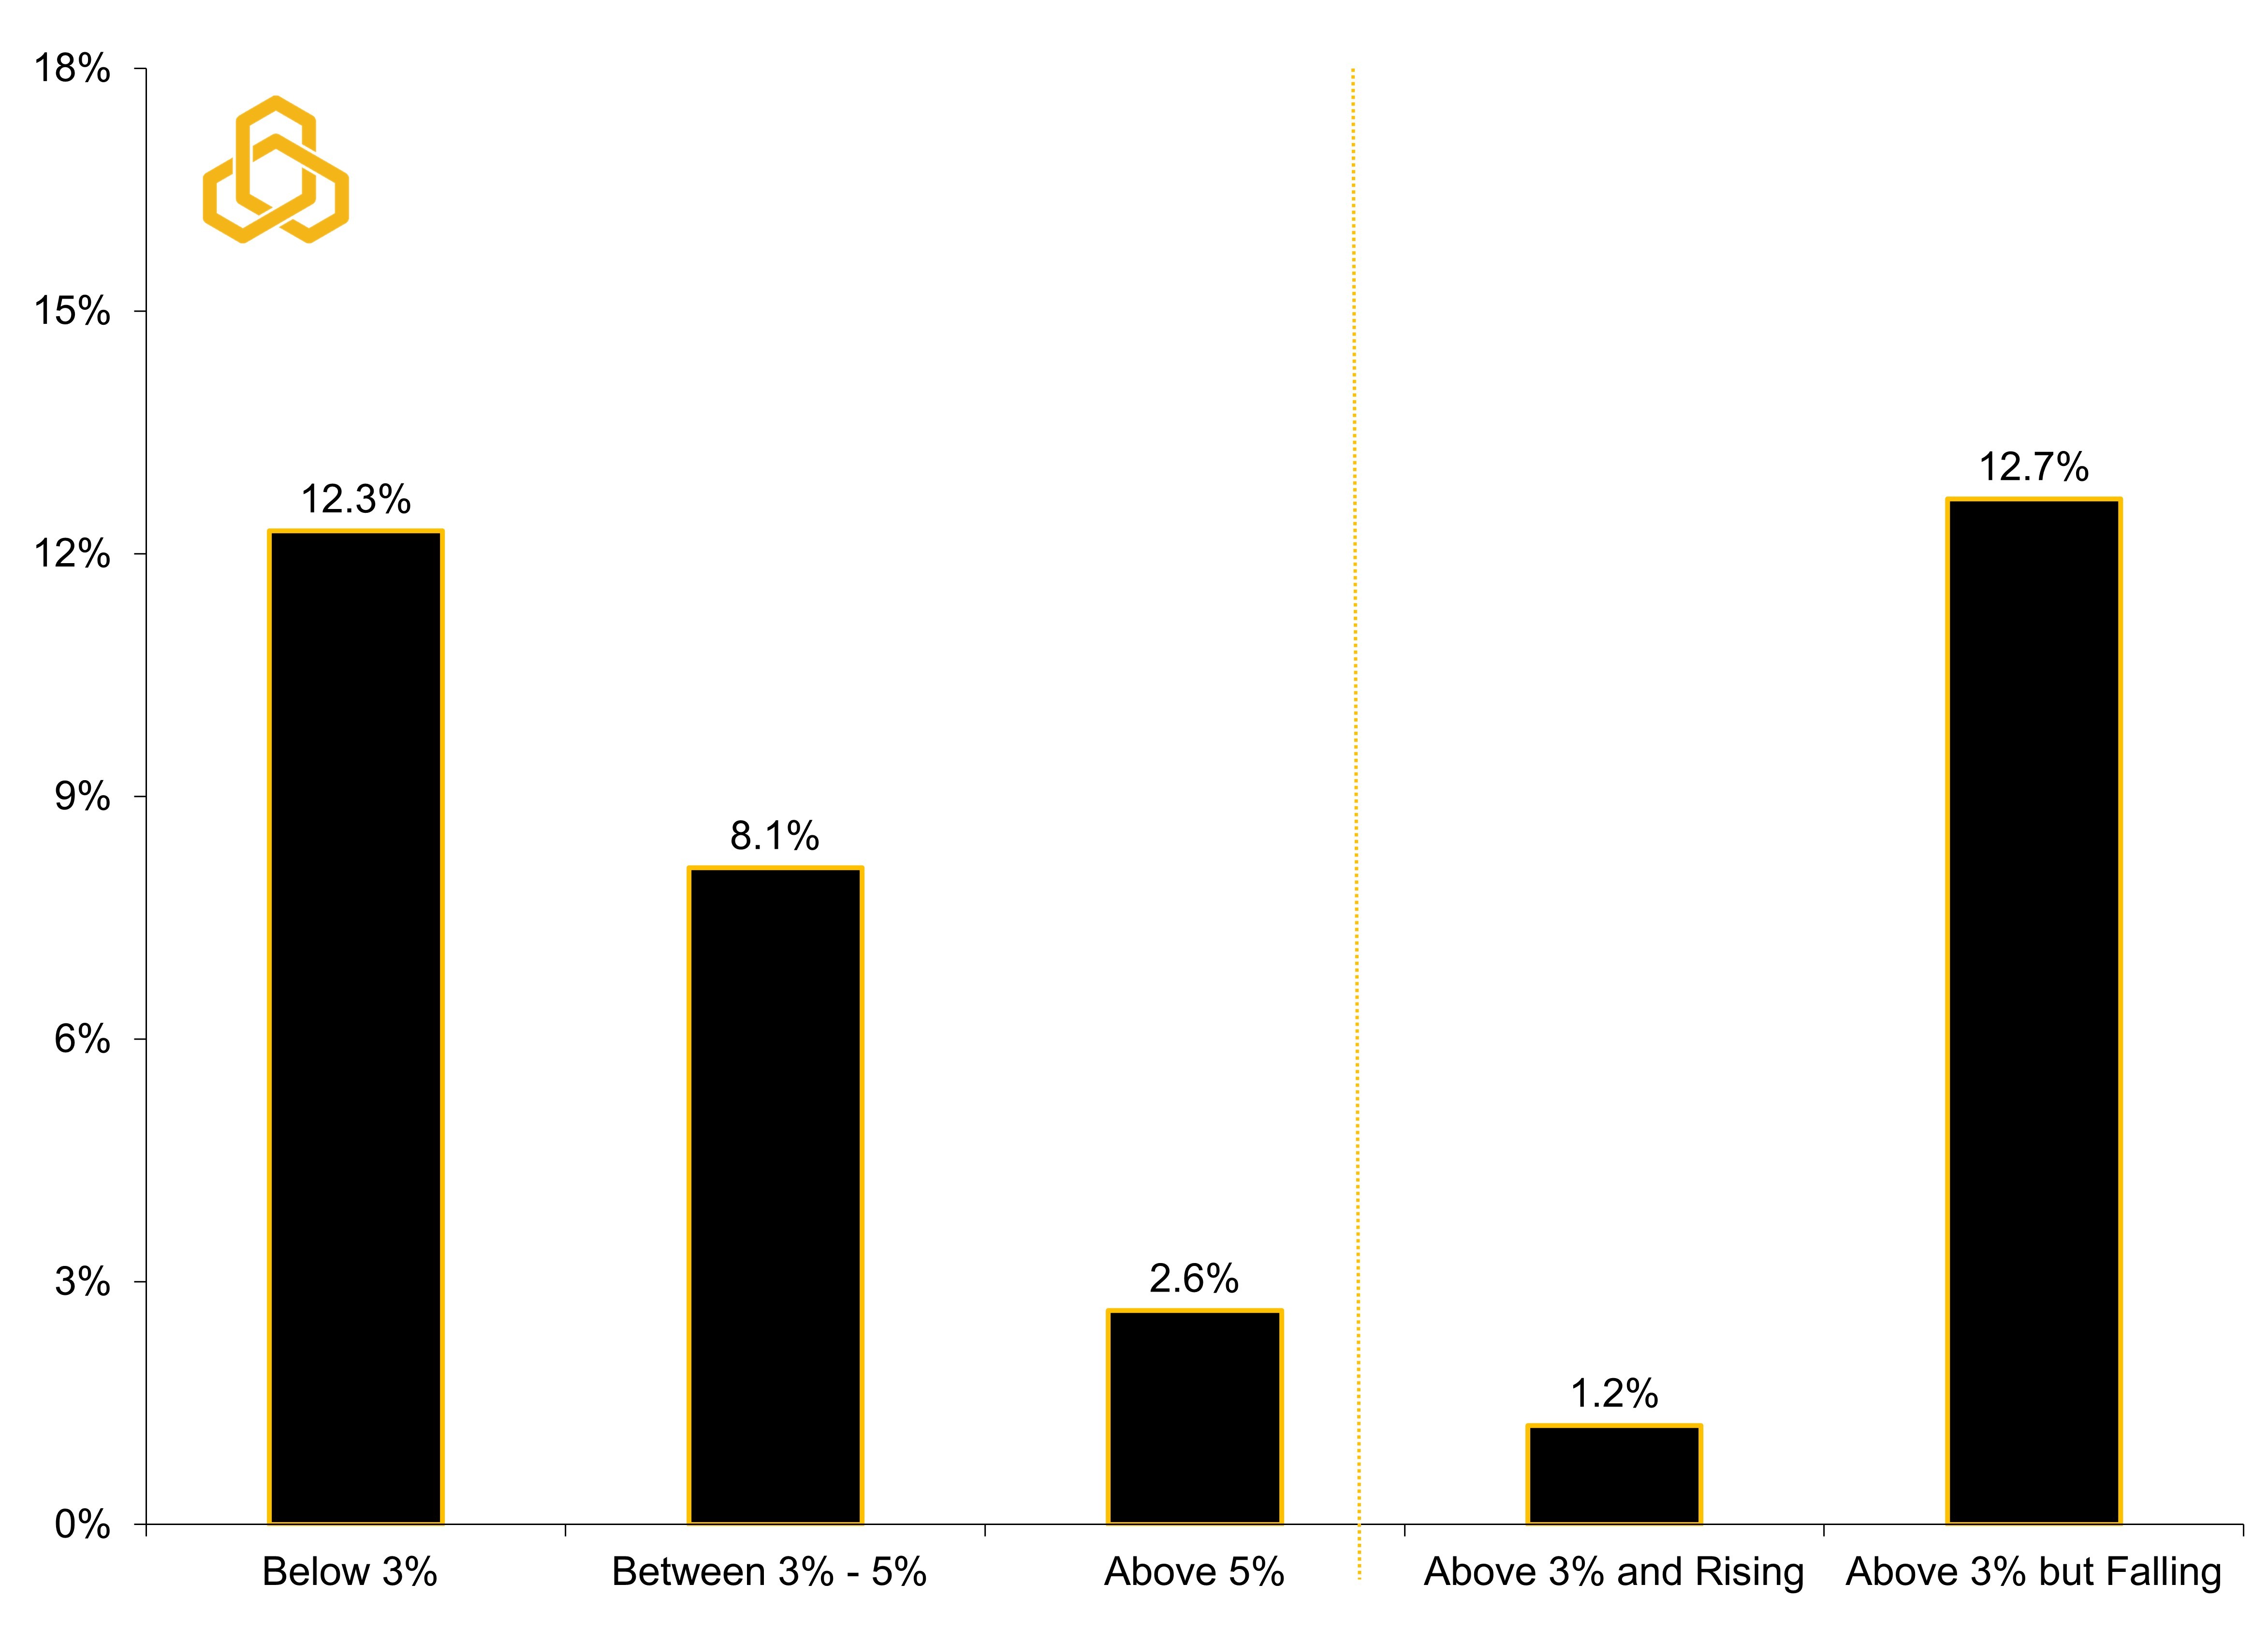
Source: Standard & Poor’s, Bloomberg, L.P., and Potomac. Data as of March 31, 2026. Past performance is no guarantee of future results. It is not possible to invest directly in an index. Note: The return estimates are annualized average monthly returns during periods of different inflation regimes.
However, that interpretation misses the most important point.
It is not the level of inflation that drives equity returns, but the direction of inflation and how monetary policy responds. When inflation rises above 3%, returns collapse to just over 1%, reflecting tightening financial conditions and the market pricing in a more aggressive Fed. In contrast, when inflation is still elevated but falling, returns rebound sharply to an average of 12.7%, roughly in line with low-inflation environments. In other words, stocks do not trade the level of inflation. They trade the change in inflation and the expected path of policy.
The market is not asking whether inflation is high. It is asking whether it is getting worse.
We remain in the camp that a rate hike will ultimately be avoided as tensions ease and the labor market remains sluggish. However, the recent whipsaw in gold prices serves as a useful reminder that markets tend to move ahead of Fed communication (see figure 3 and No More Goldilocks for Gold? Here is What Changed for additional detail).
Figure 3. Gold Spot Price vs. 10-Year Treasury Real Yield
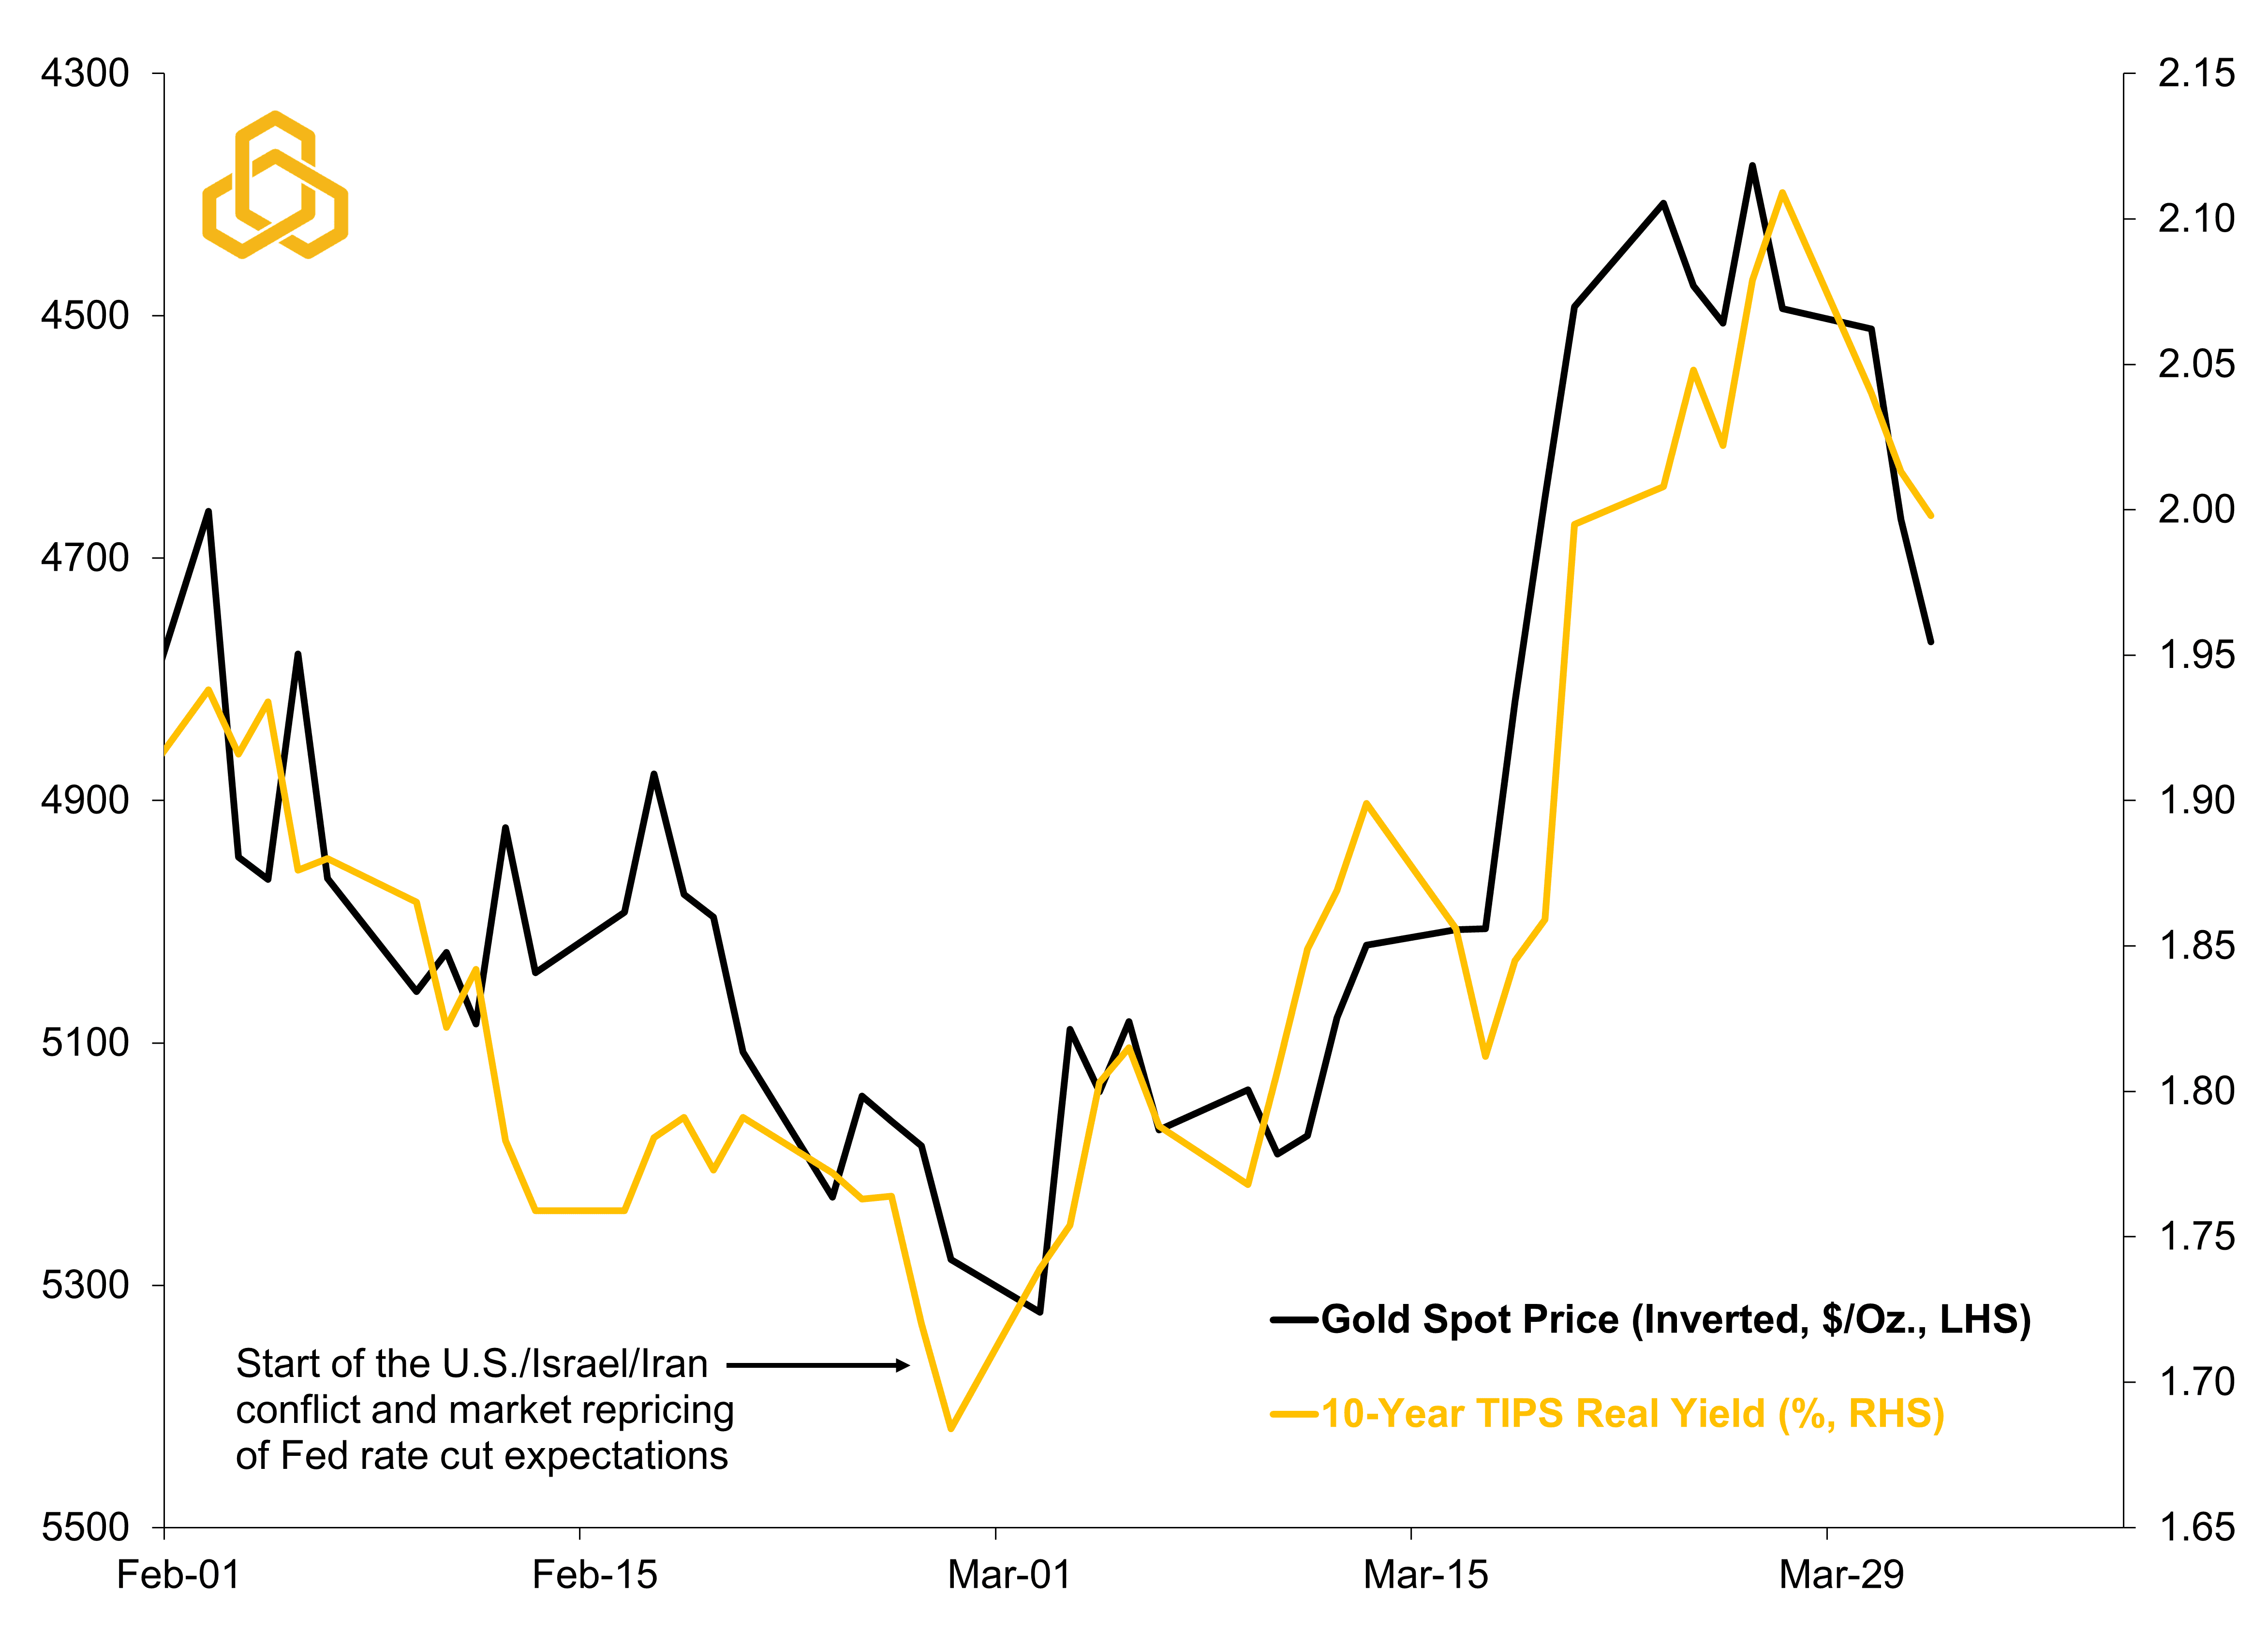
Source: Bloomberg, L.P., Department of Treasury, and Potomac. Data as of April 1, 2026
Another complicating aspect of rising inflation is that asset class correlations begin to shift. Traditional portfolio diversifiers like bonds can become more positively correlated with equities as yields rise alongside inflation expectations.
While we do not expect a repeat of 2022, when stock-bond correlations surged, there are already early signs that bonds may once again begin to move in the same direction as equities see figure 4 and Bear Market in Diversification from Potomac Co-CIO Dan Russo).
Figure 4. Stock/Bond Correlation vs. the Consumer Price Index
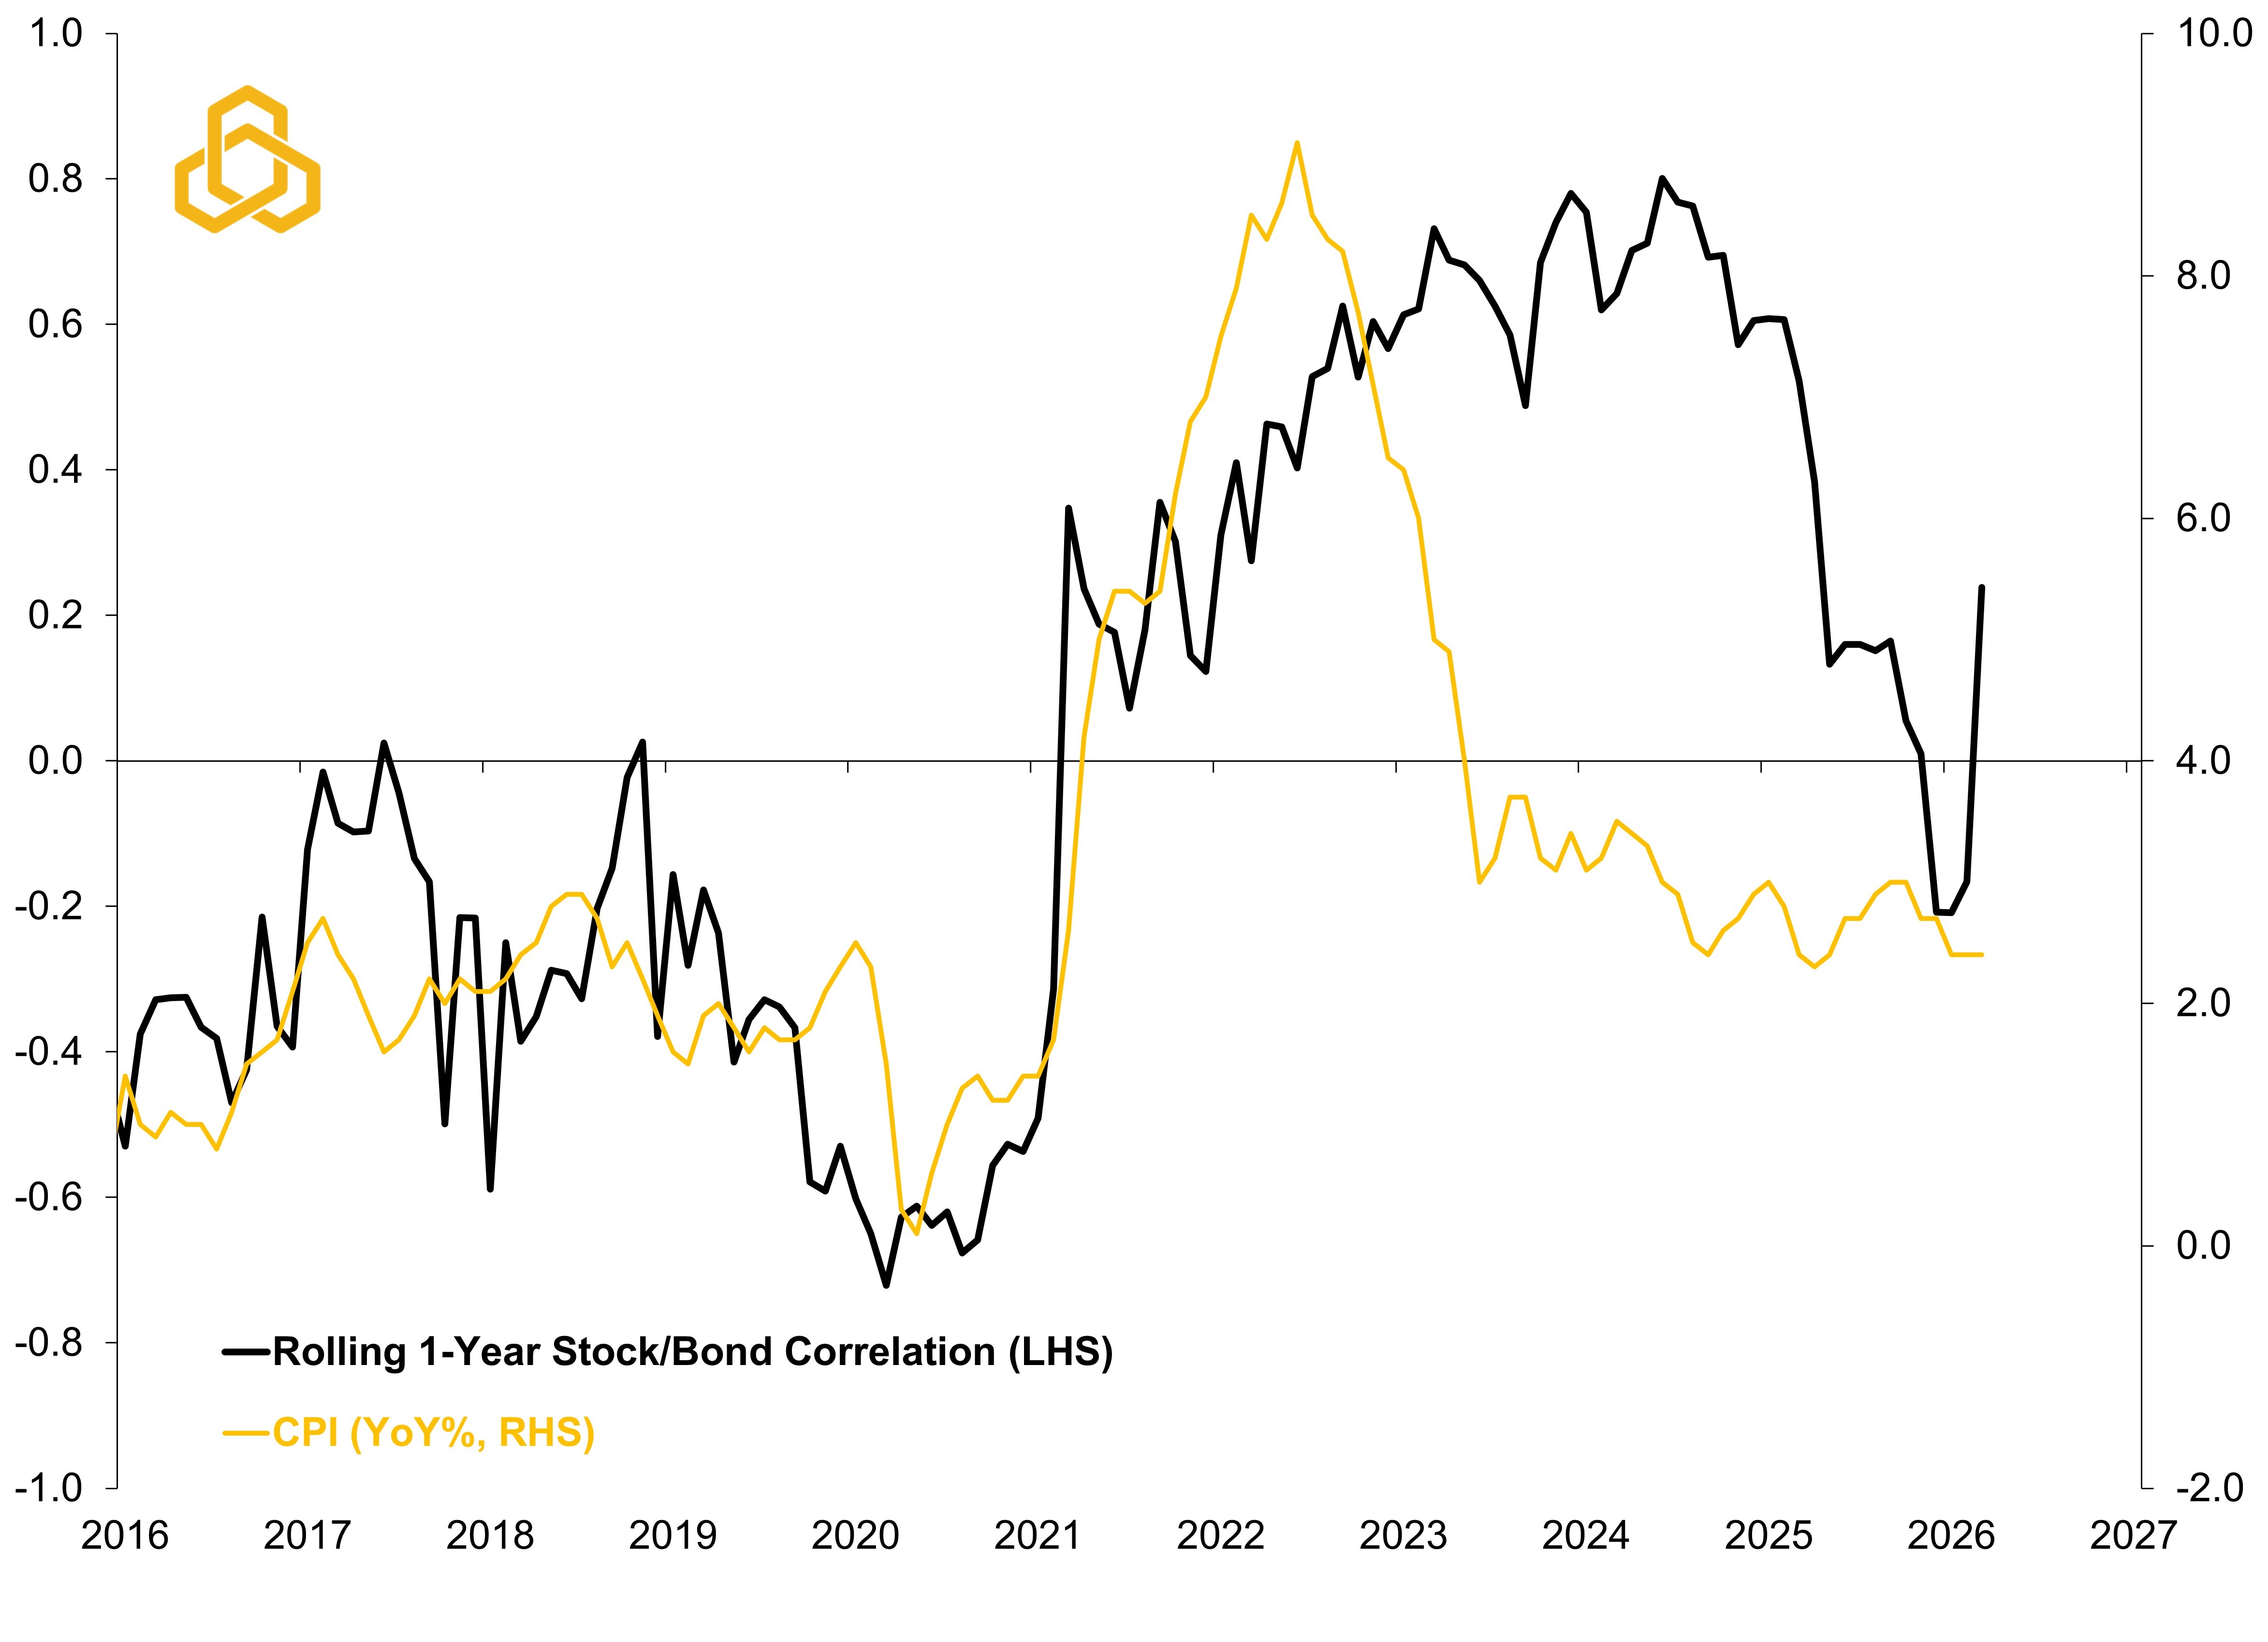
Source: Standard & Poor’s, U.S. Department of Treasury, Bloomberg, L.P., and Potomac. Data as of April 1, 2026. Note: “Stocks” are S&P 500 Total Return and “Bonds” are the Bloomberg U.S. Treasury Total Return Unhedged USD.
Importantly, this dynamic is not limited to bonds.
Assets typically viewed as inflation hedges, such as commodities or Treasury Inflation-Protected Securities (TIPS), also tend to become more positively correlated with equities during inflation shocks (see figure 5). The reason is straightforward. Inflation lifts nominal activity across the system. Commodity prices rise, breakeven inflation increases, and corporate revenues initially benefit from higher nominal growth. Rather than diversifying risk, these assets can end up reinforcing it.
Figure 5. Asset Class Correlations to Stocks During Different Inflation Regimes
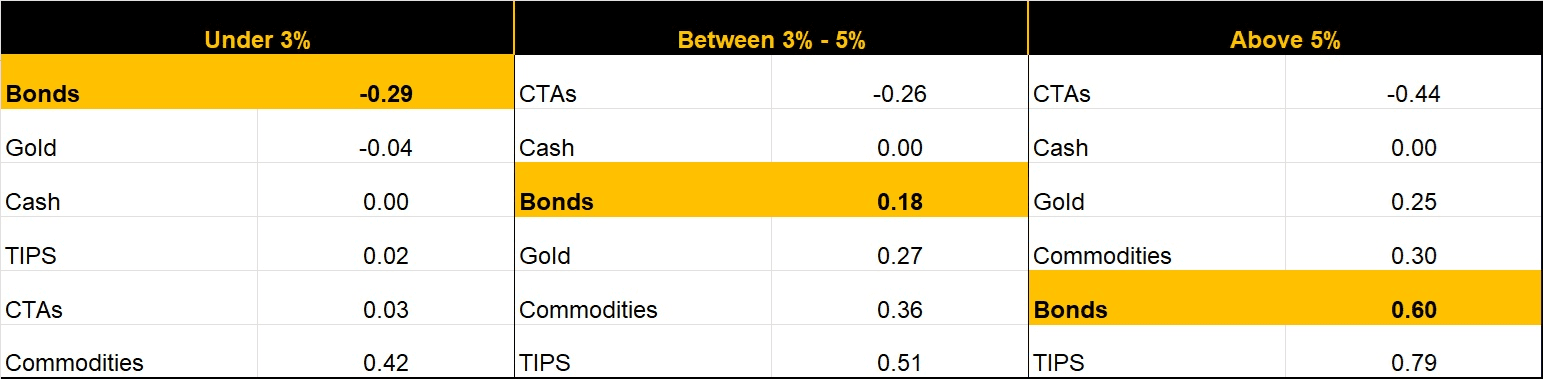
Sources: Bloomberg, L.P. and Potomac. Note: Correlation data are from June 2002 until December 31, 2025. Note: Commodity Trading Advisors are active managers that typically use systemic or rules-based strategies to trade futures, currencies, and other liquid markets. CTA strategies involve a number of risk and considerations that investors should understand before investing.
In an environment like this, static portfolios become less effective. Investors may want to consider more flexible approaches, whether through tactical strategies that can raise cash when correlations rise, or through strategies such as Commodity Trading Advisors ( CTAs), that can position for shifts in macro regimes. Both offer something traditional allocations cannot: the ability to adapt.
Weekly “Keeping it Strait” Highlights:
The Citi U.S. Inflation Surprise Index worsened during the week with the index rising from -12.8 to -2.2. This tracks with survey data like the ISM prices paid index which pointed to surging input costs in March.
Gold prices slipped – falling to $4,785 an ounce. However, real yields have come down since and prices seem to be finding support.
Treasury yields stabilized after Fed Chair Powell calmed markets’ concerns about a rate hike by expressing continued Fed patience and affirming that inflation expectations remain anchored.
The odds of a ceasefire by April 30, 2026 are around 36% according to Polymarket’s betting platform.
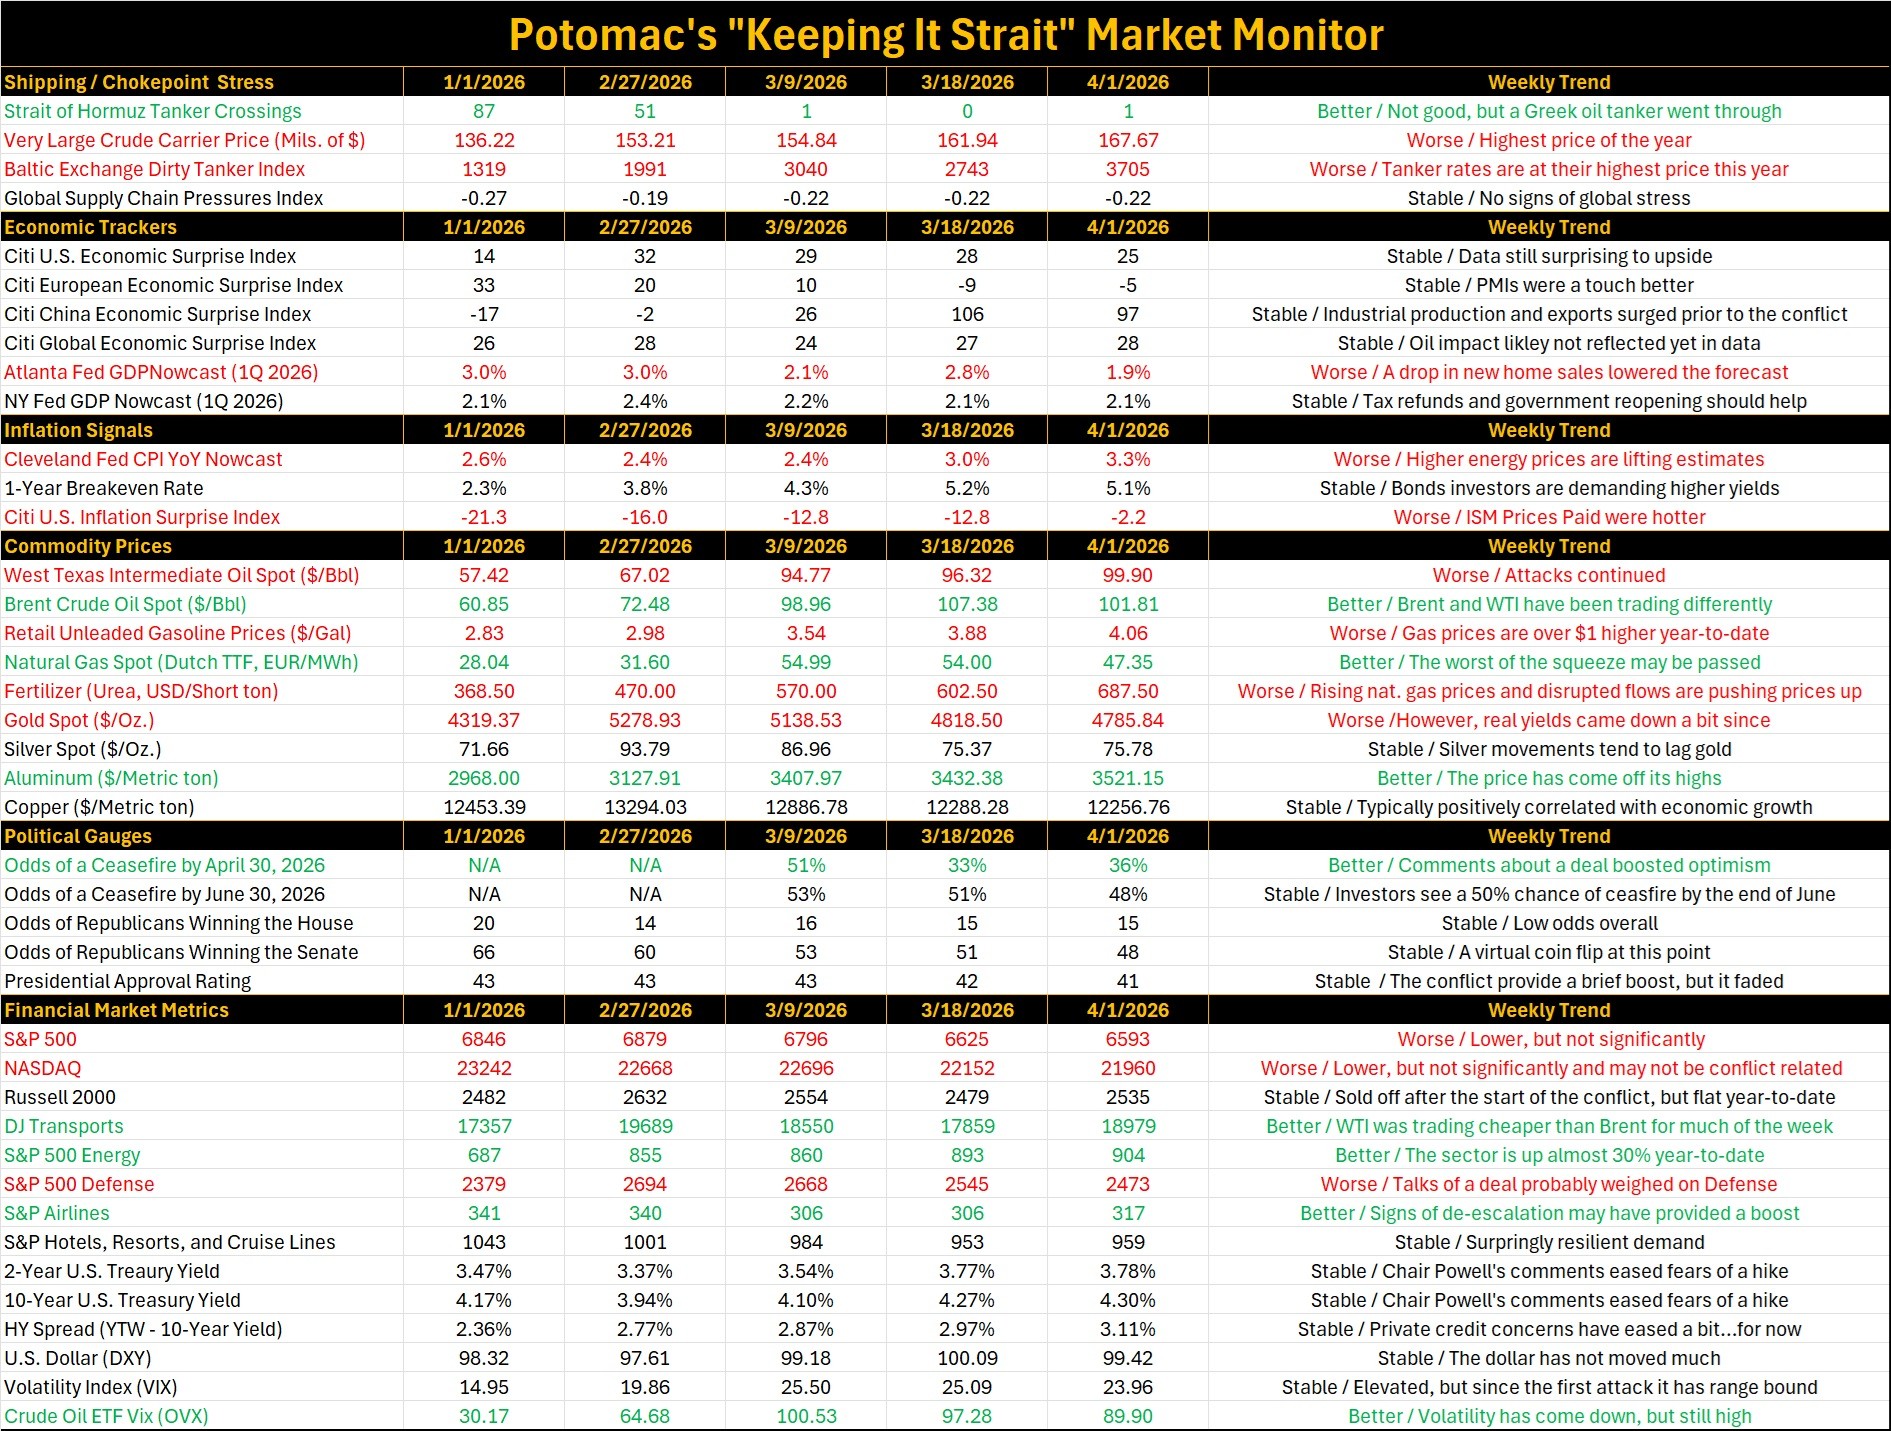
Source: Bloomberg L.P. and Potomac. Data as of April 1, 2026. Note 1: The dates selected are 2/27/2026 (start of the conflict), 3/9/2026 (initial oil surge/peak as the Strait closed), and the latest week and previous week to compare the weekly trend. Note 2: Economic and inflation surprise index readings about zero imply that data are beating the consensus on average, below zero means that data are missing expectations. Note 3: In commodity prices, we ranked higher oil, natural gas, retail gas, fertilizer, and aluminum prices as bad for the economy because it weighs on growth, we ranked rising gold and silver prices are good due to the investor perspective. Note 4: Political betting market odds are forecasts. All forecasts are expressions of opinions and are subject to change without notice and are not intended to be a guarantee.
PFM-322-20260401